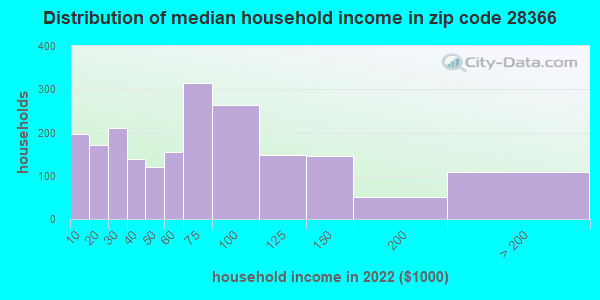
Estimated zip code population in 2022: 5,106 Zip code population in 2010: 5,061 Zip code population in 2000: 4,726
Houses and condos: 2,350 Renter-occupied apartments: 458
% of renters here:
23%
State:
33%
March 2022 cost of living index in zip code 28366: 79.5 (low, U.S. average is 100)
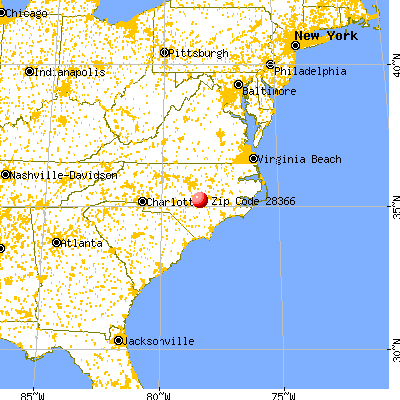
Land area: 84.6 sq. mi. Water area: 0.3 sq. mi.
Population density: 60 people per square mile
(very low).
OSM Map
General Map
Google Map
MSN Map
OSM Map
General Map
Google Map
MSN Map
OSM Map
General Map
Google Map
MSN Map
OSM Map
General Map
Google Map
MSN Map
Please wait while loading the map...
Real estate property taxes paid for housing units in 2022:
This zip code:
0.8% ($1,057)
North Carolina:
0.6% ($1,769)
Median real estate property taxes paid for housing units with mortgages in 2022: $1,197 (0.9%) Median real estate property taxes paid for housing units with no mortgage in 2022: $981 (0.7%)
Business Search- 14 Million verified businesses
Males: 2,493
(48.8%)
Females: 2,612
(51.2%)
For population 25 years and over in 28366:
High school or higher: 78.8%
Bachelor's degree or higher: 17.9%
Graduate or professional degree: 5.4%
Unemployed: 1.5%
Mean travel time to work (commute): 41.1 minutes
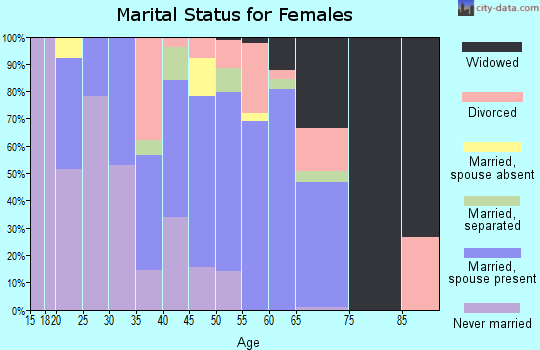
For population 15 years and over in 28366:
Never married: 27.2%
Now married: 52.7%
Separated: 0.7%
Widowed: 9.7%
Divorced: 9.6%
Zip code 28366 compared to state average:
Median house value below state average.
Unemployed percentage below state average.
Hispanic race population percentage above state average.
Foreign-born population percentage below state average.
Length of stay since moving in significantly above state average.
Number of college students significantly below state average.
Percentage of population with a bachelor's degree or higher below state average.
Averages for the 2020 tax year for zip code 28366, filed in 2021:
Average Adjusted Gross Income (AGI) in 2020: $60,488 (Individual Income Tax Returns)
Here:
$60,488
State:
$70,020
Salary/wage: $44,989 (reported on 83.6% of returns)
Here:
$44,989
State:
$58,387
(% of AGI for various income ranges: 1494.1% for AGIs below $25k, 3956.2% for AGIs $25k-50k, 7890.5% for AGIs $50k-75k, 10770.0% for AGIs $75k-100k, 18611.0% for AGIs $100k-200k)
Taxable interest for individuals: $952 (reported on 21.3% of returns)
This zip code:
$952
North Carolina:
$1,479
(% of AGI for various income ranges: 7.9% for AGIs below $25k, 6.8% for AGIs $25k-50k, 63.7% for AGIs $50k-75k, 23.6% for AGIs $75k-100k, 96.0% for AGIs $100k-200k)
Ordinary dividends: $9,171 (reported on 7.6% of returns)
Here:
$9,171
State:
$7,888
(% of AGI for various income ranges: 12.1% for AGIs below $25k, 58.9% for AGIs $50k-75k, 55.5% for AGIs $75k-100k, 162.0% for AGIs $100k-200k)
Net capital gain/loss in AGI: +$12,106 (reported on 7.1% of returns)
Here:
+$12,106
State:
+$23,652
(% of AGI for various income ranges: 7.4% for AGIs below $25k, 154.2% for AGIs $50k-75k, 91.0% for AGIs $100k-200k)
Profit/loss from business: +$10,537 (reported on 16.9% of returns)
Here:
+$10,537
State:
+$11,710
(% of AGI for various income ranges: 206.2% for AGIs below $25k, 139.0% for AGIs $25k-50k, 243.7% for AGIs $50k-75k, 168.2% for AGIs $75k-100k, 1465.0% for AGIs $100k-200k)
Taxable individual retirement arrangement distribution: $9,209 (reported on 4.9% of returns)
28366:
$9,209
North Carolina:
$20,247
(% of AGI for various income ranges: 32.8% for AGIs below $25k, 34.2% for AGIs $25k-50k, 207.4% for AGIs $50k-75k, 258.0% for AGIs $100k-200k)
Total itemized deductions: $28,567 (reported on 2.7% of returns)
Here:
$28,567
State:
$34,549
(% of AGI for various income ranges: 496.8% for AGIs $50k-75k, 770.0% for AGIs $100k-200k)
Charity contributions: $8,800 (reported on 2.2% of returns)
Here:
$8,800
State:
$13,360
(% of AGI for various income ranges: 59.5% for AGIs $50k-75k, 327.0% for AGIs $100k-200k)
Taxes paid: $6,100 (reported on 2.7% of returns)
28366:
$6,100
State:
$7,586
(% of AGI for various income ranges: 82.6% for AGIs $50k-75k, 209.0% for AGIs $100k-200k)
Earned income credit: $2,582 (reported on 24.4% of returns)
Here:
$2,582
State:
$2,337
(% of AGI for various income ranges: 161.4% for AGIs below $25k, 96.8% for AGIs $25k-50k)
Percentage of individuals using paid preparers for their 2020 taxes: 92.9%
Here:
93%
State:
93%
(% for various income ranges: 92.2% for AGIs below $25k, 93.8% for AGIs $25k-50k, 93.5% for AGIs $50k-75k, 88.9% for AGIs $75k-100k, 94.4% for AGIs $100k-200k, 100.0% for AGIs over 200k)
Averages for the 2012 tax year for zip code 28366, filed in 2013:
Average Adjusted Gross Income (AGI) in 2012: $40,338 (Individual Income Tax Returns)
Here:
$40,338
State:
$54,937
Salary/wage: $34,651 (reported on 86.2% of returns)
Here:
$34,651
State:
$46,336
(% of AGI for various income ranges: 80.8% for AGIs below $25k, 84.8% for AGIs $25k-50k, 78.8% for AGIs $50k-75k, 77.2% for AGIs $75k-100k, 74.7% for AGIs $100k-200k, 37.4% for AGIs over 200k)
Taxable interest for individuals: $946 (reported on 23.2% of returns)
This zip code:
$946
North Carolina:
$1,298
(% of AGI for various income ranges: 0.5% for AGIs below $25k, 0.3% for AGIs $25k-50k, 0.5% for AGIs $50k-75k, 0.5% for AGIs $75k-100k, 1.7% for AGIs $100k-200k)
Ordinary dividends: $5,212 (reported on 7.1% of returns)
Here:
$5,212
State:
$6,213
(% of AGI for various income ranges: 0.5% for AGIs below $25k, 0.4% for AGIs $25k-50k, 0.3% for AGIs $50k-75k, 0.2% for AGIs $75k-100k, 5.1% for AGIs $100k-200k)
Net capital gain/loss in AGI: +$2,752 (reported on 9.4% of returns)
Here:
+$2,752
State:
+$12,740
(% of AGI for various income ranges: 0.6% for AGIs below $25k, 0.4% for AGIs $25k-50k, 0.3% for AGIs $50k-75k, 0.2% for AGIs $75k-100k, 2.6% for AGIs $100k-200k)
Profit/loss from business: +$8,769 (reported on 14.3% of returns)
Here:
+$8,769
State:
+$10,311
(% of AGI for various income ranges: 9.2% for AGIs below $25k, 2.1% for AGIs $25k-50k, 4.1% for AGIs $50k-75k, 1.8% for AGIs $75k-100k, 1.1% for AGIs $100k-200k)
Taxable individual retirement arrangement distribution: $8,700 (reported on 5.4% of returns)
28366:
$8,700
North Carolina:
$15,575
(% of AGI for various income ranges: 1.3% for AGIs below $25k, 1.2% for AGIs $25k-50k, 1.6% for AGIs $50k-75k, 2.7% for AGIs $75k-100k)
Total itemized deductions: $19,307 (21% of AGI, reported on 18.8% of returns)
Here:
$19,307
State:
$23,438
Here:
20.9% of AGI
State:
21.5% of AGI
(% of AGI for various income ranges: 6.0% for AGIs below $25k, 6.0% for AGIs $25k-50k, 11.1% for AGIs $50k-75k, 11.7% for AGIs $75k-100k, 11.4% for AGIs $100k-200k, 10.6% for AGIs over 200k)
Charity contributions: $3,631 (reported on 15.6% of returns)
Here:
$3,631
State:
$4,687
(% of AGI for various income ranges: 0.6% for AGIs below $25k, 0.9% for AGIs $25k-50k, 1.8% for AGIs $50k-75k, 1.9% for AGIs $75k-100k, 2.4% for AGIs $100k-200k, 1.4% for AGIs over 200k)
Taxes paid: $7,490 (reported on 18.8% of returns)
28366:
$7,490
State:
$8,823
(% of AGI for various income ranges: 0.6% for AGIs below $25k, 1.3% for AGIs $25k-50k, 2.9% for AGIs $50k-75k, 4.3% for AGIs $75k-100k, 5.5% for AGIs $100k-200k, 8.8% for AGIs over 200k)
Earned income credit: $2,591 (reported on 25.4% of returns)
Here:
$2,591
State:
$2,376
(% of AGI for various income ranges: 8.1% for AGIs below $25k, 1.2% for AGIs $25k-50k)
Percentage of individuals using paid preparers for their 2012 taxes: 67.9%
Here:
68%
State:
53%
(% for various income ranges: 66.7% for AGIs below $25k, 65.2% for AGIs $25k-50k, 68.0% for AGIs $50k-75k, 78.6% for AGIs $75k-100k, 77.8% for AGIs $100k-200k, 100.0% for AGIs over 200k)
Averages for the 2004 tax year for zip code 28366, filed in 2005:
Average Adjusted Gross Income (AGI) in 2004: $35,203 (Individual Income Tax Returns)
Here:
$35,203
State:
$45,376
Salary/wage: $31,075 (reported on 87.9% of returns)
Here:
$31,075
State:
$39,442
(% of AGI for various income ranges: 84.7% for AGIs below $10k, 87.2% for AGIs $10k-25k, 87.7% for AGIs $25k-50k, 80.5% for AGIs $50k-75k, 79.4% for AGIs $75k-100k, 54.0% for AGIs over 100k)
Taxable interest for individuals: $1,374 (reported on 29.2% of returns)
This zip code:
$1,374
North Carolina:
$1,515
(% of AGI for various income ranges: 2.9% for AGIs below $10k, 0.7% for AGIs $10k-25k, 0.9% for AGIs $25k-50k, 1.2% for AGIs $50k-75k, 0.5% for AGIs $75k-100k, 1.9% for AGIs over 100k)
Taxable dividends: $1,742 (reported on 9.7% of returns)
Here:
$1,742
State:
$4,016
(% of AGI for various income ranges: 0.6% for AGIs below $10k, 0.3% for AGIs $10k-25k, 0.3% for AGIs $25k-50k, 0.3% for AGIs $50k-75k, 0.7% for AGIs $75k-100k, 0.8% for AGIs over 100k)
Net capital gain/loss: +$1,415 (reported on 8.3% of returns)
Here:
+$1,415
State:
+$11,152
(% of AGI for various income ranges: -1.4% for AGIs below $10k, 0.2% for AGIs $10k-25k, 0.2% for AGIs $25k-50k, 0.2% for AGIs $50k-75k, -0.2% for AGIs $75k-100k, 1.2% for AGIs over 100k)
Profit/loss from business: +$7,873 (reported on 14.8% of returns)
Here:
+$7,873
State:
+$9,490
(% of AGI for various income ranges: 18.2% for AGIs below $10k, 4.7% for AGIs $10k-25k, 2.7% for AGIs $25k-50k, 5.3% for AGIs $50k-75k, 1.3% for AGIs $75k-100k, 0.6% for AGIs over 100k)
Profit/loss from farming: +$1,638 (reported on 5.3% of returns)
Here:
+$1,638
State:
-$3,231
(% of AGI for various income ranges: 5.9% for AGIs below $10k, 0.4% for AGIs $10k-25k, -0.1% for AGIs $25k-50k, 0.2% for AGIs $50k-75k, 0.0% for AGIs over 100k)
IRA payment deduction: $2,793 (reported on 1.5% of returns)
28366:
$2,793
North Carolina:
$2,967
Total itemized deductions: $15,916 (21% of AGI, reported on 21.7% of returns)
Here:
$15,916
State:
$19,464
Here:
21.5% of AGI
State:
22.7% of AGI
(% of AGI for various income ranges: 5.4% for AGIs $10k-25k, 10.1% for AGIs $25k-50k, 11.4% for AGIs $50k-75k, 12.5% for AGIs $75k-100k, 11.1% for AGIs over 100k)
Charity contributions deductions: $3,103 (4% of AGI, reported on 19.2% of returns)
Here:
$3,103
State:
$4,035
Here:
4.0% of AGI
State:
4.5% of AGI
(% of AGI for various income ranges: 0.8% for AGIs $10k-25k, 1.7% for AGIs $25k-50k, 1.8% for AGIs $50k-75k, 2.6% for AGIs $75k-100k, 1.9% for AGIs over 100k)
Total tax: $5,583 (reported on 62.1% of returns)
28366:
$5,583
State:
$7,257
(% of AGI for various income ranges: 5.7% for AGIs below $10k, 2.7% for AGIs $10k-25k, 5.7% for AGIs $25k-50k, 8.6% for AGIs $50k-75k, 10.9% for AGIs $75k-100k, 21.1% for AGIs over 100k)
Earned income credit: $2,000 (reported on 28.0% of returns)
Here:
$2,000
State:
$1,851
Percentage of individuals using paid preparers for their 2004 taxes: 72.8%
Here:
73%
State:
62%
(% for various income ranges: 67.1% for AGIs below $10k, 73.5% for AGIs $10k-25k, 71.5% for AGIs $25k-50k, 76.9% for AGIs $50k-75k, 81.2% for AGIs $75k-100k, 82.4% for AGIs over 100k)
Household received Food Stamps/SNAP in the past 12 months: 485 Household did not receive Food Stamps/SNAP in the past 12 months: 1,567
Women who had a birth in the past 12 months: 40 (41 now married, 0 unmarried) Women who did not have a birth in the past 12 months: 990 (441 now married, 549 unmarried)
Housing units in zip code 28366 with a mortgage: 521 (7 second mortgage, 7 both second mortgage and home equity loan) Houses without a mortgage: 3
Median monthly owner costs for units with a mortgage: $1,194 Median monthly owner costs for units without a mortgage: $426
Residents with income below the poverty level in 2022:
This zip code:
12.8%
Whole state:
12.8%
Residents with income below 50% of the poverty level in 2022:
This zip code:
5.1%
Whole state:
6.8%
Median number of rooms in houses and condos:
Here:
6.4
State:
6.4
Median number of rooms in apartments:
Here:
5.3
State:
4.4
Notable locations in this zip code not listed on our city pages
Churches in zip code 28366 include: White Oak Church (A), Beaverdam Church (B), Goshen Church (C), Darden Church (D), Saint Paul Church (E), Cedar Point Church (F), Oak Grove Church (G), Newton Grove Church (H), Pleasant Union Church (I). Display/hide their locations on the map
Streams, rivers, and creeks: Beaverdam Swamp (A), John K Swamp (B), Craddock Swamp (C), Kill Swamp (D), Sevenmile Swamp (E), Stone Creek (F), Long Branch (G). Display/hide their locations on the map
In group quarters: 19 (-1 institutionalized population)
Size of family households: 774 2-persons, 372 3-persons, 142 4-persons, 133 5-persons, 17 6-persons
Size of nonfamily households: 535 1-person, 25 2-persons, 30 4-persons
1,073 married couples with children.
209 single-parent households (209 women).
86.6% of residents of 28366 zip code speak English at home.
13.0% of residents speak Spanish at home (53% very well, 13% well, 33% not well).
0.1% of residents speak Asian or Pacific Island language at home (100% very well).
Foreign born population: 258 (5.1%) (11.5% of them are naturalized citizens)
This zip code:
5.1%
Whole state:
8.6%
37%El Salvador
34%Honduras
21%Guatemala
8%St. Vincent and the Grenadines
3%Malaysia
15%American
5%English
1%Trinidadian and Tobagonian
1%Italian
1%Scotch-Irish
1%Irish
0%European
Year of entry for the foreign-born population
652010 or later
822000 to 2009
311990 to 1999
86Before 1990
Facilities with environmental interests located in this zip code:
3D FARM TDM #16 (1122 ROANOKE RD in NEWTON GROVE, NC)
National Pollutant Discharge Elimination System NON-MAJOR (Tracking pollutant discharge elimination systems) - permit
BILLY RAY DAUGHTRY (4105 WRYE BRANCH RD in NEWTON GROVE, NC)
National Pollutant Discharge Elimination System NON-MAJOR (Tracking pollutant discharge elimination systems) - permit
DICKERSON CAROLINA (HIGHWAY 701 in NEWTON GROVE, NC)
AIR MAJOR (AIRS/AFS) Business SIC classification: ASPHALT PAVING MIXTURES AND BLOCKS
Housing units lacking complete plumbing facilities: 6.8% Housing units lacking complete kitchen facilities: 6.1%
72.4%Electricity
18.0%Bottled, tank, or LP gas
7.7%Utility gas
1.5%Wood
Population in 1990: 6,775.
Place of birth for U.S.-born residents:
This state: 4,262
Northeast: 73
Midwest: 70
South: 334
West: 19
63% of the 28366 zip code residents lived in the same house 5 years ago. Out of people who lived in different houses, 56% lived in this county. Out of people who lived in different counties, 50% lived in North Carolina.
99% of the 28366 zip code residents lived in the same house 1 year ago. Out of people who lived in different houses, 86% moved from this county. Out of people who lived in different houses, 67% moved from different county within same state. Out of people who lived in different houses, 19% moved from abroad.
Private vs. public school enrollment:
Students in private schools in grades 1 to 8 (elementary and middle school): 4
Here:
0.9%
North Carolina:
13.8%
Students in private schools in grades 9 to 12 (high school): 6
Here:
1.4%
North Carolina:
11.9%
Students in private undergraduate colleges: 2
Here:
4.5%
North Carolina:
19.3%
Occupation by median earnings in the past 12 months ($)
117,736Management occupations
76,385Business and financial operations occupations
62,140Health diagnosing and treating practitioners and other technical occupations
50,328Farming, fishing, and forestry occupations
49,213Fire fighting and prevention, and other protective service workers including supervisors
48,882Office and administrative support occupations
Companies with federal contracts located in this zip code:
PARKER, JAMES (1580 BAREFOOT RD in NEWTON GROVE, NC; small business) : $435,054 in 7 contractsfrom 2002 to 2003
Contracts for Landscaping/Groundskeeping Services by Air Force Signed by year:2000: $0; 2001: $0; 2002: $223,072; 2003: $211,982; 2004: $0; 2005: $0; 2006: $0.
Biggest contracts:
$95,035 with Air Force for Landscaping/Groundskeeping Services. Signed on 2003-05-01. Completion date: 2003-05-31.
$90,880, same as above.Signed on 2002-10-01. Completion date: 2002-10-31.
$79,892, same as above.Signed on 2002-11-01. Completion date: 2002-11-30.
$64,647, same as above.Signed on 2003-02-28. Completion date: 2003-03-31.
DAUGHTRY FARM SUPPLY INC (3260 MCLAMB RD in NEWTON GROVE, NC; small business)
$7,310 with Navy for Seeds and Nursery Stock. Signed on 2005-08-12. Completion date: 2005-08-22.
Top industries in this zip code by the number of employees in 2005:
Construction: Poured Concrete Foundation and Structure Contractors (50-99: 1)
Other Services (except Public Administration): Commercial and Industrial Machinery and Equipment (except Automotive and Electronic) Repair and Maintenance (20-49: 1, 1-4: 1)
Health Care and Social Assistance: Homes for the Elderly (20-49: 1)
Other Services (except Public Administration): Religious Organizations (10-19: 1, 1-4: 1)
Health Care and Social Assistance: Offices of Optometrists (10-19: 1)
People in group quarters in 2010:
38 people in nursing facilities/skilled-nursing facilities
People in group quarters in 2000:
37 people in other noninstitutional group quarters
25 people in other group homes
2 people in homes for the mentally ill
Fatal accident statistics in 2014:
Fatal accident count: 1
Vehicles involved in fatal accidents: 2
Fatal accidents caused by drunken drivers: 0
Fatalities: 1
Persons involved in fatal accidents: 4
Pedestrians involved in fatal accidents: 0
Fatal accident statistics in 2012:
Fatal accident count: 1
Vehicles involved in fatal accidents: 2
Fatal accidents caused by drunken drivers: 0
Fatalities: 1
Persons involved in fatal accidents: 2
Pedestrians involved in fatal accidents: 0
Home Mortgage Disclosure Act Aggregated Statistics For Year 2009 (Based on 2 partial tracts)
A) FHA, FSA/RHS & VA Home Purchase Loans
B) Conventional Home Purchase Loans
C) Refinancings
D) Home Improvement Loans
F) Non-occupant Loans on < 5 Family Dwellings (A B C & D)
G) Loans On Manufactured Home Dwelling (A B C & D)
Number
Average Value
Number
Average Value
Number
Average Value
Number
Average Value
Number
Average Value
Number
Average Value
LOANS ORIGINATED
4
$114,735
3
$72,073
17
$167,094
2
$24,565
2
$132,675
3
$71,320
APPLICATIONS APPROVED, NOT ACCEPTED
0
$0
1
$41,370
2
$138,655
0
$0
0
$0
1
$38,460
APPLICATIONS DENIED
0
$0
2
$37,655
8
$123,866
2
$36,360
1
$14,220
2
$69,490
APPLICATIONS WITHDRAWN
0
$0
0
$0
6
$125,993
0
$0
0
$0
1
$73,370
FILES CLOSED FOR INCOMPLETENESS
0
$0
0
$0
1
$210,730
0
$0
0
$0
0
$0
Aggregated Statistics For Year 2008 (Based on 2 partial tracts)
A) FHA, FSA/RHS & VA Home Purchase Loans
B) Conventional Home Purchase Loans
C) Refinancings
D) Home Improvement Loans
F) Non-occupant Loans on < 5 Family Dwellings (A B C & D)
G) Loans On Manufactured Home Dwelling (A B C & D)
Number
Average Value
Number
Average Value
Number
Average Value
Number
Average Value
Number
Average Value
Number
Average Value
LOANS ORIGINATED
3
$115,597
9
$111,432
13
$108,868
4
$47,752
3
$85,217
6
$70,297
APPLICATIONS APPROVED, NOT ACCEPTED
0
$0
0
$0
1
$88,560
1
$6,140
0
$0
0
$0
APPLICATIONS DENIED
1
$102,780
3
$50,097
11
$125,695
4
$18,342
2
$35,390
3
$30,597
APPLICATIONS WITHDRAWN
1
$185,520
2
$116,675
5
$164,120
1
$32,320
1
$84,680
2
$55,265
FILES CLOSED FOR INCOMPLETENESS
0
$0
0
$0
1
$162,890
0
$0
0
$0
1
$86,940
Aggregated Statistics For Year 2007 (Based on 2 partial tracts)
A) FHA, FSA/RHS & VA Home Purchase Loans
B) Conventional Home Purchase Loans
C) Refinancings
D) Home Improvement Loans
F) Non-occupant Loans on < 5 Family Dwellings (A B C & D)
G) Loans On Manufactured Home Dwelling (A B C & D)
Number
Average Value
Number
Average Value
Number
Average Value
Number
Average Value
Number
Average Value
Number
Average Value
LOANS ORIGINATED
4
$119,745
12
$116,541
17
$97,872
4
$30,380
2
$33,615
13
$71,228
APPLICATIONS APPROVED, NOT ACCEPTED
0
$0
0
$0
3
$73,367
1
$73,370
0
$0
0
$0
APPLICATIONS DENIED
0
$0
6
$70,297
15
$90,237
5
$48,610
1
$53,000
9
$59,756
APPLICATIONS WITHDRAWN
0
$0
1
$117,970
9
$100,516
1
$21,980
0
$0
1
$100,520
FILES CLOSED FOR INCOMPLETENESS
0
$0
0
$0
0
$0
0
$0
0
$0
0
$0
Aggregated Statistics For Year 2006 (Based on 2 partial tracts)
A) FHA, FSA/RHS & VA Home Purchase Loans
B) Conventional Home Purchase Loans
C) Refinancings
D) Home Improvement Loans
F) Non-occupant Loans on < 5 Family Dwellings (A B C & D)
G) Loans On Manufactured Home Dwelling (A B C & D)
Number
Average Value
Number
Average Value
Number
Average Value
Number
Average Value
Number
Average Value
Number
Average Value
LOANS ORIGINATED
4
$110,452
15
$91,143
17
$94,545
5
$69,424
3
$57,960
11
$70,193
APPLICATIONS APPROVED, NOT ACCEPTED
1
$130,900
3
$52,680
3
$112,257
1
$22,950
0
$0
4
$44,440
APPLICATIONS DENIED
0
$0
9
$73,653
17
$88,234
6
$47,348
2
$71,425
13
$65,659
APPLICATIONS WITHDRAWN
0
$0
1
$154,170
5
$88,750
1
$68,520
0
$0
3
$76,490
FILES CLOSED FOR INCOMPLETENESS
0
$0
0
$0
1
$198,440
0
$0
0
$0
0
$0
Aggregated Statistics For Year 2005 (Based on 2 partial tracts)
A) FHA, FSA/RHS & VA Home Purchase Loans
B) Conventional Home Purchase Loans
C) Refinancings
D) Home Improvement Loans
F) Non-occupant Loans on < 5 Family Dwellings (A B C & D)
G) Loans On Manufactured Home Dwelling (A B C & D)
Number
Average Value
Number
Average Value
Number
Average Value
Number
Average Value
Number
Average Value
Number
Average Value
LOANS ORIGINATED
1
$112,150
10
$77,439
22
$94,110
4
$87,750
4
$91,548
7
$56,421
APPLICATIONS APPROVED, NOT ACCEPTED
0
$0
4
$74,740
7
$86,803
1
$19,720
0
$0
4
$40,642
APPLICATIONS DENIED
1
$29,090
9
$60,761
17
$103,215
5
$43,568
1
$66,260
13
$60,911
APPLICATIONS WITHDRAWN
0
$0
1
$94,050
7
$88,003
1
$91,790
1
$63,020
0
$0
FILES CLOSED FOR INCOMPLETENESS
0
$0
0
$0
3
$107,517
1
$32,000
0
$0
1
$43,630
Aggregated Statistics For Year 2004 (Based on 2 partial tracts)
A) FHA, FSA/RHS & VA Home Purchase Loans
B) Conventional Home Purchase Loans
C) Refinancings
D) Home Improvement Loans
F) Non-occupant Loans on < 5 Family Dwellings (A B C & D)
G) Loans On Manufactured Home Dwelling (A B C & D)
Number
Average Value
Number
Average Value
Number
Average Value
Number
Average Value
Number
Average Value
Number
Average Value
LOANS ORIGINATED
4
$108,432
13
$77,245
31
$99,431
2
$30,380
3
$127,880
12
$57,072
APPLICATIONS APPROVED, NOT ACCEPTED
0
$0
2
$86,135
5
$81,770
1
$49,450
0
$0
3
$57,960
APPLICATIONS DENIED
0
$0
6
$98,092
20
$80,881
2
$41,695
2
$135,420
12
$51,685
APPLICATIONS WITHDRAWN
1
$71,750
1
$88,560
12
$95,425
1
$76,280
1
$40,400
3
$62,810
FILES CLOSED FOR INCOMPLETENESS
0
$0
0
$0
3
$98,467
0
$0
0
$0
0
$0
Aggregated Statistics For Year 2003 (Based on 2 partial tracts)
A) FHA, FSA/RHS & VA Home Purchase Loans
B) Conventional Home Purchase Loans
C) Refinancings
D) Home Improvement Loans
F) Non-occupant Loans on < 5 Family Dwellings (A B C & D)
Number
Average Value
Number
Average Value
Number
Average Value
Number
Average Value
Number
Average Value
LOANS ORIGINATED
2
$117,645
16
$83,769
38
$102,522
2
$7,595
4
$65,610
APPLICATIONS APPROVED, NOT ACCEPTED
0
$0
4
$55,670
7
$95,667
0
$0
0
$0
APPLICATIONS DENIED
1
$108,920
12
$50,554
21
$81,816
2
$42,825
0
$0
APPLICATIONS WITHDRAWN
0
$0
2
$103,585
10
$94,956
1
$31,030
0
$0
FILES CLOSED FOR INCOMPLETENESS
0
$0
0
$0
1
$153,200
0
$0
0
$0
Aggregated Statistics For Year 2002 (Based on 2 partial tracts)
A) FHA, FSA/RHS & VA Home Purchase Loans
B) Conventional Home Purchase Loans
C) Refinancings
D) Home Improvement Loans
F) Non-occupant Loans on < 5 Family Dwellings (A B C & D)
Number
Average Value
Number
Average Value
Number
Average Value
Number
Average Value
Number
Average Value
LOANS ORIGINATED
2
$77,085
14
$60,161
28
$108,561
2
$19,715
3
$113,337
APPLICATIONS APPROVED, NOT ACCEPTED
0
$0
7
$50,881
7
$80,616
0
$0
0
$0
APPLICATIONS DENIED
0
$0
14
$47,187
17
$74,469
4
$23,675
1
$94,370
APPLICATIONS WITHDRAWN
0
$0
1
$101,810
10
$89,009
0
$0
0
$0
FILES CLOSED FOR INCOMPLETENESS
0
$0
0
$0
2
$56,400
0
$0
0
$0
Aggregated Statistics For Year 2001 (Based on 2 partial tracts)
A) FHA, FSA/RHS & VA Home Purchase Loans
B) Conventional Home Purchase Loans
C) Refinancings
D) Home Improvement Loans
F) Non-occupant Loans on < 5 Family Dwellings (A B C & D)
Number
Average Value
Number
Average Value
Number
Average Value
Number
Average Value
Number
Average Value
LOANS ORIGINATED
1
$93,400
13
$61,632
34
$91,599
4
$13,332
5
$77,762
APPLICATIONS APPROVED, NOT ACCEPTED
0
$0
5
$62,506
4
$76,840
1
$40,400
0
$0
APPLICATIONS DENIED
0
$0
14
$53,351
11
$73,807
2
$20,845
0
$0
APPLICATIONS WITHDRAWN
0
$0
1
$72,400
7
$71,889
1
$6,460
1
$43,630
FILES CLOSED FOR INCOMPLETENESS
0
$0
0
$0
2
$106,170
0
$0
0
$0
Aggregated Statistics For Year 2000 (Based on 2 partial tracts)
A) FHA, FSA/RHS & VA Home Purchase Loans
B) Conventional Home Purchase Loans
C) Refinancings
D) Home Improvement Loans
F) Non-occupant Loans on < 5 Family Dwellings (A B C & D)
Number
Average Value
Number
Average Value
Number
Average Value
Number
Average Value
Number
Average Value
LOANS ORIGINATED
3
$89,420
16
$66,216
10
$66,094
4
$11,070
1
$127,990
APPLICATIONS APPROVED, NOT ACCEPTED
0
$0
5
$48,092
4
$58,985
1
$2,910
0
$0
APPLICATIONS DENIED
1
$13,570
16
$46,601
9
$78,681
2
$16,320
1
$34,910
APPLICATIONS WITHDRAWN
0
$0
1
$49,770
8
$81,608
0
$0
0
$0
FILES CLOSED FOR INCOMPLETENESS
0
$0
0
$0
1
$63,350
0
$0
0
$0
Aggregated Statistics For Year 1999 (Based on 1 partial tract)
B) Conventional Home Purchase Loans
C) Refinancings
D) Home Improvement Loans
F) Non-occupant Loans on < 5 Family Dwellings (A B C & D)
Detailed PMIC statistics for the following Tracts:0413.00
2002 - 2018 National Fire Incident Reporting System (NFIRS) incidents
According to the data from the years 2002 - 2018 the average number of fire incidents per year is 53. The highest number of reported fire incidents - 133 took place in 2007, and the least - 28 in 2004. The data has a decreasing trend.
When looking into fire subcategories, the most reports belonged to: Outside Fires (43.1%), and Structure Fires (39.0%).
Fire incident types reported to NFIRS in Zip Code 28366


+$1,638
-$3,231
(% of AGI for various income ranges: 5.9% for AGIs below $10k, 0.4% for AGIs $10k-25k, -0.1% for AGIs $25k-50k, 0.2% for AGIs $50k-75k, 0.0% for AGIs over 100k) Nearest zip codes: 27524, 28334, 28385, 28341, 28328, 27504.


 According to the data from the years 2002 - 2018 the average number of fire incidents per year is 53. The highest number of reported fire incidents - 133 took place in 2007, and the least - 28 in 2004. The data has a decreasing trend.
 When looking into fire subcategories, the most reports belonged to: Outside Fires (43.1%), and Structure Fires (39.0%).