Estimated zip code population in 2022: 6,640 Zip code population in 2010: 8,080 Zip code population in 2000: 7,498
Houses and condos: 3,102 Renter-occupied apartments: 593
% of renters here:
21%
State:
33%
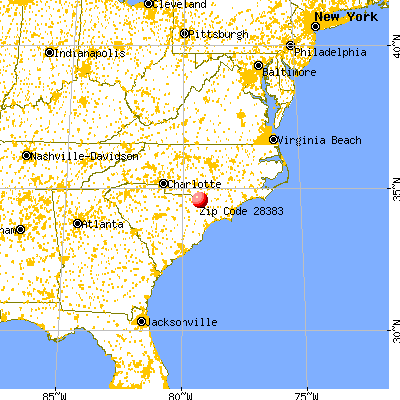
March 2022 cost of living index in zip code 28383: 79.0 (low, U.S. average is 100)
Land area: 104.4 sq. mi. Water area: 0.0 sq. mi.
Population density: 64 people per square mile
(very low).
OSM Map
General Map
Google Map
MSN Map
OSM Map
General Map
Google Map
MSN Map
OSM Map
General Map
Google Map
MSN Map
OSM Map
General Map
Google Map
MSN Map
Please wait while loading the map...
Real estate property taxes paid for housing units in 2022:
This zip code:
0.9% ($827)
North Carolina:
0.6% ($1,769)
Median real estate property taxes paid for housing units with mortgages in 2022: $1,176 (0.8%) Median real estate property taxes paid for housing units with no mortgage in 2022: $689 (0.9%)
Estimated median house/condo value in 2022: $88,516
28383:
$88,516
North Carolina:
$280,600
According to our research of North Carolina and other state lists, there were 15 registered sex offenders living in 28383 zip code as of May 28, 2024. The ratio of all residents to sex offenders in zip code 28383 is 600 to 1. The ratio of registered sex offenders to all residents in this zip code is near the state average.
Median resident age:
This zip code:
39.6 years
North Carolina median age:
39.2 years
Average household size:
This zip code:
2.4 people
North Carolina:
2.4 people
Averages for the 2020 tax year for zip code 28383, filed in 2021:
Average Adjusted Gross Income (AGI) in 2020: $36,796 (Individual Income Tax Returns)
Here:
$36,796
State:
$70,020
Salary/wage: $32,459 (reported on 84.9% of returns)
Here:
$32,459
State:
$58,387
(% of AGI for various income ranges: 1258.7% for AGIs below $25k, 3940.5% for AGIs $25k-50k, 7523.8% for AGIs $50k-75k, 9430.0% for AGIs $75k-100k, 21000.0% for AGIs $100k-200k)
Taxable interest for individuals: $613 (reported on 14.8% of returns)
This zip code:
$613
North Carolina:
$1,479
(% of AGI for various income ranges: 4.0% for AGIs below $25k, 2.6% for AGIs $25k-50k, 17.6% for AGIs $50k-75k, 5.0% for AGIs $75k-100k, 238.6% for AGIs $100k-200k)
Ordinary dividends: $4,560 (reported on 4.9% of returns)
Here:
$4,560
State:
$7,888
(% of AGI for various income ranges: 5.2% for AGIs below $25k, 6.2% for AGIs $25k-50k, 34.3% for AGIs $50k-75k, 720.0% for AGIs $100k-200k)
Net capital gain/loss in AGI: +$6,727 (reported on 3.6% of returns)
Here:
+$6,727
State:
+$23,652
(% of AGI for various income ranges: 1.6% for AGIs below $25k, 4.2% for AGIs $25k-50k, 10.5% for AGIs $50k-75k, 954.3% for AGIs $100k-200k)
Profit/loss from business: +$5,111 (reported on 15.4% of returns)
Here:
+$5,111
State:
+$11,710
(% of AGI for various income ranges: 104.8% for AGIs below $25k, 25.8% for AGIs $25k-50k, 118.0% for AGIs $75k-100k, 1288.6% for AGIs $100k-200k)
Taxable individual retirement arrangement distribution: $10,231 (reported on 4.3% of returns)
28383:
$10,231
North Carolina:
$20,247
(% of AGI for various income ranges: 15.4% for AGIs below $25k, 31.5% for AGIs $25k-50k, 159.5% for AGIs $50k-75k, 827.1% for AGIs $100k-200k)
Total itemized deductions: $27,692 (reported on 3.9% of returns)
Here:
$27,692
State:
$34,549
(% of AGI for various income ranges: 176.4% for AGIs $25k-50k, 609.0% for AGIs $50k-75k, 1055.7% for AGIs $100k-200k)
Charity contributions: $8,755 (reported on 3.6% of returns)
Here:
$8,755
State:
$13,360
(% of AGI for various income ranges: 33.2% for AGIs $25k-50k, 169.0% for AGIs $50k-75k, 517.1% for AGIs $100k-200k)
Taxes paid: $4,392 (reported on 3.9% of returns)
28383:
$4,392
State:
$7,586
(% of AGI for various income ranges: 21.6% for AGIs $25k-50k, 92.4% for AGIs $50k-75k, 247.1% for AGIs $100k-200k)
Earned income credit: $2,883 (reported on 36.1% of returns)
Here:
$2,883
State:
$2,337
(% of AGI for various income ranges: 196.5% for AGIs below $25k, 112.6% for AGIs $25k-50k)
Percentage of individuals using paid preparers for their 2020 taxes: 92.1%
Here:
92%
State:
93%
(% for various income ranges: 91.3% for AGIs below $25k, 92.6% for AGIs $25k-50k, 93.5% for AGIs $50k-75k, 92.9% for AGIs $75k-100k, 92.9% for AGIs $100k-200k, 100.0% for AGIs over 200k)
Averages for the 2012 tax year for zip code 28383, filed in 2013:
Average Adjusted Gross Income (AGI) in 2012: $29,204 (Individual Income Tax Returns)
Here:
$29,204
State:
$54,937
Salary/wage: $25,564 (reported on 86.1% of returns)
Here:
$25,564
State:
$46,336
(% of AGI for various income ranges: 80.7% for AGIs below $25k, 84.5% for AGIs $25k-50k, 78.1% for AGIs $50k-75k, 71.2% for AGIs $75k-100k, 88.8% for AGIs $100k-200k)
Taxable interest for individuals: $760 (reported on 15.3% of returns)
This zip code:
$760
North Carolina:
$1,298
(% of AGI for various income ranges: 0.3% for AGIs below $25k, 0.3% for AGIs $25k-50k, 0.3% for AGIs $50k-75k, 0.8% for AGIs $75k-100k, 1.0% for AGIs $100k-200k)
Ordinary dividends: $7,159 (reported on 6.0% of returns)
Here:
$7,159
State:
$6,213
(% of AGI for various income ranges: 0.2% for AGIs below $25k, 0.4% for AGIs $25k-50k, 1.0% for AGIs $50k-75k, 11.4% for AGIs $100k-200k)
Net capital gain/loss in AGI: +$1,683 (reported on 4.3% of returns)
Here:
+$1,683
State:
+$12,740
(% of AGI for various income ranges: 0.4% for AGIs $25k-50k, 0.1% for AGIs $50k-75k, 1.1% for AGIs $100k-200k)
Profit/loss from business: +$6,022 (reported on 16.0% of returns)
Here:
+$6,022
State:
+$10,311
(% of AGI for various income ranges: 9.3% for AGIs below $25k, 0.5% for AGIs $25k-50k, 0.5% for AGIs $50k-75k, 5.2% for AGIs $75k-100k)
Taxable individual retirement arrangement distribution: $11,867 (reported on 4.3% of returns)
28383:
$11,867
North Carolina:
$15,575
(% of AGI for various income ranges: 0.8% for AGIs below $25k, 2.1% for AGIs $25k-50k, 9.2% for AGIs $75k-100k)
Total itemized deductions: $18,490 (28% of AGI, reported on 17.4% of returns)
Here:
$18,490
State:
$23,438
Here:
28.3% of AGI
State:
21.5% of AGI
(% of AGI for various income ranges: 3.8% for AGIs below $25k, 11.7% for AGIs $25k-50k, 14.9% for AGIs $50k-75k, 15.0% for AGIs $75k-100k, 27.3% for AGIs $100k-200k)
Charity contributions: $4,990 (reported on 14.9% of returns)
Here:
$4,990
State:
$4,687
(% of AGI for various income ranges: 0.6% for AGIs below $25k, 2.4% for AGIs $25k-50k, 3.9% for AGIs $50k-75k, 3.6% for AGIs $75k-100k, 7.3% for AGIs $100k-200k)
Taxes paid: $4,931 (reported on 17.4% of returns)
28383:
$4,931
State:
$8,823
(% of AGI for various income ranges: 0.6% for AGIs below $25k, 2.2% for AGIs $25k-50k, 3.3% for AGIs $50k-75k, 4.9% for AGIs $75k-100k, 11.3% for AGIs $100k-200k)
Earned income credit: $2,774 (reported on 48.4% of returns)
Here:
$2,774
State:
$2,376
(% of AGI for various income ranges: 14.5% for AGIs below $25k, 2.0% for AGIs $25k-50k)
Percentage of individuals using paid preparers for their 2012 taxes: 60.1%
Here:
60%
State:
53%
(% for various income ranges: 59.6% for AGIs below $25k, 58.6% for AGIs $25k-50k, 66.7% for AGIs $50k-75k, 60.0% for AGIs $75k-100k, 85.7% for AGIs $100k-200k)
Averages for the 2004 tax year for zip code 28383, filed in 2005:
Average Adjusted Gross Income (AGI) in 2004: $24,248 (Individual Income Tax Returns)
Here:
$24,248
State:
$45,376
Salary/wage: $23,025 (reported on 87.5% of returns)
Here:
$23,025
State:
$39,442
(% of AGI for various income ranges: 103.0% for AGIs below $10k, 88.3% for AGIs $10k-25k, 89.1% for AGIs $25k-50k, 80.6% for AGIs $50k-75k, 77.5% for AGIs $75k-100k, 52.4% for AGIs over 100k)
Taxable interest for individuals: $932 (reported on 18.1% of returns)
This zip code:
$932
North Carolina:
$1,515
(% of AGI for various income ranges: 0.9% for AGIs below $10k, 0.3% for AGIs $10k-25k, 0.4% for AGIs $25k-50k, 1.1% for AGIs $50k-75k, 1.1% for AGIs $75k-100k, 1.4% for AGIs over 100k)
Taxable dividends: $3,943 (reported on 8.2% of returns)
Here:
$3,943
State:
$4,016
(% of AGI for various income ranges: 0.8% for AGIs below $10k, 0.6% for AGIs $10k-25k, 0.4% for AGIs $25k-50k, 1.6% for AGIs $50k-75k, 0.6% for AGIs $75k-100k, 6.3% for AGIs over 100k)
Net capital gain/loss: +$3,118 (reported on 4.9% of returns)
Here:
+$3,118
State:
+$11,152
(% of AGI for various income ranges: -0.1% for AGIs below $10k, 0.0% for AGIs $10k-25k, -0.0% for AGIs $25k-50k, 1.5% for AGIs $50k-75k, 0.7% for AGIs $75k-100k, 3.1% for AGIs over 100k)
Profit/loss from business: +$4,972 (reported on 12.8% of returns)
Here:
+$4,972
State:
+$9,490
(% of AGI for various income ranges: 11.8% for AGIs below $10k, 4.9% for AGIs $10k-25k, 0.8% for AGIs $25k-50k, 2.4% for AGIs $50k-75k, 0.4% for AGIs $75k-100k)
Profit/loss from farming: +$642 (reported on 2.4% of returns)
Here:
+$642
State:
-$3,231
(% of AGI for various income ranges: -2.2% for AGIs below $10k, 0.6% for AGIs $10k-25k, -0.2% for AGIs $25k-50k, 0.1% for AGIs $50k-75k)
IRA payment deduction: $2,629 (reported on 1.3% of returns)
28383:
$2,629
North Carolina:
$2,967
Total itemized deductions: $15,778 (29% of AGI, reported on 16.3% of returns)
Here:
$15,778
State:
$19,464
Here:
29.2% of AGI
State:
22.7% of AGI
(% of AGI for various income ranges: 6.7% for AGIs below $10k, 5.0% for AGIs $10k-25k, 12.0% for AGIs $25k-50k, 12.9% for AGIs $50k-75k, 18.2% for AGIs $75k-100k, 14.2% for AGIs over 100k)
Charity contributions deductions: $4,115 (7% of AGI, reported on 14.5% of returns)
Here:
$4,115
State:
$4,035
Here:
7.4% of AGI
State:
4.5% of AGI
(% of AGI for various income ranges: 0.8% for AGIs below $10k, 1.0% for AGIs $10k-25k, 2.3% for AGIs $25k-50k, 3.4% for AGIs $50k-75k, 5.0% for AGIs $75k-100k, 4.1% for AGIs over 100k)
Total tax: $2,980 (reported on 52.1% of returns)
28383:
$2,980
State:
$7,257
(% of AGI for various income ranges: 3.3% for AGIs below $10k, 2.5% for AGIs $10k-25k, 5.0% for AGIs $25k-50k, 8.1% for AGIs $50k-75k, 10.5% for AGIs $75k-100k, 16.5% for AGIs over 100k)
Earned income credit: $2,196 (reported on 47.5% of returns)
Here:
$2,196
State:
$1,851
Percentage of individuals using paid preparers for their 2004 taxes: 66.9%
Here:
67%
State:
62%
(% for various income ranges: 58.2% for AGIs below $10k, 73.5% for AGIs $10k-25k, 64.3% for AGIs $25k-50k, 68.1% for AGIs $50k-75k, 63.6% for AGIs $75k-100k, 63.8% for AGIs over 100k)
Household received Food Stamps/SNAP in the past 12 months: 910 Household did not receive Food Stamps/SNAP in the past 12 months: 1,902
Women who had a birth in the past 12 months: 23 (0 now married, 22 unmarried) Women who did not have a birth in the past 12 months: 1,491 (513 now married, 974 unmarried)
Housing units in zip code 28383 with a mortgage: 737 (9 second mortgage, 10 both second mortgage and home equity loan) Houses without a mortgage: 8
Median monthly owner costs for units with a mortgage: $1,093 Median monthly owner costs for units without a mortgage: $378
Residents with income below the poverty level in 2022:
This zip code:
27.8%
Whole state:
12.8%
Residents with income below 50% of the poverty level in 2022:
This zip code:
10.1%
Whole state:
6.8%
Median number of rooms in houses and condos:
Here:
5.5
State:
6.4
Median number of rooms in apartments:
Here:
4.9
State:
4.4
Notable locations in this zip code not listed on our city pages
Churches in zip code 28383 include: Antioch Mission (A), Asbury Church (B), Ashpole Center Church (C), Ashpole Presbyterian Church (D), Back Swamp Church (E), Beauty Spot Church (F), Benson Church (G), Beulah Church (H), Mount Olive Church (I). Display/hide their locations on the map
Cemeteries: McCormick Cemetery (1), Pleasant Grove Cemetery (2), Rowland Cemetery (3), Ayres Cemetery (4), Stewart Cemetery (5). Display/hide their locations on the map
In group quarters: 24 (-1 institutionalized population)
Size of family households: 893 2-persons, 460 3-persons, 247 4-persons, 158 5-persons, 83 6-persons, 19 7-or-more-persons
Size of nonfamily households: 802 1-person, 98 2-persons
519 married couples with children.
727 single-parent households (130 men, 597 women).
98.7% of residents of 28383 zip code speak English at home.
0.1% of residents speak Spanish at home (100% not at all).
0.4% of residents speak Asian or Pacific Island language at home (100% very well).
0.2% of residents speak other language at home (100% very well).
Foreign born population: 64 (1.0%) (54.3% of them are naturalized citizens)
This zip code:
1.0%
Whole state:
8.6%
83%United Kingdom, excluding England and Scotland
80%Sweden
9%Bhutan
8%Indonesia
5%Honduras
7%American
1%English
0%European
0%Scottish
0%German
0%Scotch-Irish
0%African
Year of entry for the foreign-born population
522010 or later
02000 to 2009
01990 to 1999
32Before 1990
Housing units lacking complete plumbing facilities: 5.5% Housing units lacking complete kitchen facilities: 4.6%
82.2%Electricity
14.0%Bottled, tank, or LP gas
2.3%Utility gas
1.1%Wood
Population in 1990: 7,047. Population change in the 1990s: +451 (+6.4%).
Place of birth for U.S.-born residents:
This state: 5,409
Northeast: 42
Midwest: 45
South: 882
West: 81
75% of the 28383 zip code residents lived in the same house 5 years ago. Out of people who lived in different houses, 77% lived in this county. Out of people who lived in different counties, 50% lived in North Carolina.
98% of the 28383 zip code residents lived in the same house 1 year ago. Out of people who lived in different houses, 51% moved from this county. Out of people who lived in different houses, 52% moved from different county within same state. Out of people who lived in different houses, 32% moved from different state.
Private vs. public school enrollment:
Students in private schools in grades 1 to 8 (elementary and middle school): 13
Here:
1.7%
North Carolina:
13.8%
Students in private schools in grades 9 to 12 (high school): 9
Here:
2.2%
North Carolina:
11.9%
Students in private undergraduate colleges: 43
Here:
29.5%
North Carolina:
19.3%
Occupation by median earnings in the past 12 months ($)
64,664Community and social service occupations
57,386Installation, maintenance, and repair occupations
53,732Law enforcement workers including supervisors
51,103Health diagnosing and treating practitioners and other technical occupations
46,284Health technologists and technicians
46,119Management occupations
Top industries in this zip code by the number of employees in 2005:
Health Care and Social Assistance: Child Day Care Services (10-19: 1, 1-4: 1)
Administrative and Support and Waste Management and Remediation Services: Landscaping Services (10-19: 1, 1-4: 1)
People in group quarters in 2010:
19 people in workers' group living quarters and job corps centers
People in group quarters in 2000:
10 people in homes for the physically handicapped
Fatal accident statistics in 2013:
Fatal accident count: 2
Vehicles involved in fatal accidents: 3
Fatal accidents caused by drunken drivers: 1
Fatalities: 2
Persons involved in fatal accidents: 5
Pedestrians involved in fatal accidents: 0
Fatal accident statistics in 2012:
Fatal accident count: 2
Vehicles involved in fatal accidents: 4
Fatal accidents caused by drunken drivers: 0
Fatalities: 2
Persons involved in fatal accidents: 5
Pedestrians involved in fatal accidents: 0
2003 - 2018 National Fire Incident Reporting System (NFIRS) incidents
According to the data from the years 2003 - 2018 the average number of fires per year is 44. The highest number of fire incidents - 101 took place in 2017, and the least - 0 in 2004. The data has a rising trend.
When looking into fire subcategories, the most reports belonged to: Outside Fires (60.1%), and Structure Fires (29.7%).
Fire incident types reported to NFIRS in Zip Code 28383


+$642
-$3,231
(% of AGI for various income ranges: -2.2% for AGIs below $10k, 0.6% for AGIs $10k-25k, -0.2% for AGIs $25k-50k, 0.1% for AGIs $50k-75k)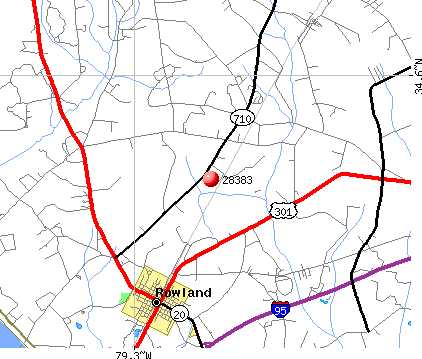 Nearest zip codes: 29547, 28364, 28372, 28340, 29567, 29536.


 According to the data from the years 2003 - 2018 the average number of fires per year is 44. The highest number of fire incidents - 101 took place in 2017, and the least - 0 in 2004. The data has a rising trend.
 When looking into fire subcategories, the most reports belonged to: Outside Fires (60.1%), and Structure Fires (29.7%).