Estimated zip code population in 2022: 8,283 Zip code population in 2010: 6,641 Zip code population in 2000: 4,637
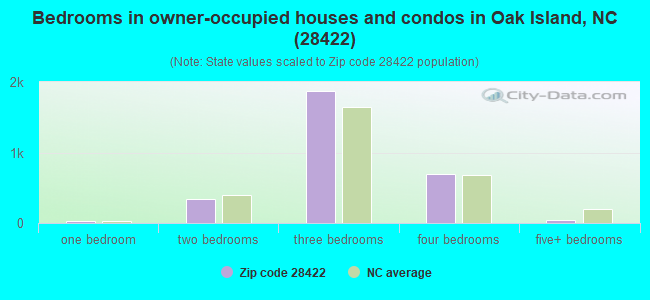
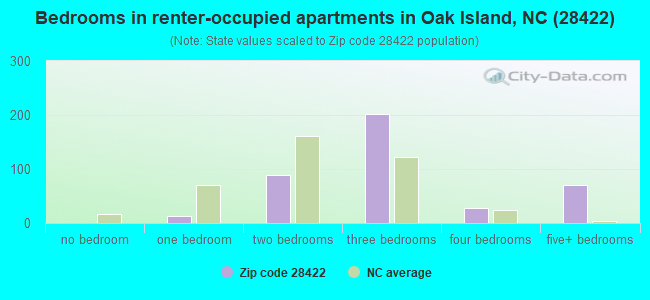
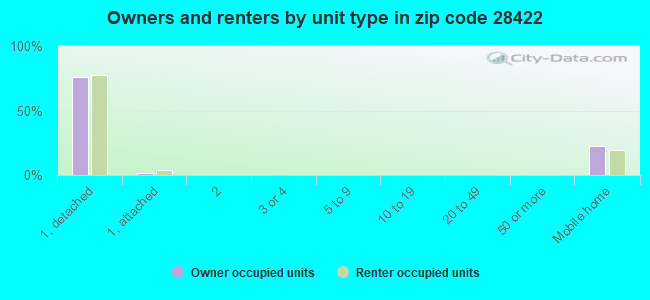
Houses and condos: 4,325 Renter-occupied apartments: 406
% of renters here:
12%
State:
33%
March 2022 cost of living index in zip code 28422: 84.1 (less than average, U.S. average is 100)
Land area: 91.8 sq. mi. Water area: 1.4 sq. mi.
Population density: 90 people per square mile
(very low).
OSM Map
General Map
Google Map
MSN Map
OSM Map
General Map
Google Map
MSN Map
OSM Map
General Map
Google Map
MSN Map
OSM Map
General Map
Google Map
MSN Map
Please wait while loading the map...
Real estate property taxes paid for housing units in 2022:
This zip code:
0.4% ($1,391)
North Carolina:
0.6% ($1,769)
Median real estate property taxes paid for housing units with mortgages in 2022: $1,340 (0.4%) Median real estate property taxes paid for housing units with no mortgage in 2022: $1,489 (0.4%)
Business Search- 14 Million verified businesses
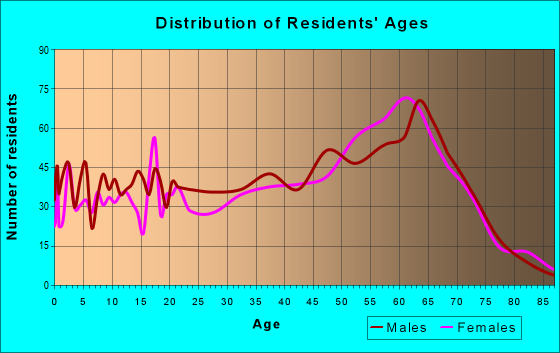
Males: 4,281
(51.7%)
Females: 4,000
(48.3%)
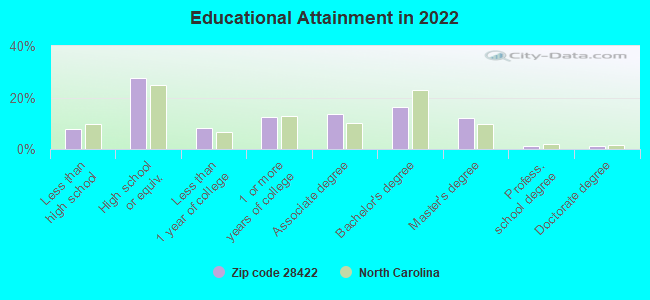
For population 25 years and over in 28422:
High school or higher: 92.0%
Bachelor's degree or higher: 30.5%
Graduate or professional degree: 14.3%
Unemployed: 3.8%
Mean travel time to work (commute): 26.9 minutes
For population 15 years and over in 28422:
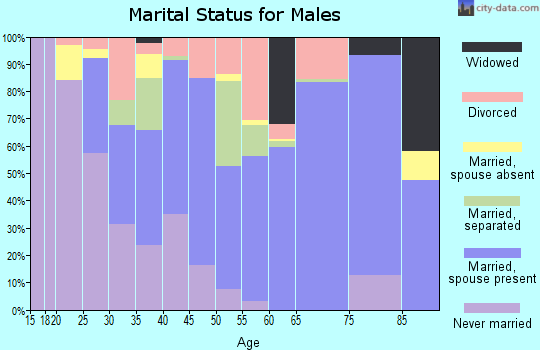
Never married: 18.0%
Now married: 66.2%
Separated: 1.9%
Widowed: 4.6%
Divorced: 9.4%
Zip code 28422 compared to state average:
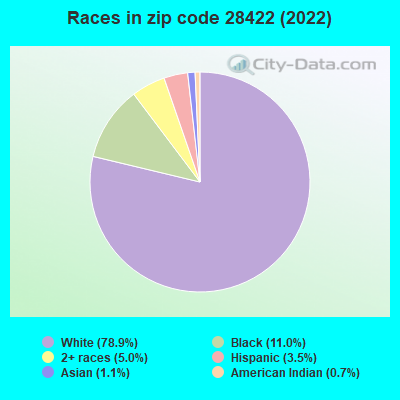
Black race population percentage below state average.
Hispanic race population percentage significantly below state average.
Median age significantly above state average.
Foreign-born population percentage significantly below state average.
Renting percentage significantly below state average.
Length of stay since moving in significantly below state average.
Averages for the 2020 tax year for zip code 28422, filed in 2021:
Average Adjusted Gross Income (AGI) in 2020: $65,668 (Individual Income Tax Returns)
Here:
$65,668
State:
$70,020
Salary/wage: $49,917 (reported on 69.3% of returns)
Here:
$49,917
State:
$58,387
(% of AGI for various income ranges: 1098.2% for AGIs below $25k, 3335.4% for AGIs $25k-50k, 5637.9% for AGIs $50k-75k, 7665.7% for AGIs $75k-100k, 13239.1% for AGIs $100k-200k, 62957.5% for AGIs over 200k)
Taxable interest for individuals: $1,117 (reported on 36.7% of returns)
This zip code:
$1,117
North Carolina:
$1,479
(% of AGI for various income ranges: 17.8% for AGIs below $25k, 22.9% for AGIs $25k-50k, 47.6% for AGIs $50k-75k, 79.6% for AGIs $75k-100k, 249.1% for AGIs $100k-200k, 410.0% for AGIs over 200k)
Ordinary dividends: $5,387 (reported on 22.6% of returns)
Here:
$5,387
State:
$7,888
(% of AGI for various income ranges: 28.5% for AGIs below $25k, 50.5% for AGIs $25k-50k, 121.1% for AGIs $50k-75k, 252.9% for AGIs $75k-100k, 694.9% for AGIs $100k-200k, 2590.0% for AGIs over 200k)
Net capital gain/loss in AGI: +$10,398 (reported on 21.7% of returns)
Here:
+$10,398
State:
+$23,652
(% of AGI for various income ranges: 4.0% for AGIs below $25k, 22.6% for AGIs $25k-50k, 132.6% for AGIs $50k-75k, 360.4% for AGIs $75k-100k, 1003.4% for AGIs $100k-200k, 11352.5% for AGIs over 200k)
Profit/loss from business: +$11,523 (reported on 16.9% of returns)
Here:
+$11,523
State:
+$11,710
(% of AGI for various income ranges: 198.0% for AGIs below $25k, 165.5% for AGIs $25k-50k, 281.1% for AGIs $50k-75k, 293.9% for AGIs $75k-100k, 413.1% for AGIs $100k-200k, 5037.5% for AGIs over 200k)
Taxable individual retirement arrangement distribution: $26,801 (reported on 17.8% of returns)
28422:
$26,801
North Carolina:
$20,247
(% of AGI for various income ranges: 84.1% for AGIs below $25k, 248.7% for AGIs $25k-50k, 639.2% for AGIs $50k-75k, 1027.9% for AGIs $75k-100k, 2688.6% for AGIs $100k-200k, 8162.5% for AGIs over 200k)
Total itemized deductions: $29,281 (reported on 8.3% of returns)
Here:
$29,281
State:
$34,549
(% of AGI for various income ranges: 64.4% for AGIs below $25k, 180.0% for AGIs $25k-50k, 390.0% for AGIs $50k-75k, 483.9% for AGIs $75k-100k, 1032.6% for AGIs $100k-200k, 5340.0% for AGIs over 200k)
Charity contributions: $7,686 (reported on 6.7% of returns)
Here:
$7,686
State:
$13,360
(% of AGI for various income ranges: 29.3% for AGIs $25k-50k, 50.5% for AGIs $50k-75k, 90.0% for AGIs $75k-100k, 208.0% for AGIs $100k-200k, 2085.0% for AGIs over 200k)
Taxes paid: $6,511 (reported on 8.1% of returns)
28422:
$6,511
State:
$7,586
(% of AGI for various income ranges: 7.1% for AGIs below $25k, 28.0% for AGIs $25k-50k, 52.9% for AGIs $50k-75k, 103.2% for AGIs $75k-100k, 276.6% for AGIs $100k-200k, 1357.5% for AGIs over 200k)
Earned income credit: $2,137 (reported on 15.5% of returns)
Here:
$2,137
State:
$2,337
(% of AGI for various income ranges: 96.2% for AGIs below $25k, 73.3% for AGIs $25k-50k)
Percentage of individuals using paid preparers for their 2020 taxes: 91.7%
Here:
92%
State:
93%
(% for various income ranges: 91.0% for AGIs below $25k, 91.2% for AGIs $25k-50k, 91.7% for AGIs $50k-75k, 91.7% for AGIs $75k-100k, 94.5% for AGIs $100k-200k, 87.5% for AGIs over 200k)
Averages for the 2012 tax year for zip code 28422, filed in 2013:
Average Adjusted Gross Income (AGI) in 2012: $51,144 (Individual Income Tax Returns)
Here:
$51,144
State:
$54,937
Salary/wage: $38,640 (reported on 75.9% of returns)
Here:
$38,640
State:
$46,336
(% of AGI for various income ranges: 69.2% for AGIs below $25k, 69.8% for AGIs $25k-50k, 63.0% for AGIs $50k-75k, 46.5% for AGIs $75k-100k, 47.5% for AGIs $100k-200k, 65.7% for AGIs over 200k)
Taxable interest for individuals: $1,123 (reported on 38.1% of returns)
This zip code:
$1,123
North Carolina:
$1,298
(% of AGI for various income ranges: 1.0% for AGIs below $25k, 0.7% for AGIs $25k-50k, 0.7% for AGIs $50k-75k, 0.9% for AGIs $75k-100k, 1.0% for AGIs $100k-200k, 0.4% for AGIs over 200k)
Ordinary dividends: $3,905 (reported on 22.0% of returns)
Here:
$3,905
State:
$6,213
(% of AGI for various income ranges: 1.8% for AGIs below $25k, 1.3% for AGIs $25k-50k, 1.2% for AGIs $50k-75k, 1.6% for AGIs $75k-100k, 2.1% for AGIs $100k-200k, 1.9% for AGIs over 200k)
Net capital gain/loss in AGI: +$2,924 (reported on 17.8% of returns)
Here:
+$2,924
State:
+$12,740
(% of AGI for various income ranges: 0.4% for AGIs $50k-75k, 0.1% for AGIs $75k-100k, 1.2% for AGIs $100k-200k, 6.5% for AGIs over 200k)
Profit/loss from business: +$5,994 (reported on 16.8% of returns)
Here:
+$5,994
State:
+$10,311
(% of AGI for various income ranges: 7.4% for AGIs below $25k, 1.4% for AGIs $25k-50k, 0.7% for AGIs $50k-75k, 1.1% for AGIs $75k-100k, 2.2% for AGIs $100k-200k)
Taxable individual retirement arrangement distribution: $20,476 (reported on 16.1% of returns)
28422:
$20,476
North Carolina:
$15,575
(% of AGI for various income ranges: 3.1% for AGIs below $25k, 5.4% for AGIs $25k-50k, 4.8% for AGIs $50k-75k, 8.6% for AGIs $75k-100k, 9.6% for AGIs $100k-200k)
Total itemized deductions: $21,324 (25% of AGI, reported on 37.1% of returns)
Here:
$21,324
State:
$23,438
Here:
25.2% of AGI
State:
21.5% of AGI
(% of AGI for various income ranges: 14.5% for AGIs below $25k, 15.0% for AGIs $25k-50k, 16.0% for AGIs $50k-75k, 16.6% for AGIs $75k-100k, 15.5% for AGIs $100k-200k, 14.1% for AGIs over 200k)
Charity contributions: $3,704 (reported on 32.9% of returns)
Here:
$3,704
State:
$4,687
(% of AGI for various income ranges: 1.3% for AGIs below $25k, 1.9% for AGIs $25k-50k, 2.9% for AGIs $50k-75k, 2.6% for AGIs $75k-100k, 2.3% for AGIs $100k-200k, 3.3% for AGIs over 200k)
Taxes paid: $6,535 (reported on 36.7% of returns)
28422:
$6,535
State:
$8,823
(% of AGI for various income ranges: 2.4% for AGIs below $25k, 2.7% for AGIs $25k-50k, 4.1% for AGIs $50k-75k, 5.0% for AGIs $75k-100k, 5.9% for AGIs $100k-200k, 7.1% for AGIs over 200k)
Earned income credit: $2,357 (reported on 21.0% of returns)
Here:
$2,357
State:
$2,376
(% of AGI for various income ranges: 8.0% for AGIs below $25k, 1.1% for AGIs $25k-50k)
Percentage of individuals using paid preparers for their 2012 taxes: 56.6%
Here:
57%
State:
53%
(% for various income ranges: 55.3% for AGIs below $25k, 53.7% for AGIs $25k-50k, 62.2% for AGIs $50k-75k, 59.3% for AGIs $75k-100k, 55.6% for AGIs $100k-200k, 80.0% for AGIs over 200k)
Averages for the 2004 tax year for zip code 28422, filed in 2005:
Average Adjusted Gross Income (AGI) in 2004: $37,890 (Individual Income Tax Returns)
Here:
$37,890
State:
$45,376
Salary/wage: $32,104 (reported on 81.9% of returns)
Here:
$32,104
State:
$39,442
(% of AGI for various income ranges: 103.3% for AGIs below $10k, 77.0% for AGIs $10k-25k, 77.3% for AGIs $25k-50k, 69.7% for AGIs $50k-75k, 69.5% for AGIs $75k-100k, 57.0% for AGIs over 100k)
Taxable interest for individuals: $1,234 (reported on 38.9% of returns)
This zip code:
$1,234
North Carolina:
$1,515
(% of AGI for various income ranges: 3.1% for AGIs below $10k, 1.4% for AGIs $10k-25k, 1.0% for AGIs $25k-50k, 1.1% for AGIs $50k-75k, 0.7% for AGIs $75k-100k, 1.6% for AGIs over 100k)
Taxable dividends: $2,023 (reported on 18.4% of returns)
Here:
$2,023
State:
$4,016
(% of AGI for various income ranges: 1.4% for AGIs below $10k, 0.8% for AGIs $10k-25k, 0.5% for AGIs $25k-50k, 0.8% for AGIs $50k-75k, 1.0% for AGIs $75k-100k, 1.5% for AGIs over 100k)
Net capital gain/loss: +$10,215 (reported on 16.1% of returns)
Here:
+$10,215
State:
+$11,152
(% of AGI for various income ranges: -0.1% for AGIs below $10k, -0.2% for AGIs $10k-25k, 1.0% for AGIs $25k-50k, 1.5% for AGIs $50k-75k, 2.4% for AGIs $75k-100k, 12.2% for AGIs over 100k)
Profit/loss from business: +$6,329 (reported on 18.7% of returns)
Here:
+$6,329
State:
+$9,490
(% of AGI for various income ranges: 9.8% for AGIs below $10k, 7.9% for AGIs $10k-25k, 2.0% for AGIs $25k-50k, 2.0% for AGIs $50k-75k, 0.0% for AGIs $75k-100k, 3.3% for AGIs over 100k)
IRA payment deduction: $3,271 (reported on 2.8% of returns)
28422:
$3,271
North Carolina:
$2,967
Self-employed pension: $9,400 (reported on 0.5% of returns)
Here:
$9,400
North Carolina:
$14,754
Total itemized deductions: $18,262 (25% of AGI, reported on 32.8% of returns)
Here:
$18,262
State:
$19,464
Here:
25.4% of AGI
State:
22.7% of AGI
(% of AGI for various income ranges: 17.9% for AGIs below $10k, 10.2% for AGIs $10k-25k, 16.6% for AGIs $25k-50k, 17.5% for AGIs $50k-75k, 20.2% for AGIs $75k-100k, 14.7% for AGIs over 100k)
Charity contributions deductions: $3,193 (4% of AGI, reported on 29.7% of returns)
Here:
$3,193
State:
$4,035
Here:
4.3% of AGI
State:
4.5% of AGI
(% of AGI for various income ranges: 1.3% for AGIs $10k-25k, 3.0% for AGIs $25k-50k, 3.1% for AGIs $50k-75k, 3.7% for AGIs $75k-100k, 2.0% for AGIs over 100k)
Total tax: $5,172 (reported on 70.2% of returns)
28422:
$5,172
State:
$7,257
(% of AGI for various income ranges: 3.6% for AGIs below $10k, 3.9% for AGIs $10k-25k, 5.6% for AGIs $25k-50k, 8.3% for AGIs $50k-75k, 9.8% for AGIs $75k-100k, 16.5% for AGIs over 100k)
Earned income credit: $1,914 (reported on 22.1% of returns)
Here:
$1,914
State:
$1,851
Percentage of individuals using paid preparers for their 2004 taxes: 63.3%
Here:
63%
State:
62%
(% for various income ranges: 54.6% for AGIs below $10k, 65.7% for AGIs $10k-25k, 66.4% for AGIs $25k-50k, 67.5% for AGIs $50k-75k, 63.0% for AGIs $75k-100k, 60.5% for AGIs over 100k)
Likely homosexual households (counted as self-reported same-sex unmarried-partner households)
Lesbian couples: 0.0% of all households
Gay men: 0.2% of all households
Household received Food Stamps/SNAP in the past 12 months: 599 Household did not receive Food Stamps/SNAP in the past 12 months: 2,799
Women who had a birth in the past 12 months: 78 (49 now married, 29 unmarried) Women who did not have a birth in the past 12 months: 972 (526 now married, 448 unmarried)
Housing units in zip code 28422 with a mortgage: 1,354 (123 second mortgage, 105 both second mortgage and home equity loan) Houses without a mortgage: 33
Median monthly owner costs for units with a mortgage: $1,492 Median monthly owner costs for units without a mortgage: $450
Residents with income below the poverty level in 2022:
This zip code:
13.2%
Whole state:
12.8%
Residents with income below 50% of the poverty level in 2022:
This zip code:
5.0%
Whole state:
6.8%
Median number of rooms in houses and condos:
Here:
6.4
State:
6.4
Median number of rooms in apartments:
Here:
5.5
State:
4.4
Notable locations in this zip code not listed on our city pages
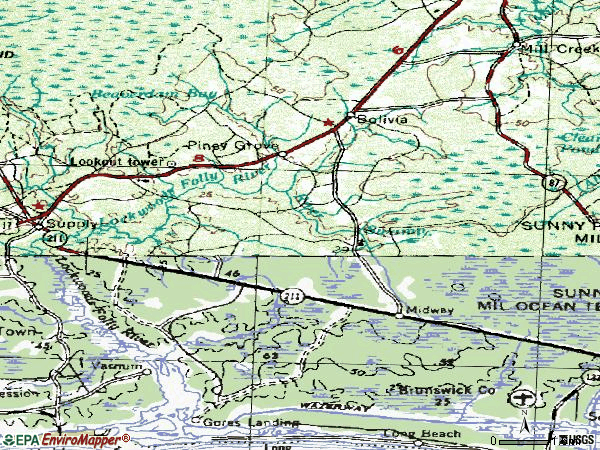
Notable locations in zip code 28422: Gores Landing (A), Clements Curve (B), Sunset Harbor (C), Brunswick County Sheriff's Office (D), Brunswick County District Criminal (E), Brunswick County Criminal Justice (F). Display/hide their locations on the map
Churches in zip code 28422 include: Mount Olive Church (A), Saint Johns Church (B), Rutland Chapel (C), Faith Church (D), Friendship Church (E), Antioch Church (F), Mill Creek Church (G), Midway Church (H), Kingdom Hall (I). Display/hide their locations on the map
Streams, rivers, and creeks: Doe Creek (A), Clark Branch (B), Bolivia Branch (C), Boggy Branch (D), Scotts Branch (E), Gap Branch (F), Sarah Hole (G), Sandy Branch (H), Red Run (I). Display/hide their locations on the map
In group quarters: 357 (-1 institutionalized population)
Size of family households: 2,014 2-persons, 262 3-persons, 281 4-persons, 164 5-persons, 25 6-persons, 16 7-or-more-persons
Size of nonfamily households: 466 1-person, 173 2-persons
618 married couples with children.
165 single-parent households (154 men, 11 women).
94.8% of residents of 28422 zip code speak English at home.
4.9% of residents speak Spanish at home (94% very well, 6% well).
1.0% of residents speak other Indo-European language at home (84% very well, 16% well).
Foreign born population: 222 (2.7%) (52.1% of them are naturalized citizens)
This zip code:
2.7%
Whole state:
8.6%
16%Sweden
10%Kazakhstan
10%France
10%Germany
9%Brazil
5%Yemen
5%Honduras
15%American
14%English
13%Irish
7%German
5%Italian
5%Scottish
3%African
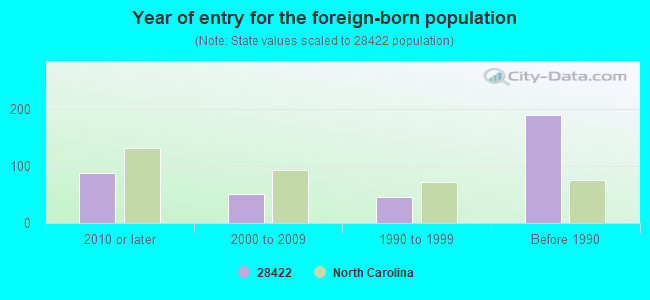
Year of entry for the foreign-born population
882010 or later
502000 to 2009
451990 to 1999
189Before 1990
Facilities with environmental interests located in this zip code:
BRITT'S MINE (2972 GALLOWAY ROAD, NE in BOLIVIA, NC)
STATE MASTER (North Carolina facility info) - -115DA4YG00M69W84AY3WG8C50Y, WASTEWATER FACILITY National Pollutant Discharge Elimination System NON-MAJOR (Tracking pollutant discharge elimination systems) - permit Business SIC classification: CLAY, CERAMIC, AND REFRACTORY MINERALS Alternative names: BRITT S MINE
BOLIVIA ELEMENTARY (4036 BUSINESS 17 E in BOLIVIA, NC)
(National Center for Education Statistics) - STATE ID-304 Organizations: BRUNSWICK COUNTY SCHOOLS (SCHOOL DISTRICT)
BOLIVIA ELEMENTARY SCHOOL WWTP (US HWY 17 BYPASS in SUNSET HARBOR, NC)
National Pollutant Discharge Elimination System NON-MAJOR (Tracking pollutant discharge elimination systems) - permit Business SIC classification: ELEMENTARY AND SECONDARY SCHOOLS Alternative names: BRUNSWICK CO BOE BOLIVIA ELEM, BRUNSWICK CO SCH-BOLIVIA ELEM
CLEMMONS & SON #1 (OLD-CL1) (1935 GALLOWAY RD NE in BOLIVIA, NC)
National Pollutant Discharge Elimination System NON-MAJOR (Tracking pollutant discharge elimination systems) - permit
CLEMMONS AND SONS #2 (NEW-CM2) (1935 GALLOWAY RD NE in BOLIVIA, NC)
National Pollutant Discharge Elimination System NON-MAJOR (Tracking pollutant discharge elimination systems) - permit
BRUNSWICK COUNTY SCHOOL DISTRICT (35 REFERENDUM DRIVE NE in BOLIVIA, NC)
AIR MONITORING SITE (Airborne pollution emission tracking) COMPLIANCE ACTIVITY (Tracking inspections of insecticide, fungicide, and rodenticide, and toxic substances)
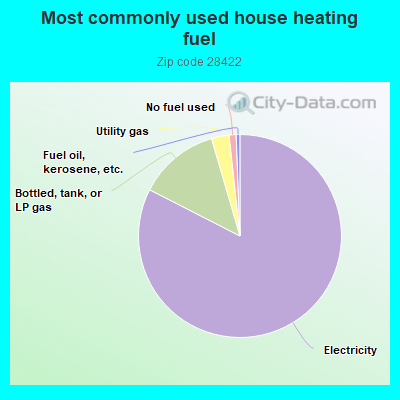
Housing units lacking complete plumbing facilities: 0.6% Housing units lacking complete kitchen facilities: 1.3%
82.2%Electricity
12.9%Bottled, tank, or LP gas
2.8%Utility gas
1.1%No fuel used
0.6%Fuel oil, kerosene, etc.
Population in 1990: 3,392. Population change in the 1990s: +1,245 (+36.7%).
Place of birth for U.S.-born residents:
This state: 3,621
Northeast: 2,047
Midwest: 623
South: 1,328
West: 316
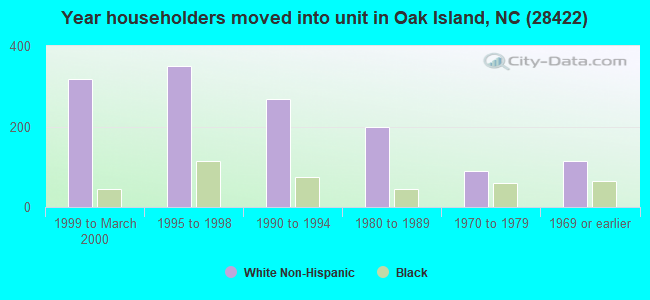
56% of the 28422 zip code residents lived in the same house 5 years ago. Out of people who lived in different houses, 61% lived in this county. Out of people who lived in different counties, 50% lived in North Carolina.
88% of the 28422 zip code residents lived in the same house 1 year ago. Out of people who lived in different houses, 46% moved from this county. Out of people who lived in different houses, 21% moved from different county within same state. Out of people who lived in different houses, 30% moved from different state. Out of people who lived in different houses, 1% moved from abroad.
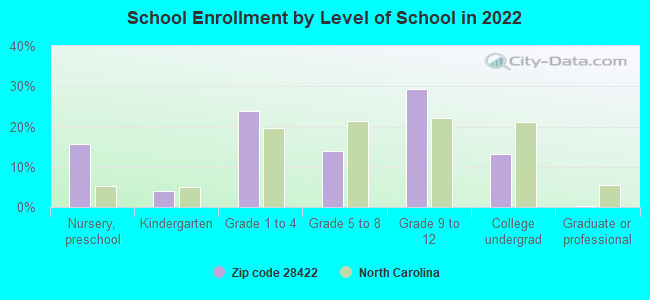
Private vs. public school enrollment:
Students in private schools in grades 1 to 8 (elementary and middle school): 36
Here:
7.5%
North Carolina:
13.8%
Students in private schools in grades 9 to 12 (high school): 32
Here:
8.7%
North Carolina:
11.9%
Students in private undergraduate colleges:
Here:
0.5%
North Carolina:
19.3%
Occupation by median earnings in the past 12 months ($)
104,941Business and financial operations occupations
95,657Architecture and engineering occupations
91,770Arts, design, entertainment, sports, and media occupations
72,232Transportation occupations
70,677Health diagnosing and treating practitioners and other technical occupations
64,327Fire fighting and prevention, and other protective service workers including supervisors
Companies with federal contracts located in this zip code (BOLIVIA, NC):
COUNTY OF BRUNSWICK (10 REFERENDUM DR) : $998,000 in 23 contractsfrom 1999 to 2005
Contracts for Pesticides Support Services, Water Services by Army, U.S. Army Corps of Engineers - civil program financing only Signed by year:2000: $105,000; 2001: $105,000; 2002: $105,000; 2003: $250,000; 2004: $100,000; 2005: $303,000; 2006: $0.
Biggest contracts:
$75,000 with Army for Pesticides Support Services. Signed on 2005-12-06. Completion date: 2006-09-30.
$75,000 with U.S. Army Corps of Engineers - civil program financing only for Pesticides Support Services. Signed on 2003-12-10. Completion date: 2003-10-01.
$75,000 with Army for Pesticides Support Services. Signed on 2003-12-10. Completion date: 2003-10-01.
$75,000 with U.S. Army Corps of Engineers - civil program financing only for Pesticides Support Services. Signed on 2002-11-26. Completion date: 2002-10-01.
COUNTY OF BRUNSWICK (45 COURTHOUSE DR) : $532,000 in 13 contractsfrom 1999 to 2005
Contracts for Water Services, Water Purification Equipment, Lease or Rental of Facilities -- Office Buildings, Gas Services, and moreby Army, U.S. Army Corps of Engineers - civil program financing only, Farmers Home Administration (disused code) Signed by year:2000: $58,000; 2001: $95,000; 2002: $92,000; 2003: $70,000; 2004: $70,000; 2005: $42,000; 2006: $0.
Biggest contracts:
$75,000 with Army for Water Services. Signed on 2002-10-08. Completion date: 2003-09-30.
$75,000 with U.S. Army Corps of Engineers - civil program financing only for Water Services. Signed on 1999-10-01. Completion date: 2000-09-30.
$70,000 with Army for Water Purification Equipment. Signed on 2004-10-29. Completion date: 2004-11-01.
$70,000 with Army for Water Services. Signed on 2003-10-09. Completion date: 2003-10-01.
HEAD ACRES FARMS INC (1509 GEORGE II HWY SE; small business)
$9,000 with Navy for Seeds and Nursery Stock. Signed on 2005-06-16. Completion date: 2005-09-30.
BRUNSWICK COMMUNITY COLLEGE (50 COLLEGE RD NE; small business)
$6,000 with Army for Lectures For Training. Signed on 2003-05-13. Completion date: 2003-06-23.
MCKEE CUSTOM BOATS (3395 BOAT LANE SE; small business)
$2,919 with Army for Maintenance, Repair and Rebuilding of Equipment -- Ships, Small Craft, Pontoons, and Floating Docks. Signed on 2004-09-28. Completion date: 2004-09-27.
Top industries in this zip code by the number of employees in 2005:
Real Estate and Rental and Leasing: Offices of Real Estate Agents and Brokers (50-99 employees: 1 establishment, 1-4 employees: 2 establishments)
Administrative and Support and Waste Management and Remediation Services: Solid Waste Collection (50-99: 1)
Health Care and Social Assistance: Temporary Shelters (20-49: 1)
Health Care and Social Assistance: Child Day Care Services (10-19: 2, 1-4: 1)
Health Care and Social Assistance: Services for the Elderly and Persons with Disabilities (10-19: 1, 1-4: 1)
Construction: Water and Sewer Line and Related Structures Construction (10-19: 1)
Other Services (except Public Administration): Pet Care (except Veterinary) Services (5-9: 2)
People in group quarters in 2010:
254 people in local jails and other municipal confinement facilities
33 people in nursing facilities/skilled-nursing facilities
21 people in other noninstitutional facilities
People in group quarters in 2000:
85 people in local jails and other confinement facilities (including police lockups)
Fatal accident statistics in 2014:
Fatal accident count: 3
Vehicles involved in fatal accidents: 6
Fatal accidents caused by drunken drivers: 0
Fatalities: 3
Persons involved in fatal accidents: 7
Pedestrians involved in fatal accidents: 0
Fatal accident statistics in 2013:
Fatal accident count: 2
Vehicles involved in fatal accidents: 3
Fatal accidents caused by drunken drivers: 0
Fatalities: 2
Persons involved in fatal accidents: 3
Pedestrians involved in fatal accidents: 0
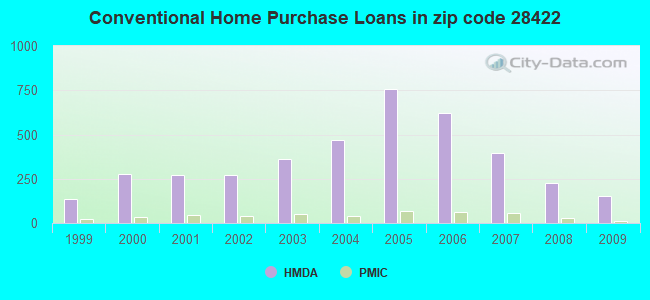
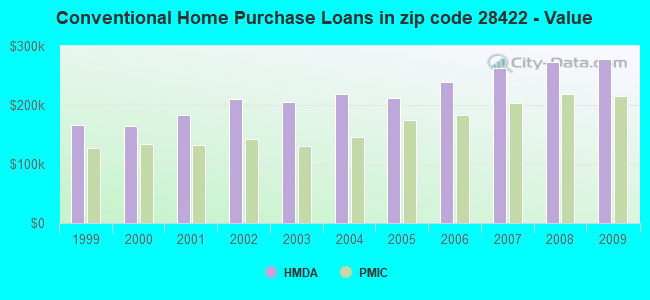
Home Mortgage Disclosure Act Aggregated Statistics For Year 2009 (Based on 6 partial tracts)
A) FHA, FSA/RHS & VA Home Purchase Loans
B) Conventional Home Purchase Loans
C) Refinancings
D) Home Improvement Loans
E) Loans on Dwellings For 5+ Families
F) Non-occupant Loans on < 5 Family Dwellings (A B C & D)
G) Loans On Manufactured Home Dwelling (A B C & D)
Number
Average Value
Number
Average Value
Number
Average Value
Number
Average Value
Number
Average Value
Number
Average Value
Number
Average Value
LOANS ORIGINATED
45
$168,717
153
$277,446
706
$224,832
15
$144,412
1
$13,220
214
$297,750
22
$73,798
APPLICATIONS APPROVED, NOT ACCEPTED
5
$187,130
11
$288,050
46
$265,630
2
$21,065
0
$0
15
$426,979
4
$48,960
APPLICATIONS DENIED
11
$166,083
30
$241,483
209
$232,295
13
$57,526
0
$0
56
$350,665
28
$76,220
APPLICATIONS WITHDRAWN
8
$161,084
24
$286,668
130
$231,686
3
$76,903
0
$0
35
$382,816
8
$94,144
FILES CLOSED FOR INCOMPLETENESS
3
$145,193
13
$294,080
41
$235,533
2
$144,540
0
$0
9
$275,653
1
$93,300
Aggregated Statistics For Year 2008 (Based on 6 partial tracts)
A) FHA, FSA/RHS & VA Home Purchase Loans
B) Conventional Home Purchase Loans
C) Refinancings
D) Home Improvement Loans
E) Loans on Dwellings For 5+ Families
F) Non-occupant Loans on < 5 Family Dwellings (A B C & D)
G) Loans On Manufactured Home Dwelling (A B C & D)
Number
Average Value
Number
Average Value
Number
Average Value
Number
Average Value
Number
Average Value
Number
Average Value
Number
Average Value
LOANS ORIGINATED
52
$154,742
224
$273,652
395
$232,371
24
$160,787
2
$1,100,430
174
$324,647
41
$84,546
APPLICATIONS APPROVED, NOT ACCEPTED
4
$190,855
18
$276,877
44
$251,960
5
$38,632
0
$0
18
$387,969
6
$90,122
APPLICATIONS DENIED
9
$167,178
39
$284,891
170
$233,228
29
$89,164
0
$0
37
$415,161
28
$94,505
APPLICATIONS WITHDRAWN
5
$159,024
35
$266,250
73
$264,553
5
$215,566
0
$0
30
$400,459
6
$107,725
FILES CLOSED FOR INCOMPLETENESS
1
$150,990
17
$377,405
21
$234,603
1
$305,160
0
$0
9
$498,326
2
$124,565
Aggregated Statistics For Year 2007 (Based on 6 partial tracts)
A) FHA, FSA/RHS & VA Home Purchase Loans
B) Conventional Home Purchase Loans
C) Refinancings
D) Home Improvement Loans
E) Loans on Dwellings For 5+ Families
F) Non-occupant Loans on < 5 Family Dwellings (A B C & D)
G) Loans On Manufactured Home Dwelling (A B C & D)
Number
Average Value
Number
Average Value
Number
Average Value
Number
Average Value
Number
Average Value
Number
Average Value
Number
Average Value
LOANS ORIGINATED
26
$139,712
393
$262,647
396
$239,279
37
$83,231
2
$236,260
248
$353,843
62
$84,566
APPLICATIONS APPROVED, NOT ACCEPTED
2
$72,270
40
$283,169
55
$196,525
11
$55,370
0
$0
26
$415,624
6
$71,977
APPLICATIONS DENIED
7
$141,149
66
$240,910
174
$215,221
42
$66,732
0
$0
46
$408,646
34
$78,127
APPLICATIONS WITHDRAWN
4
$151,815
43
$280,183
93
$229,870
7
$136,441
0
$0
38
$322,939
4
$67,810
FILES CLOSED FOR INCOMPLETENESS
1
$126,820
20
$311,146
25
$261,312
1
$26,890
0
$0
10
$461,697
0
$0
Aggregated Statistics For Year 2006 (Based on 6 partial tracts)
A) FHA, FSA/RHS & VA Home Purchase Loans
B) Conventional Home Purchase Loans
C) Refinancings
D) Home Improvement Loans
F) Non-occupant Loans on < 5 Family Dwellings (A B C & D)
G) Loans On Manufactured Home Dwelling (A B C & D)
Number
Average Value
Number
Average Value
Number
Average Value
Number
Average Value
Number
Average Value
Number
Average Value
LOANS ORIGINATED
31
$155,527
623
$239,191
380
$229,525
45
$102,021
352
$310,146
49
$81,074
APPLICATIONS APPROVED, NOT ACCEPTED
1
$227,740
66
$165,590
47
$179,881
5
$41,768
29
$200,155
12
$68,570
APPLICATIONS DENIED
4
$142,218
103
$175,613
139
$171,186
30
$80,038
42
$325,344
49
$68,104
APPLICATIONS WITHDRAWN
1
$245,950
67
$248,952
89
$212,036
8
$103,888
42
$276,089
7
$96,604
FILES CLOSED FOR INCOMPLETENESS
0
$0
24
$306,281
25
$173,941
1
$102,200
10
$374,814
1
$80,490
Aggregated Statistics For Year 2005 (Based on 6 partial tracts)
A) FHA, FSA/RHS & VA Home Purchase Loans
B) Conventional Home Purchase Loans
C) Refinancings
D) Home Improvement Loans
F) Non-occupant Loans on < 5 Family Dwellings (A B C & D)
G) Loans On Manufactured Home Dwelling (A B C & D)
Number
Average Value
Number
Average Value
Number
Average Value
Number
Average Value
Number
Average Value
Number
Average Value
LOANS ORIGINATED
35
$140,612
758
$212,331
331
$227,864
34
$92,999
401
$267,470
63
$62,990
APPLICATIONS APPROVED, NOT ACCEPTED
2
$126,285
62
$188,989
42
$155,966
7
$43,741
25
$296,925
13
$59,711
APPLICATIONS DENIED
6
$103,592
107
$137,714
140
$140,482
31
$44,098
35
$286,963
58
$66,786
APPLICATIONS WITHDRAWN
2
$138,850
61
$223,237
69
$185,156
10
$111,804
29
$350,136
15
$78,870
FILES CLOSED FOR INCOMPLETENESS
1
$63,910
25
$228,714
38
$153,522
1
$24,540
9
$240,061
2
$100,075
Aggregated Statistics For Year 2004 (Based on 6 partial tracts)
A) FHA, FSA/RHS & VA Home Purchase Loans
B) Conventional Home Purchase Loans
C) Refinancings
D) Home Improvement Loans
E) Loans on Dwellings For 5+ Families
F) Non-occupant Loans on < 5 Family Dwellings (A B C & D)
G) Loans On Manufactured Home Dwelling (A B C & D)
Number
Average Value
Number
Average Value
Number
Average Value
Number
Average Value
Number
Average Value
Number
Average Value
Number
Average Value
LOANS ORIGINATED
32
$123,636
468
$218,333
281
$197,990
23
$90,676
1
$1,098,200
267
$276,145
44
$60,657
APPLICATIONS APPROVED, NOT ACCEPTED
3
$119,213
34
$131,797
29
$135,247
5
$68,044
0
$0
12
$178,227
13
$55,452
APPLICATIONS DENIED
5
$74,150
73
$138,662
139
$120,834
20
$54,897
0
$0
27
$256,152
54
$58,807
APPLICATIONS WITHDRAWN
3
$132,817
47
$189,875
64
$150,962
6
$59,212
0
$0
22
$202,588
16
$65,269
FILES CLOSED FOR INCOMPLETENESS
2
$123,130
19
$273,029
13
$126,936
1
$54,600
0
$0
3
$286,400
1
$56,750
Aggregated Statistics For Year 2003 (Based on 6 partial tracts)
A) FHA, FSA/RHS & VA Home Purchase Loans
B) Conventional Home Purchase Loans
C) Refinancings
D) Home Improvement Loans
E) Loans on Dwellings For 5+ Families
F) Non-occupant Loans on < 5 Family Dwellings (A B C & D)
Number
Average Value
Number
Average Value
Number
Average Value
Number
Average Value
Number
Average Value
Number
Average Value
LOANS ORIGINATED
24
$111,874
361
$205,411
691
$183,140
10
$21,826
1
$260,700
292
$257,565
APPLICATIONS APPROVED, NOT ACCEPTED
4
$99,892
39
$126,717
56
$137,532
3
$23,657
0
$0
16
$242,884
APPLICATIONS DENIED
7
$85,386
68
$81,952
151
$114,448
14
$29,059
0
$0
22
$145,585
APPLICATIONS WITHDRAWN
1
$71,480
32
$188,223
93
$164,768
2
$31,790
0
$0
21
$273,190
FILES CLOSED FOR INCOMPLETENESS
0
$0
10
$214,461
22
$171,570
1
$16,060
0
$0
6
$214,135
Aggregated Statistics For Year 2002 (Based on 6 partial tracts)
A) FHA, FSA/RHS & VA Home Purchase Loans
B) Conventional Home Purchase Loans
C) Refinancings
D) Home Improvement Loans
F) Non-occupant Loans on < 5 Family Dwellings (A B C & D)
Number
Average Value
Number
Average Value
Number
Average Value
Number
Average Value
Number
Average Value
LOANS ORIGINATED
21
$105,153
270
$209,911
486
$175,535
9
$71,098
208
$261,428
APPLICATIONS APPROVED, NOT ACCEPTED
1
$222,780
31
$107,835
46
$130,501
1
$53,560
14
$259,294
APPLICATIONS DENIED
3
$104,660
62
$82,158
120
$94,103
7
$28,669
12
$234,712
APPLICATIONS WITHDRAWN
2
$88,850
22
$190,744
80
$194,170
4
$26,740
14
$303,396
FILES CLOSED FOR INCOMPLETENESS
1
$169,010
16
$257,736
24
$154,527
0
$0
9
$304,612
Aggregated Statistics For Year 2001 (Based on 6 partial tracts)
A) FHA, FSA/RHS & VA Home Purchase Loans
B) Conventional Home Purchase Loans
C) Refinancings
D) Home Improvement Loans
F) Non-occupant Loans on < 5 Family Dwellings (A B C & D)
Number
Average Value
Number
Average Value
Number
Average Value
Number
Average Value
Number
Average Value
LOANS ORIGINATED
24
$101,501
271
$182,794
393
$163,363
15
$51,245
166
$243,055
APPLICATIONS APPROVED, NOT ACCEPTED
1
$138,050
30
$97,727
37
$101,922
4
$38,210
8
$272,942
APPLICATIONS DENIED
3
$92,407
87
$92,204
119
$93,752
15
$25,383
15
$217,072
APPLICATIONS WITHDRAWN
2
$113,770
26
$200,622
74
$106,089
4
$38,180
14
$232,274
FILES CLOSED FOR INCOMPLETENESS
0
$0
10
$206,529
22
$151,178
1
$17,720
5
$206,258
Aggregated Statistics For Year 2000 (Based on 6 partial tracts)
A) FHA, FSA/RHS & VA Home Purchase Loans
B) Conventional Home Purchase Loans
C) Refinancings
D) Home Improvement Loans
E) Loans on Dwellings For 5+ Families
F) Non-occupant Loans on < 5 Family Dwellings (A B C & D)
Number
Average Value
Number
Average Value
Number
Average Value
Number
Average Value
Number
Average Value
Number
Average Value
LOANS ORIGINATED
16
$99,123
276
$164,649
119
$113,801
14
$14,054
1
$425,680
106
$201,386
APPLICATIONS APPROVED, NOT ACCEPTED
11
$47,241
53
$88,771
35
$83,271
6
$23,922
0
$0
10
$209,399
APPLICATIONS DENIED
14
$58,069
124
$70,219
109
$73,826
15
$15,556
0
$0
12
$146,900
APPLICATIONS WITHDRAWN
2
$69,535
28
$136,750
41
$82,629
3
$23,240
0
$0
7
$219,204
FILES CLOSED FOR INCOMPLETENESS
0
$0
9
$171,141
9
$77,157
1
$16,920
0
$0
2
$113,295
Aggregated Statistics For Year 1999 (Based on 3 partial tracts)
A) FHA, FSA/RHS & VA Home Purchase Loans
B) Conventional Home Purchase Loans
C) Refinancings
D) Home Improvement Loans
F) Non-occupant Loans on < 5 Family Dwellings (A B C & D)
2004 - 2018 National Fire Incident Reporting System (NFIRS) incidents
Based on the data from the years 2004 - 2018 the average number of fire incidents per year is 71. The highest number of fire incidents - 148 took place in 2007, and the least - 3 in 2005. The data has an increasing trend.
When looking into fire subcategories, the most reports belonged to: Outside Fires (49.4%), and Structure Fires (37.9%).
Fire incident types reported to NFIRS in Zip Code 28422


 Nearest zip codes: 28462, 28461, 28465, 28479, 28470, 28451.


 Based on the data from the years 2004 - 2018 the average number of fire incidents per year is 71. The highest number of fire incidents - 148 took place in 2007, and the least - 3 in 2005. The data has an increasing trend.
 When looking into fire subcategories, the most reports belonged to: Outside Fires (49.4%), and Structure Fires (37.9%).