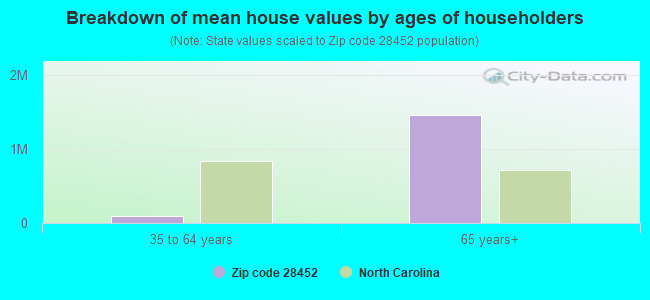
Estimated median house/condo value in 2022: $105,479
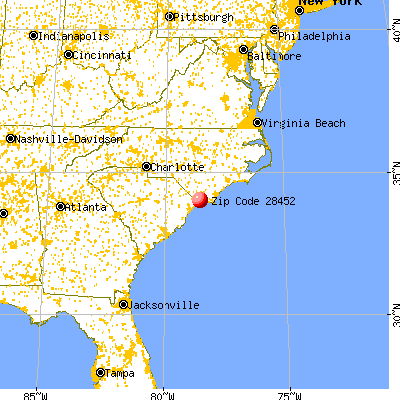
28452:
$105,479
North Carolina:
$280,600
According to our research of North Carolina and other state lists, there were 9 registered sex offenders living in 28452 zip code as of June 08, 2024. The ratio of all residents to sex offenders in zip code 28452 is 127 to 1.
Median resident age:
This zip code:
30.7 years
North Carolina median age:
39.2 years
Average household size:
This zip code:
3.2 people
North Carolina:
2.4 people
Averages for the 2020 tax year for zip code 28452, filed in 2021:
Average Adjusted Gross Income (AGI) in 2020: $29,384 (Individual Income Tax Returns)
Here:
$29,384
State:
$70,020
Salary/wage: $27,519 (reported on 81.2% of returns)
Here:
$27,519
State:
$58,387
(% of AGI for various income ranges: 1179.3% for AGIs below $25k, 3162.9% for AGIs $25k-50k, 4550.0% for AGIs $50k-75k)
Taxable interest for individuals: $225 (reported on 12.5% of returns)
This zip code:
$225
North Carolina:
$1,479
(% of AGI for various income ranges: 12.9% for AGIs $25k-50k)
Profit/loss from business: +$9,440 (reported on 15.6% of returns)
Here:
+$9,440
State:
+$11,710
(% of AGI for various income ranges: 186.4% for AGIs below $25k, 301.4% for AGIs $25k-50k)
Earned income credit: $2,417 (reported on 37.5% of returns)
Here:
$2,417
State:
$2,337
(% of AGI for various income ranges: 160.0% for AGIs below $25k, 94.3% for AGIs $25k-50k)
Percentage of individuals using paid preparers for their 2020 taxes: 93.8%
Here:
94%
State:
93%
(% for various income ranges: 89.5% for AGIs below $25k, 100.0% for AGIs $25k-50k, 100.0% for AGIs $50k-75k, 100.0% for AGIs $75k-100k)
Averages for the 2012 tax year for zip code 28452, filed in 2013:
Average Adjusted Gross Income (AGI) in 2012: $25,094 (Individual Income Tax Returns)
Here:
$25,094
State:
$54,937
Salary/wage: $22,489 (reported on 87.5% of returns)
Here:
$22,489
State:
$46,336
(% of AGI for various income ranges: 77.2% for AGIs below $25k, 87.7% for AGIs $25k-50k, 70.9% for AGIs $50k-75k)
Taxable interest for individuals: $267 (reported on 18.8% of returns)
This zip code:
$267
North Carolina:
$1,298
(% of AGI for various income ranges: 0.4% for AGIs below $25k, 0.2% for AGIs $25k-50k)
Profit/loss from business: +$6,483 (reported on 18.8% of returns)
Here:
+$6,483
State:
+$10,311
(% of AGI for various income ranges: 8.8% for AGIs below $25k, 6.4% for AGIs $25k-50k)
Total itemized deductions: $14,800 (36% of AGI, reported on 9.4% of returns)
Here:
$14,800
State:
$23,438
Here:
36.0% of AGI
State:
21.5% of AGI
Charity contributions: $2,133 (reported on 9.4% of returns)
Here:
$2,133
State:
$4,687
Taxes paid: $3,167 (reported on 9.4% of returns)
28452:
$3,167
State:
$8,823
Earned income credit: $2,343 (reported on 43.8% of returns)
Here:
$2,343
State:
$2,376
(% of AGI for various income ranges: 10.5% for AGIs below $25k, 2.6% for AGIs $25k-50k)
Percentage of individuals using paid preparers for their 2012 taxes: 62.5%
Here:
62%
State:
53%
(% for various income ranges: 60.0% for AGIs below $25k, 62.5% for AGIs $25k-50k, 75.0% for AGIs $50k-75k)
Averages for the 2004 tax year for zip code 28452, filed in 2005:
Average Adjusted Gross Income (AGI) in 2004: $20,223 (Individual Income Tax Returns)
Here:
$20,223
State:
$45,376
Salary/wage: $18,918 (reported on 87.5% of returns)
Here:
$18,918
State:
$39,442
(% of AGI for various income ranges: 90.4% for AGIs below $10k, 81.6% for AGIs $10k-25k, 82.4% for AGIs $25k-50k, 78.4% for AGIs $50k-75k)
Taxable interest for individuals: $617 (reported on 14.7% of returns)
This zip code:
$617
North Carolina:
$1,515
Taxable dividends: $750 (reported on 5.0% of returns)
Here:
$750
State:
$4,016
Profit/loss from business: +$4,864 (reported on 13.8% of returns)
Here:
+$4,864
State:
+$9,490
Total itemized deductions: $12,955 (30% of AGI, reported on 13.8% of returns)
Here:
$12,955
State:
$19,464
Here:
29.7% of AGI
State:
22.7% of AGI
Charity contributions deductions: $2,455 (5% of AGI, reported on 10.3% of returns)
Here:
$2,455
State:
$4,035
Here:
5.3% of AGI
State:
4.5% of AGI
Total tax: $2,031 (reported on 50.8% of returns)
28452:
$2,031
State:
$7,257
(% of AGI for various income ranges: 2.2% for AGIs below $10k, 2.7% for AGIs $10k-25k, 5.2% for AGIs $25k-50k, 9.8% for AGIs $50k-75k)
Earned income credit: $1,937 (reported on 39.8% of returns)
Here:
$1,937
State:
$1,851
Percentage of individuals using paid preparers for their 2004 taxes: 79.3%
Here:
79%
State:
62%
(% for various income ranges: 80.0% for AGIs below $10k, 81.3% for AGIs $10k-25k, 78.3% for AGIs $25k-50k, 66.7% for AGIs $50k-75k)
Household received Food Stamps/SNAP in the past 12 months: 52 Household did not receive Food Stamps/SNAP in the past 12 months: 120
Women who did not have a birth in the past 12 months: 167 (88 now married, 78 unmarried)
Housing units in zip code 28452 with a mortgage: 83 (17 second mortgage, 17 both second mortgage and home equity loan) Residents with income below the poverty level in 2022:
This zip code:
32.5%
Whole state:
12.8%
Residents with income below 50% of the poverty level in 2022:
This zip code:
18.4%
Whole state:
6.8%
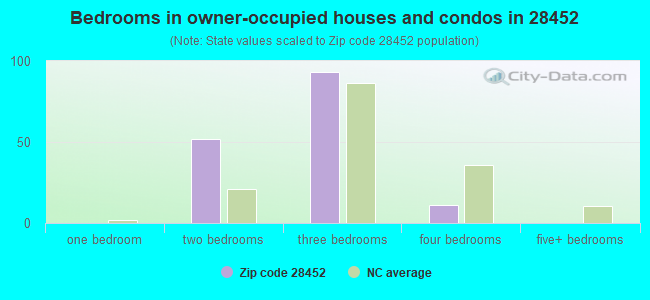
Median number of rooms in houses and condos:
Here:
6.1
State:
6.4
Notable locations in this zip code not listed on our city pages
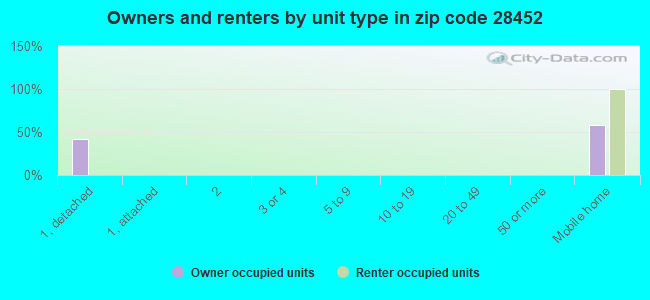
Size of family households: 45 2-persons, 37 3-persons, 71 4-persons
Size of nonfamily households: 13 1-person
28 married couples with children.
0 single-parent households ().
92.9% of residents of 28452 zip code speak English at home.
6.1% of residents speak Spanish at home (100% very well).
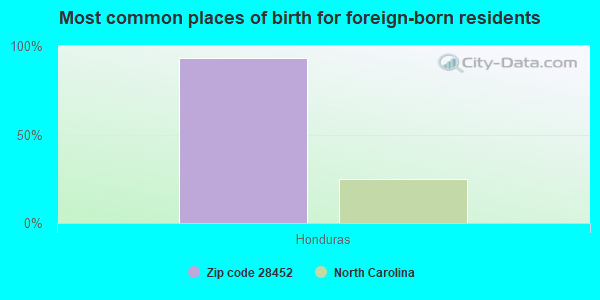
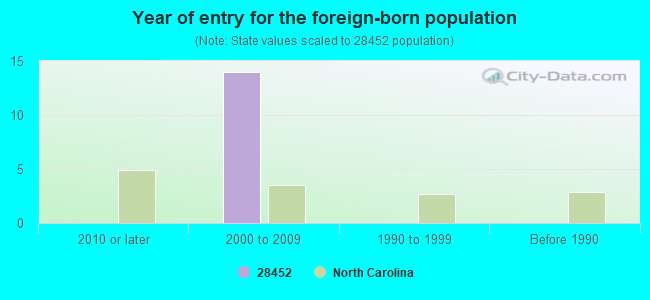
Foreign born population: 16 (3.0%) (100.0% of them are naturalized citizens)
This zip code:
3.0%
Whole state:
8.6%
93%Honduras
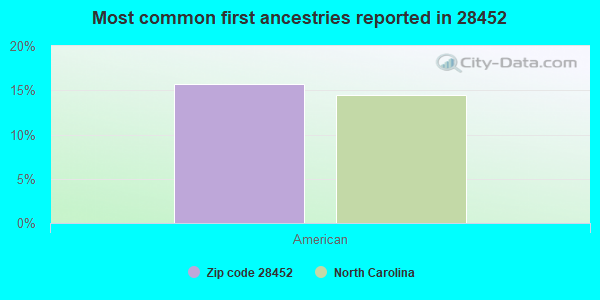
16%American
Year of entry for the foreign-born population
02010 or later
142000 to 2009
01990 to 1999
0Before 1990
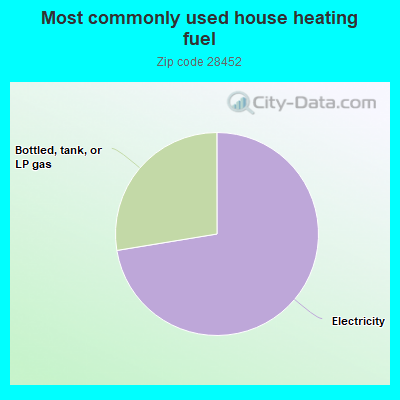
72.7%Electricity
27.7%Bottled, tank, or LP gas
Population in 1990: 1,913.
Place of birth for U.S.-born residents:
This state: 357
Northeast: 13
Midwest: 59
South: 66
West: 35
38% of the 28452 zip code residents lived in the same house 5 years ago. Out of people who lived in different houses, 85% lived in this county. Out of people who lived in different counties, 50% lived in North Carolina.
86% of the 28452 zip code residents lived in the same house 1 year ago. Out of people who lived in different houses, 104% moved from different county within same state.
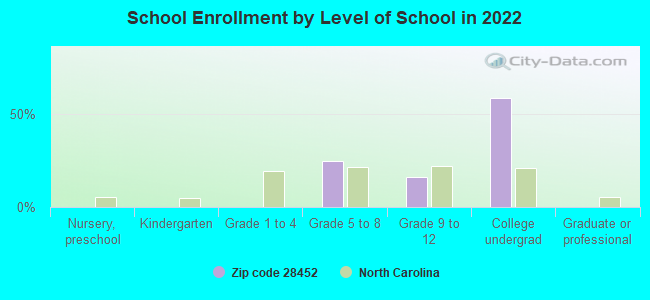
Private vs. public school enrollment:
Students in private schools in grades 1 to 8 (elementary and middle school):
Here:
0.0%
North Carolina:
13.8%
Students in private schools in grades 9 to 12 (high school):
Here:
0.0%
North Carolina:
11.9%
Students in private undergraduate colleges:
Here:
0.0%
North Carolina:
19.3%
Top industries in this zip code by the number of employees in 2005:
Construction: Plumbing, Heating, and Air-Conditioning Contractors (20-49 employees: 1 establishment)
Arts, Entertainment, and Recreation: All Other Amusement and Recreation Industries (5-9: 1)
Health Care and Social Assistance: Child Day Care Services (5-9: 1)
Fatal accident statistics in 2012:
Fatal accident count: 2
Vehicles involved in fatal accidents: 2
Fatal accidents caused by drunken drivers: 1
Fatalities: 2
Persons involved in fatal accidents: 2
Pedestrians involved in fatal accidents: 0
Fatal accident statistics in 2011:
Fatal accident count: 1
Vehicles involved in fatal accidents: 1
Fatal accidents caused by drunken drivers: 0
Fatalities: 1
Persons involved in fatal accidents: 1
Pedestrians involved in fatal accidents: 0
Home Mortgage Disclosure Act Aggregated Statistics For Year 2009 (Based on 2 partial tracts)
A) FHA, FSA/RHS & VA Home Purchase Loans
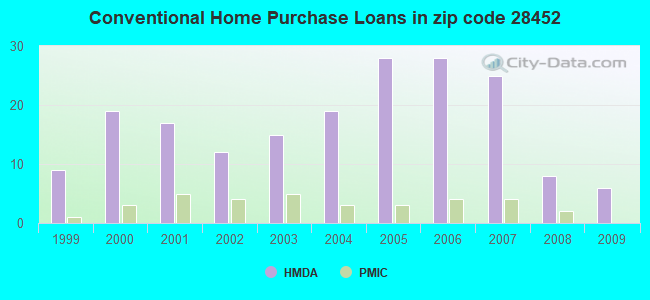
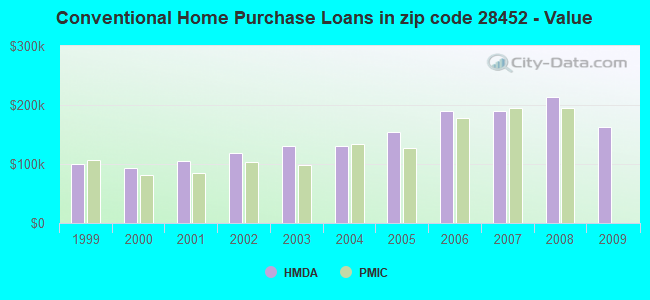
B) Conventional Home Purchase Loans
C) Refinancings
D) Home Improvement Loans
F) Non-occupant Loans on < 5 Family Dwellings (A B C & D)
G) Loans On Manufactured Home Dwelling (A B C & D)
Number
Average Value
Number
Average Value
Number
Average Value
Number
Average Value
Number
Average Value
Number
Average Value
LOANS ORIGINATED
2
$134,900
6
$163,517
29
$178,322
1
$61,080
8
$171,100
2
$65,515
APPLICATIONS APPROVED, NOT ACCEPTED
0
$0
1
$81,840
2
$165,815
0
$0
1
$139,050
1
$33,700
APPLICATIONS DENIED
1
$135,560
2
$114,840
9
$189,986
1
$51,450
3
$165,420
2
$60,890
APPLICATIONS WITHDRAWN
1
$79,580
1
$218,630
5
$180,152
0
$0
1
$264,890
0
$0
FILES CLOSED FOR INCOMPLETENESS
1
$59,850
0
$0
2
$141,740
0
$0
0
$0
1
$53,150
Aggregated Statistics For Year 2008 (Based on 2 partial tracts)
A) FHA, FSA/RHS & VA Home Purchase Loans
B) Conventional Home Purchase Loans
C) Refinancings
D) Home Improvement Loans
F) Non-occupant Loans on < 5 Family Dwellings (A B C & D)
G) Loans On Manufactured Home Dwelling (A B C & D)
Number
Average Value
Number
Average Value
Number
Average Value
Number
Average Value
Number
Average Value
Number
Average Value
LOANS ORIGINATED
2
$141,505
8
$213,179
17
$192,676
2
$129,330
7
$235,299
3
$89,303
APPLICATIONS APPROVED, NOT ACCEPTED
0
$0
1
$279,050
3
$176,087
0
$0
1
$261,490
0
$0
APPLICATIONS DENIED
0
$0
2
$158,780
9
$161,130
3
$43,457
2
$143,725
3
$68,943
APPLICATIONS WITHDRAWN
0
$0
1
$143,390
4
$178,722
0
$0
1
$189,370
1
$71,840
FILES CLOSED FOR INCOMPLETENESS
0
$0
1
$356,740
1
$199,470
0
$0
0
$0
0
$0
Aggregated Statistics For Year 2007 (Based on 2 partial tracts)
A) FHA, FSA/RHS & VA Home Purchase Loans
B) Conventional Home Purchase Loans
C) Refinancings
D) Home Improvement Loans
F) Non-occupant Loans on < 5 Family Dwellings (A B C & D)
G) Loans On Manufactured Home Dwelling (A B C & D)
Number
Average Value
Number
Average Value
Number
Average Value
Number
Average Value
Number
Average Value
Number
Average Value
LOANS ORIGINATED
1
$148,210
25
$189,529
17
$168,832
3
$63,027
19
$183,727
4
$82,318
APPLICATIONS APPROVED, NOT ACCEPTED
0
$0
2
$178,040
3
$156,577
0
$0
2
$129,610
1
$58,910
APPLICATIONS DENIED
0
$0
3
$175,050
9
$172,270
2
$43,280
2
$214,005
3
$81,813
APPLICATIONS WITHDRAWN
0
$0
3
$132,190
2
$231,610
0
$0
1
$183,420
0
$0
FILES CLOSED FOR INCOMPLETENESS
0
$0
1
$84,770
1
$190,500
0
$0
0
$0
0
$0
Aggregated Statistics For Year 2006 (Based on 2 partial tracts)
A) FHA, FSA/RHS & VA Home Purchase Loans
B) Conventional Home Purchase Loans
C) Refinancings
D) Home Improvement Loans
F) Non-occupant Loans on < 5 Family Dwellings (A B C & D)
G) Loans On Manufactured Home Dwelling (A B C & D)
Number
Average Value
Number
Average Value
Number
Average Value
Number
Average Value
Number
Average Value
Number
Average Value
LOANS ORIGINATED
1
$62,300
28
$189,704
17
$150,129
2
$59,470
18
$186,393
5
$70,404
APPLICATIONS APPROVED, NOT ACCEPTED
0
$0
2
$147,545
2
$124,940
0
$0
1
$80,240
1
$74,950
APPLICATIONS DENIED
0
$0
6
$121,068
9
$120,433
2
$92,135
2
$152,455
5
$85,546
APPLICATIONS WITHDRAWN
0
$0
3
$196,823
3
$118,190
1
$45,220
1
$230,340
1
$89,210
FILES CLOSED FOR INCOMPLETENESS
0
$0
0
$0
1
$195,790
0
$0
0
$0
0
$0
Aggregated Statistics For Year 2005 (Based on 2 partial tracts)
A) FHA, FSA/RHS & VA Home Purchase Loans
B) Conventional Home Purchase Loans
C) Refinancings
D) Home Improvement Loans
F) Non-occupant Loans on < 5 Family Dwellings (A B C & D)
G) Loans On Manufactured Home Dwelling (A B C & D)
Number
Average Value
Number
Average Value
Number
Average Value
Number
Average Value
Number
Average Value
Number
Average Value
LOANS ORIGINATED
1
$108,840
28
$153,727
13
$141,012
2
$26,525
15
$164,508
4
$62,328
APPLICATIONS APPROVED, NOT ACCEPTED
0
$0
2
$144,245
2
$166,995
0
$0
1
$184,270
1
$54,750
APPLICATIONS DENIED
1
$51,540
7
$98,217
8
$109,528
1
$58,430
2
$105,305
6
$61,580
APPLICATIONS WITHDRAWN
0
$0
3
$142,010
4
$122,035
0
$0
1
$125,460
2
$63,860
FILES CLOSED FOR INCOMPLETENESS
0
$0
1
$106,670
2
$130,320
0
$0
0
$0
0
$0
Aggregated Statistics For Year 2004 (Based on 2 partial tracts)
B) Conventional Home Purchase Loans
C) Refinancings
D) Home Improvement Loans
F) Non-occupant Loans on < 5 Family Dwellings (A B C & D)
G) Loans On Manufactured Home Dwelling (A B C & D)
Number
Average Value
Number
Average Value
Number
Average Value
Number
Average Value
Number
Average Value
LOANS ORIGINATED
19
$130,332
13
$120,512
1
$62,960
10
$126,817
5
$61,870
APPLICATIONS APPROVED, NOT ACCEPTED
3
$102,487
3
$90,780
0
$0
1
$106,200
3
$56,010
APPLICATIONS DENIED
6
$81,483
10
$109,938
1
$45,220
2
$102,850
6
$59,865
APPLICATIONS WITHDRAWN
2
$116,960
5
$94,456
0
$0
1
$92,040
1
$91,000
FILES CLOSED FOR INCOMPLETENESS
1
$69,570
1
$102,900
0
$0
0
$0
0
$0
Aggregated Statistics For Year 2003 (Based on 2 partial tracts)
B) Conventional Home Purchase Loans
C) Refinancings
D) Home Improvement Loans
F) Non-occupant Loans on < 5 Family Dwellings (A B C & D)
Number
Average Value
Number
Average Value
Number
Average Value
Number
Average Value
LOANS ORIGINATED
15
$129,939
29
$119,123
1
$11,420
10
$145,423
APPLICATIONS APPROVED, NOT ACCEPTED
1
$175,300
3
$102,863
0
$0
1
$182,000
APPLICATIONS DENIED
4
$72,852
8
$94,671
1
$26,150
1
$95,530
APPLICATIONS WITHDRAWN
2
$92,135
4
$102,400
0
$0
1
$142,540
FILES CLOSED FOR INCOMPLETENESS
0
$0
1
$86,850
0
$0
0
$0
Aggregated Statistics For Year 2002 (Based on 2 partial tracts)
A) FHA, FSA/RHS & VA Home Purchase Loans
B) Conventional Home Purchase Loans
C) Refinancings
D) Home Improvement Loans
F) Non-occupant Loans on < 5 Family Dwellings (A B C & D)
Number
Average Value
Number
Average Value
Number
Average Value
Number
Average Value
Number
Average Value
LOANS ORIGINATED
1
$65,040
12
$118,354
21
$114,714
1
$16,050
8
$122,968
APPLICATIONS APPROVED, NOT ACCEPTED
0
$0
3
$50,503
2
$120,220
0
$0
1
$66,550
APPLICATIONS DENIED
0
$0
5
$65,590
7
$83,976
0
$0
1
$110,450
APPLICATIONS WITHDRAWN
0
$0
2
$110,540
4
$96,075
0
$0
1
$96,850
FILES CLOSED FOR INCOMPLETENESS
0
$0
0
$0
1
$126,970
0
$0
0
$0
Aggregated Statistics For Year 2001 (Based on 2 partial tracts)
B) Conventional Home Purchase Loans
C) Refinancings
D) Home Improvement Loans
F) Non-occupant Loans on < 5 Family Dwellings (A B C & D)
Number
Average Value
Number
Average Value
Number
Average Value
Number
Average Value
LOANS ORIGINATED
17
$105,139
21
$116,872
1
$31,250
7
$132,187
APPLICATIONS APPROVED, NOT ACCEPTED
4
$74,032
3
$86,123
0
$0
1
$108,650
APPLICATIONS DENIED
12
$59,567
8
$70,635
1
$39,930
1
$56,830
APPLICATIONS WITHDRAWN
2
$134,945
3
$74,733
0
$0
0
$0
FILES CLOSED FOR INCOMPLETENESS
0
$0
1
$47,480
0
$0
0
$0
Aggregated Statistics For Year 2000 (Based on 2 partial tracts)
A) FHA, FSA/RHS & VA Home Purchase Loans
B) Conventional Home Purchase Loans
C) Refinancings
D) Home Improvement Loans
F) Non-occupant Loans on < 5 Family Dwellings (A B C & D)
Number
Average Value
Number
Average Value
Number
Average Value
Number
Average Value
Number
Average Value
LOANS ORIGINATED
0
$0
19
$93,237
8
$89,916
1
$12,080
6
$108,213
APPLICATIONS APPROVED, NOT ACCEPTED
1
$32,760
5
$68,628
3
$76,527
0
$0
0
$0
APPLICATIONS DENIED
1
$86,000
14
$58,271
8
$72,192
1
$20,300
1
$45,030
APPLICATIONS WITHDRAWN
0
$0
2
$59,380
4
$64,002
0
$0
0
$0
FILES CLOSED FOR INCOMPLETENESS
0
$0
0
$0
1
$46,070
0
$0
0
$0
Aggregated Statistics For Year 1999 (Based on 1 partial tract)
B) Conventional Home Purchase Loans
C) Refinancings
D) Home Improvement Loans
F) Non-occupant Loans on < 5 Family Dwellings (A B C & D)
Detailed PMIC statistics for the following Tracts:0205.01
2003 - 2018 National Fire Incident Reporting System (NFIRS) incidents
Based on the data from the years 2003 - 2018 the average number of fires per year is 7. The highest number of reported fire incidents - 22 took place in 2007, and the least - 2 in 2010. The data has a constant trend.
When looking into fire subcategories, the most reports belonged to: Structure Fires (56.9%), and Outside Fires (24.8%).
Fire incident types reported to NFIRS in Zip Code 28452


 Nearest zip codes: 28467, 28468, 28420, 28469, 28470, 28455.


 Based on the data from the years 2003 - 2018 the average number of fires per year is 7. The highest number of reported fire incidents - 22 took place in 2007, and the least - 2 in 2010. The data has a constant trend.
 When looking into fire subcategories, the most reports belonged to: Structure Fires (56.9%), and Outside Fires (24.8%).