Estimated zip code population in 2022: 4,520 Zip code population in 2010: 4,588 Zip code population in 2000: 2,257
Houses and condos: 2,183 Renter-occupied apartments: 264
% of renters here:
14%
State:
33%
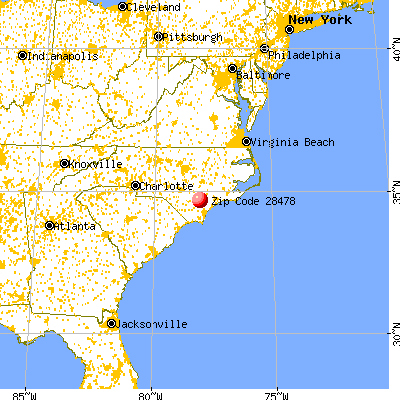
March 2022 cost of living index in zip code 28478: 79.5 (low, U.S. average is 100)
Land area: 121.0 sq. mi. Water area: 0.2 sq. mi.
Population density: 37 people per square mile
(very low).
OSM Map
General Map
Google Map
MSN Map
OSM Map
General Map
Google Map
MSN Map
OSM Map
General Map
Google Map
MSN Map
OSM Map
General Map
Google Map
MSN Map
Please wait while loading the map...
Real estate property taxes paid for housing units in 2022:
This zip code:
0.7% ($1,261)
North Carolina:
0.6% ($1,769)
Median real estate property taxes paid for housing units with mortgages in 2022: $1,357 (0.7%) Median real estate property taxes paid for housing units with no mortgage in 2022: $1,186 (0.7%)
Business Search- 14 Million verified businesses
Males: 2,120
(46.9%)
Females: 2,400
(53.1%)
For population 25 years and over in 28478:
High school or higher: 84.8%
Bachelor's degree or higher: 14.6%
Graduate or professional degree: 4.3%
Unemployed: 6.1%
Mean travel time to work (commute): 30.1 minutes
For population 15 years and over in 28478:
Never married: 24.4%
Now married: 57.6%
Separated: 3.1%
Widowed: 5.9%
Divorced: 9.1%
Zip code 28478 compared to state average:
Median age significantly above state average.
Foreign-born population percentage significantly below state average.
Renting percentage significantly below state average.
Length of stay since moving in significantly above state average.
Percentage of population with a bachelor's degree or higher significantly below state average.
Averages for the 2020 tax year for zip code 28478, filed in 2021:
Average Adjusted Gross Income (AGI) in 2020: $44,329 (Individual Income Tax Returns)
Here:
$44,329
State:
$70,020
Salary/wage: $40,225 (reported on 80.1% of returns)
Here:
$40,225
State:
$58,387
(% of AGI for various income ranges: 1245.9% for AGIs below $25k, 3807.6% for AGIs $25k-50k, 7027.2% for AGIs $50k-75k, 8490.0% for AGIs $75k-100k, 21210.0% for AGIs $100k-200k)
Taxable interest for individuals: $854 (reported on 22.9% of returns)
This zip code:
$854
North Carolina:
$1,479
(% of AGI for various income ranges: 5.9% for AGIs below $25k, 11.0% for AGIs $25k-50k, 18.9% for AGIs $50k-75k, 20.8% for AGIs $75k-100k, 283.3% for AGIs $100k-200k)
Ordinary dividends: $2,164 (reported on 7.0% of returns)
Here:
$2,164
State:
$7,888
(% of AGI for various income ranges: 5.0% for AGIs below $25k, 6.6% for AGIs $25k-50k, 40.6% for AGIs $50k-75k, 193.3% for AGIs $100k-200k)
Net capital gain/loss in AGI: +$11,747 (reported on 7.5% of returns)
Here:
+$11,747
State:
+$23,652
(% of AGI for various income ranges: 4.3% for AGIs below $25k, 22.0% for AGIs $25k-50k, 71.7% for AGIs $50k-75k, 1686.7% for AGIs $100k-200k)
Profit/loss from business: +$7,591 (reported on 17.4% of returns)
Here:
+$7,591
State:
+$11,710
(% of AGI for various income ranges: 179.0% for AGIs below $25k, 169.5% for AGIs $25k-50k, 300.6% for AGIs $50k-75k, 260.0% for AGIs $75k-100k, 78.9% for AGIs $100k-200k)
Taxable individual retirement arrangement distribution: $12,225 (reported on 6.0% of returns)
28478:
$12,225
North Carolina:
$20,247
(% of AGI for various income ranges: 38.8% for AGIs below $25k, 78.3% for AGIs $25k-50k, 244.4% for AGIs $50k-75k, 534.4% for AGIs $100k-200k)
Total itemized deductions: $30,029 (reported on 3.5% of returns)
Here:
$30,029
State:
$34,549
(% of AGI for various income ranges: 562.2% for AGIs $50k-75k, 1211.1% for AGIs $100k-200k)
Charity contributions: $11,767 (reported on 3.0% of returns)
Here:
$11,767
State:
$13,360
(% of AGI for various income ranges: 137.8% for AGIs $50k-75k, 508.9% for AGIs $100k-200k)
Taxes paid: $5,686 (reported on 3.5% of returns)
28478:
$5,686
State:
$7,586
(% of AGI for various income ranges: 92.8% for AGIs $50k-75k, 256.7% for AGIs $100k-200k)
Earned income credit: $2,434 (reported on 24.9% of returns)
Here:
$2,434
State:
$2,337
(% of AGI for various income ranges: 149.5% for AGIs below $25k, 85.4% for AGIs $25k-50k)
Percentage of individuals using paid preparers for their 2020 taxes: 92.5%
Here:
93%
State:
93%
(% for various income ranges: 91.7% for AGIs below $25k, 90.9% for AGIs $25k-50k, 92.6% for AGIs $50k-75k, 93.8% for AGIs $75k-100k, 111.8% for AGIs $100k-200k, 0.0% for AGIs over 200k)
Averages for the 2012 tax year for zip code 28478, filed in 2013:
Average Adjusted Gross Income (AGI) in 2012: $37,124 (Individual Income Tax Returns)
Here:
$37,124
State:
$54,937
Salary/wage: $32,644 (reported on 85.3% of returns)
Here:
$32,644
State:
$46,336
(% of AGI for various income ranges: 76.1% for AGIs below $25k, 79.7% for AGIs $25k-50k, 75.4% for AGIs $50k-75k, 76.4% for AGIs $75k-100k, 65.4% for AGIs $100k-200k)
Taxable interest for individuals: $549 (reported on 24.6% of returns)
This zip code:
$549
North Carolina:
$1,298
(% of AGI for various income ranges: 0.6% for AGIs below $25k, 0.4% for AGIs $25k-50k, 0.2% for AGIs $50k-75k, 0.1% for AGIs $75k-100k, 0.4% for AGIs $100k-200k)
Ordinary dividends: $2,400 (reported on 7.3% of returns)
Here:
$2,400
State:
$6,213
(% of AGI for various income ranges: 0.8% for AGIs below $25k, 0.2% for AGIs $25k-50k, 0.5% for AGIs $50k-75k, 0.9% for AGIs $100k-200k)
Net capital gain/loss in AGI: +$215 (reported on 6.8% of returns)
Here:
+$215
State:
+$12,740
(% of AGI for various income ranges: 0.2% for AGIs $50k-75k, 0.2% for AGIs $100k-200k)
Profit/loss from business: +$6,814 (reported on 14.7% of returns)
Here:
+$6,814
State:
+$10,311
(% of AGI for various income ranges: 6.6% for AGIs below $25k, 2.2% for AGIs $25k-50k, 3.6% for AGIs $50k-75k, 1.3% for AGIs $75k-100k)
Taxable individual retirement arrangement distribution: $10,600 (reported on 5.8% of returns)
28478:
$10,600
North Carolina:
$15,575
(% of AGI for various income ranges: 1.7% for AGIs below $25k, 2.7% for AGIs $25k-50k, 4.1% for AGIs $75k-100k)
Total itemized deductions: $17,502 (26% of AGI, reported on 21.5% of returns)
Here:
$17,502
State:
$23,438
Here:
25.9% of AGI
State:
21.5% of AGI
(% of AGI for various income ranges: 7.0% for AGIs below $25k, 7.8% for AGIs $25k-50k, 9.4% for AGIs $50k-75k, 13.5% for AGIs $75k-100k, 14.8% for AGIs $100k-200k)
Charity contributions: $4,219 (reported on 16.8% of returns)
Here:
$4,219
State:
$4,687
(% of AGI for various income ranges: 0.9% for AGIs below $25k, 1.4% for AGIs $25k-50k, 1.6% for AGIs $50k-75k, 2.8% for AGIs $75k-100k, 3.2% for AGIs $100k-200k)
Taxes paid: $5,407 (reported on 21.5% of returns)
28478:
$5,407
State:
$8,823
(% of AGI for various income ranges: 1.1% for AGIs below $25k, 1.7% for AGIs $25k-50k, 2.7% for AGIs $50k-75k, 4.5% for AGIs $75k-100k, 6.6% for AGIs $100k-200k)
Earned income credit: $2,368 (reported on 26.2% of returns)
Here:
$2,368
State:
$2,376
(% of AGI for various income ranges: 7.8% for AGIs below $25k, 1.3% for AGIs $25k-50k)
Percentage of individuals using paid preparers for their 2012 taxes: 54.5%
Here:
54%
State:
53%
(% for various income ranges: 52.9% for AGIs below $25k, 52.5% for AGIs $25k-50k, 56.0% for AGIs $50k-75k, 63.6% for AGIs $75k-100k, 66.7% for AGIs $100k-200k)
Averages for the 2004 tax year for zip code 28478, filed in 2005:
Average Adjusted Gross Income (AGI) in 2004: $30,207 (Individual Income Tax Returns)
Here:
$30,207
State:
$45,376
Salary/wage: $27,888 (reported on 87.2% of returns)
Here:
$27,888
State:
$39,442
(% of AGI for various income ranges: 126.8% for AGIs below $10k, 82.6% for AGIs $10k-25k, 84.6% for AGIs $25k-50k, 80.2% for AGIs $50k-75k, 78.0% for AGIs $75k-100k, 55.5% for AGIs over 100k)
Taxable interest for individuals: $902 (reported on 30.1% of returns)
This zip code:
$902
North Carolina:
$1,515
(% of AGI for various income ranges: 5.1% for AGIs below $10k, 0.9% for AGIs $10k-25k, 0.7% for AGIs $25k-50k, 0.6% for AGIs $50k-75k, 0.5% for AGIs $75k-100k, 1.6% for AGIs over 100k)
Taxable dividends: $961 (reported on 8.9% of returns)
Here:
$961
State:
$4,016
(% of AGI for various income ranges: 0.6% for AGIs below $10k, 0.3% for AGIs $10k-25k, 0.1% for AGIs $25k-50k, 0.2% for AGIs $50k-75k, 0.1% for AGIs $75k-100k, 1.1% for AGIs over 100k)
Net capital gain/loss: +$3,333 (reported on 6.0% of returns)
Here:
+$3,333
State:
+$11,152
(% of AGI for various income ranges: 1.1% for AGIs below $10k, 0.6% for AGIs $10k-25k, 0.2% for AGIs $25k-50k, 0.5% for AGIs $50k-75k, 1.5% for AGIs $75k-100k, 1.8% for AGIs over 100k)
Profit/loss from business: +$7,551 (reported on 16.4% of returns)
Here:
+$7,551
State:
+$9,490
(% of AGI for various income ranges: 23.7% for AGIs below $10k, 4.7% for AGIs $10k-25k, 3.5% for AGIs $25k-50k, 2.4% for AGIs $50k-75k, 0.9% for AGIs $75k-100k, 8.1% for AGIs over 100k)
Profit/loss from farming: +$226 (reported on 3.1% of returns)
Here:
+$226
State:
-$3,231
(% of AGI for various income ranges: -0.2% for AGIs below $10k, 0.0% for AGIs $10k-25k, -0.0% for AGIs $25k-50k, 0.1% for AGIs $50k-75k)
IRA payment deduction: $2,640 (reported on 1.4% of returns)
28478:
$2,640
North Carolina:
$2,967
Total itemized deductions: $14,740 (28% of AGI, reported on 23.7% of returns)
Here:
$14,740
State:
$19,464
Here:
27.6% of AGI
State:
22.7% of AGI
(% of AGI for various income ranges: 7.4% for AGIs $10k-25k, 10.4% for AGIs $25k-50k, 15.3% for AGIs $50k-75k, 16.9% for AGIs $75k-100k, 11.1% for AGIs over 100k)
Charity contributions deductions: $3,203 (6% of AGI, reported on 20.7% of returns)
Here:
$3,203
State:
$4,035
Here:
6.0% of AGI
State:
4.5% of AGI
(% of AGI for various income ranges: 1.3% for AGIs $10k-25k, 2.0% for AGIs $25k-50k, 2.7% for AGIs $50k-75k, 3.4% for AGIs $75k-100k, 2.3% for AGIs over 100k)
Total tax: $3,420 (reported on 67.3% of returns)
28478:
$3,420
State:
$7,257
(% of AGI for various income ranges: 4.6% for AGIs below $10k, 3.1% for AGIs $10k-25k, 6.1% for AGIs $25k-50k, 8.5% for AGIs $50k-75k, 10.6% for AGIs $75k-100k, 16.6% for AGIs over 100k)
Earned income credit: $1,848 (reported on 28.0% of returns)
Here:
$1,848
State:
$1,851
Percentage of individuals using paid preparers for their 2004 taxes: 60.3%
Here:
60%
State:
62%
(% for various income ranges: 52.9% for AGIs below $10k, 62.9% for AGIs $10k-25k, 60.3% for AGIs $25k-50k, 62.9% for AGIs $50k-75k, 62.1% for AGIs $75k-100k, 75.0% for AGIs over 100k)
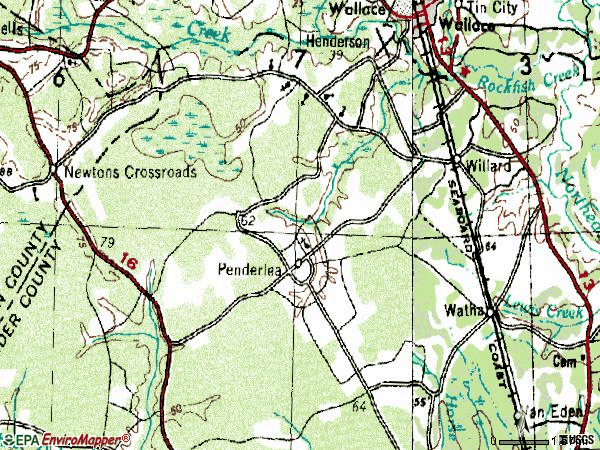
Churches in zip code 28478 include: Antioch Church (A), Wells Chapel (B), Mills Memorial Church (C), Canaan Church (D), Penile Church (E), Corinth Church (F), Penderlea Church (G), Newkirk Chapel (H), Rapture Church (I). Display/hide their locations on the map
Cemeteries: Walker Cemetery (1), Newkirk Cemetery (2), Riverview Memorial Park (3), Worrell Cemetery (4), Fryar Cemetery (5), Alderman Cemetery (6), White Cemetery (7). Display/hide their locations on the map
Streams, rivers, and creeks: Crooked Run (A), Bulltail Creek (B), Bee Branch (C), Keith Branch (D), Bear Den Branch (E), Horse Branch (F), Mill Creek (G), Red Bank Branch (H), Washington Creek (I). Display/hide their locations on the map
In group quarters: 13 (-1 institutionalized population)
Size of family households: 586 2-persons, 550 3-persons, 178 4-persons, 41 5-persons
Size of nonfamily households: 509 1-person, 28 2-persons, 44 3-persons
538 married couples with children.
247 single-parent households (1 men, 246 women).
94.9% of residents of 28478 zip code speak English at home.
4.7% of residents speak Spanish at home (40% very well, 1% well, 2% not well, 57% not at all).
Foreign born population: 153 (3.4%) (8.6% of them are naturalized citizens)
This zip code:
3.4%
Whole state:
8.6%
98%El Salvador
13%Guatemala
17%German
13%American
7%English
3%African
2%Italian
1%Irish
1%Scotch-Irish
Year of entry for the foreign-born population
1622010 or later
112000 to 2009
41990 to 1999
175Before 1990
Housing units lacking complete kitchen facilities: 2.4%
68.5%Electricity
24.7%Bottled, tank, or LP gas
4.9%Wood
1.7%Fuel oil, kerosene, etc.
Population in 1990: 2,456.
Place of birth for U.S.-born residents:
This state: 2,878
Northeast: 131
Midwest: 104
South: 779
West: 263
61% of the 28478 zip code residents lived in the same house 5 years ago. Out of people who lived in different houses, 48% lived in this county. Out of people who lived in different counties, 50% lived in North Carolina.
92% of the 28478 zip code residents lived in the same house 1 year ago. Out of people who lived in different houses, 45% moved from this county. Out of people who lived in different houses, 43% moved from different county within same state. Out of people who lived in different houses, 13% moved from different state.
Private vs. public school enrollment:
Students in private schools in grades 1 to 8 (elementary and middle school): 118
Here:
26.9%
North Carolina:
13.8%
Students in private schools in grades 9 to 12 (high school): 100
Here:
48.0%
North Carolina:
11.9%
Students in private undergraduate colleges:
Here:
0.0%
North Carolina:
19.3%
Occupation by median earnings in the past 12 months ($)
116,160Production occupations
64,728Installation, maintenance, and repair occupations
60,967Construction and extraction occupations
48,348Building and grounds cleaning and maintenance occupations
45,230Law enforcement workers including supervisors
42,801Office and administrative support occupations
Companies with federal contracts located in this zip code:
LEWIS FARMS OF BURGAW INC (6455 PINEY WOODS RD in WATHA, NC; small business) : $54,720 in 3 contractsfrom 2003 to 2004
$49,200 with Navy for Miscellaneous Items. Signed on 2003-05-21. Completion date: 2003-05-21.
$4,140 with Navy for Sewage Treatment Equipment. Signed on 2004-09-25. Completion date: 2004-09-13.
$1,380, same as above.Signed on 2004-09-30. Completion date: 2004-09-13.
Top industries in this zip code by the number of employees in 2005:
Other Services (except Public Administration): Religious Organizations (1-4 employees: 5 establishments)
Construction: Poured Concrete Foundation and Structure Contractors (5-9: 1, 1-4: 1)
Wholesale Trade: Home Furnishing Merchant Wholesalers (5-9: 1)
Construction: Land Subdivision (5-9: 1)
Construction: New Single-Family Housing Construction (except Operative Builders) (1-4: 2)
Health Care and Social Assistance: Ambulance Services (1-4: 1)
People in group quarters in 2010:
4 people in workers' group living quarters and job corps centers
2 people in group homes for juveniles (non-correctional)
People in group quarters in 2000:
5 people in nursing homes
4 people in other noninstitutional group quarters
Fatal accident statistics in 2013:
Fatal accident count: 3
Vehicles involved in fatal accidents: 5
Fatal accidents caused by drunken drivers: 2
Fatalities: 4
Persons involved in fatal accidents: 9
Pedestrians involved in fatal accidents: 0
Fatal accident statistics in 2011:
Fatal accident count: 2
Vehicles involved in fatal accidents: 2
Fatal accidents caused by drunken drivers: 2
Fatalities: 2
Persons involved in fatal accidents: 2
Pedestrians involved in fatal accidents: 0
Home Mortgage Disclosure Act Aggregated Statistics For Year 2009 (Based on 2 partial tracts)
A) FHA, FSA/RHS & VA Home Purchase Loans
B) Conventional Home Purchase Loans
C) Refinancings
D) Home Improvement Loans
F) Non-occupant Loans on < 5 Family Dwellings (A B C & D)
G) Loans On Manufactured Home Dwelling (A B C & D)
Number
Average Value
Number
Average Value
Number
Average Value
Number
Average Value
Number
Average Value
Number
Average Value
LOANS ORIGINATED
17
$126,256
3
$115,220
39
$176,017
5
$70,646
3
$202,717
9
$87,497
APPLICATIONS APPROVED, NOT ACCEPTED
0
$0
1
$75,610
5
$142,154
1
$5,400
1
$75,610
0
$0
APPLICATIONS DENIED
2
$121,525
2
$41,590
36
$123,353
2
$14,585
1
$68,050
8
$62,381
APPLICATIONS WITHDRAWN
0
$0
0
$0
25
$158,400
0
$0
1
$263,570
3
$58,330
FILES CLOSED FOR INCOMPLETENESS
0
$0
0
$0
9
$188,794
0
$0
0
$0
0
$0
Aggregated Statistics For Year 2008 (Based on 2 partial tracts)
A) FHA, FSA/RHS & VA Home Purchase Loans
B) Conventional Home Purchase Loans
C) Refinancings
D) Home Improvement Loans
F) Non-occupant Loans on < 5 Family Dwellings (A B C & D)
G) Loans On Manufactured Home Dwelling (A B C & D)
Number
Average Value
Number
Average Value
Number
Average Value
Number
Average Value
Number
Average Value
Number
Average Value
LOANS ORIGINATED
14
$121,831
16
$184,579
52
$121,979
5
$62,004
5
$76,910
14
$86,647
APPLICATIONS APPROVED, NOT ACCEPTED
0
$0
1
$41,050
9
$113,061
3
$73,093
1
$129,620
2
$71,835
APPLICATIONS DENIED
5
$120,334
17
$93,787
38
$133,206
9
$73,573
1
$20,520
11
$72,865
APPLICATIONS WITHDRAWN
1
$153,390
2
$141,505
10
$103,375
3
$72,013
0
$0
2
$73,455
FILES CLOSED FOR INCOMPLETENESS
0
$0
5
$160,086
6
$236,383
0
$0
0
$0
0
$0
Aggregated Statistics For Year 2007 (Based on 2 partial tracts)
A) FHA, FSA/RHS & VA Home Purchase Loans
B) Conventional Home Purchase Loans
C) Refinancings
D) Home Improvement Loans
F) Non-occupant Loans on < 5 Family Dwellings (A B C & D)
G) Loans On Manufactured Home Dwelling (A B C & D)
Number
Average Value
Number
Average Value
Number
Average Value
Number
Average Value
Number
Average Value
Number
Average Value
LOANS ORIGINATED
13
$114,085
40
$115,068
57
$118,879
15
$55,018
13
$106,774
24
$65,622
APPLICATIONS APPROVED, NOT ACCEPTED
1
$183,630
10
$95,274
8
$83,175
3
$9,723
4
$129,355
9
$77,534
APPLICATIONS DENIED
2
$125,845
25
$121,414
57
$106,314
23
$64,483
10
$149,284
23
$66,362
APPLICATIONS WITHDRAWN
0
$0
4
$107,480
24
$107,660
1
$150,150
4
$109,370
4
$66,972
FILES CLOSED FOR INCOMPLETENESS
0
$0
2
$141,505
6
$167,972
1
$118,820
0
$0
2
$64,270
Aggregated Statistics For Year 2006 (Based on 2 partial tracts)
A) FHA, FSA/RHS & VA Home Purchase Loans
B) Conventional Home Purchase Loans
C) Refinancings
D) Home Improvement Loans
F) Non-occupant Loans on < 5 Family Dwellings (A B C & D)
G) Loans On Manufactured Home Dwelling (A B C & D)
Number
Average Value
Number
Average Value
Number
Average Value
Number
Average Value
Number
Average Value
Number
Average Value
LOANS ORIGINATED
11
$116,465
37
$91,642
65
$103,849
9
$62,291
14
$100,999
23
$64,483
APPLICATIONS APPROVED, NOT ACCEPTED
0
$0
11
$119,902
9
$116,781
1
$34,570
1
$233,320
3
$117,743
APPLICATIONS DENIED
2
$62,650
19
$88,065
58
$94,015
19
$52,816
4
$101,270
28
$68,747
APPLICATIONS WITHDRAWN
1
$76,690
3
$136,827
26
$91,485
2
$99,920
0
$0
3
$92,177
FILES CLOSED FOR INCOMPLETENESS
1
$82,100
2
$66,970
4
$82,635
0
$0
0
$0
1
$82,100
Aggregated Statistics For Year 2005 (Based on 2 partial tracts)
A) FHA, FSA/RHS & VA Home Purchase Loans
B) Conventional Home Purchase Loans
C) Refinancings
D) Home Improvement Loans
F) Non-occupant Loans on < 5 Family Dwellings (A B C & D)
G) Loans On Manufactured Home Dwelling (A B C & D)
Number
Average Value
Number
Average Value
Number
Average Value
Number
Average Value
Number
Average Value
Number
Average Value
LOANS ORIGINATED
11
$100,262
46
$85,688
33
$100,917
9
$25,564
18
$59,531
18
$63,852
APPLICATIONS APPROVED, NOT ACCEPTED
2
$130,165
9
$66,492
6
$95,058
3
$32,407
0
$0
4
$75,345
APPLICATIONS DENIED
0
$0
27
$85,896
69
$89,297
14
$41,665
6
$129,623
28
$53,856
APPLICATIONS WITHDRAWN
0
$0
10
$89,765
22
$84,305
2
$55,090
1
$58,330
8
$60,761
FILES CLOSED FOR INCOMPLETENESS
0
$0
1
$89,660
6
$87,497
0
$0
1
$87,500
2
$73,995
Aggregated Statistics For Year 2004 (Based on 2 partial tracts)
A) FHA, FSA/RHS & VA Home Purchase Loans
B) Conventional Home Purchase Loans
C) Refinancings
D) Home Improvement Loans
F) Non-occupant Loans on < 5 Family Dwellings (A B C & D)
G) Loans On Manufactured Home Dwelling (A B C & D)
Detailed PMIC statistics for the following Tracts:9803.00
2003 - 2018 National Fire Incident Reporting System (NFIRS) incidents
According to the data from the years 2003 - 2018 the average number of fires per year is 12. The highest number of fire incidents - 32 took place in 2014, and the least - 1 in 2003. The data has a growing trend.
When looking into fire subcategories, the most incidents belonged to: Structure Fires (50.5%), and Outside Fires (30.1%).
Fire incident types reported to NFIRS in Zip Code 28478


+$226
-$3,231
(% of AGI for various income ranges: -0.2% for AGIs below $10k, 0.0% for AGIs $10k-25k, -0.0% for AGIs $25k-50k, 0.1% for AGIs $50k-75k)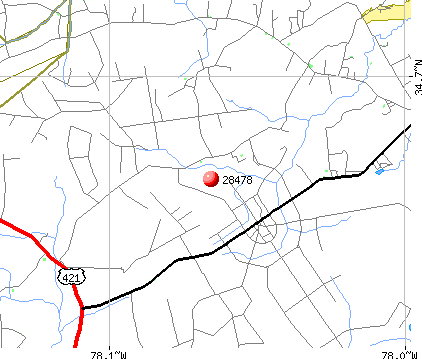 Nearest zip codes: 28464, 28425, 28458, 28421, 28466, 28447.


 : $54,720 in 3 contracts from 2003 to 2004


 According to the data from the years 2003 - 2018 the average number of fires per year is 12. The highest number of fire incidents - 32 took place in 2014, and the least - 1 in 2003. The data has a growing trend.
 When looking into fire subcategories, the most incidents belonged to: Structure Fires (50.5%), and Outside Fires (30.1%).