Estimated zip code population in 2022: 1,409 Zip code population in 2010: 1,502 Zip code population in 2000: 1,423
Houses and condos: 1,075 Renter-occupied apartments: 155
% of renters here:
21%
State:
33%
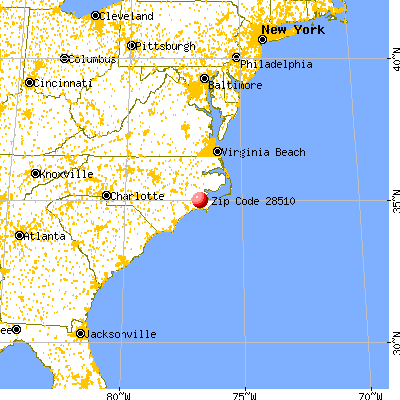
March 2022 cost of living index in zip code 28510: 83.5 (less than average, U.S. average is 100)
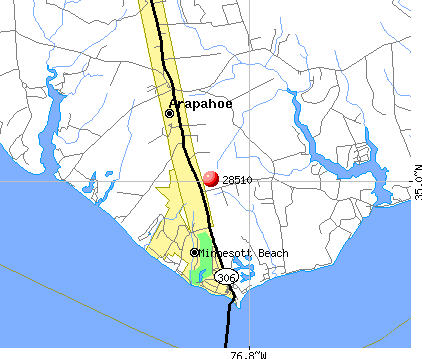
Land area: 20.7 sq. mi. Water area: 12.9 sq. mi.
Population density: 68 people per square mile
(very low).
OSM Map
General Map
Google Map
MSN Map
OSM Map
General Map
Google Map
MSN Map
OSM Map
General Map
Google Map
MSN Map
OSM Map
General Map
Google Map
MSN Map
Please wait while loading the map...
Real estate property taxes paid for housing units in 2022:
This zip code:
0.5% ($1,632)
North Carolina:
0.6% ($1,769)
Median real estate property taxes paid for housing units with mortgages in 2022: $1,920 (0.6%) Median real estate property taxes paid for housing units with no mortgage in 2022: $1,537 (0.5%)
Estimated median house/condo value in 2022: $321,812
28510:
$321,812
North Carolina:
$280,600
According to our research of North Carolina and other state lists, there was 1 registered sex offender living in 28510 zip code as of May 28, 2024. The ratio of all residents to sex offenders in zip code 28510 is 1,307 to 1. The ratio of registered sex offenders to all residents in this zip code is much lower than the state average.
Median resident age:
This zip code:
59.6 years
North Carolina median age:
39.2 years
Average household size:
This zip code:
2.0 people
North Carolina:
2.4 people
Averages for the 2020 tax year for zip code 28510, filed in 2021:
Average Adjusted Gross Income (AGI) in 2020: $66,616 (Individual Income Tax Returns)
Here:
$66,616
State:
$70,020
Salary/wage: $51,134 (reported on 65.8% of returns)
Here:
$51,134
State:
$58,387
(% of AGI for various income ranges: 932.0% for AGIs below $25k, 3224.2% for AGIs $25k-50k, 4781.2% for AGIs $50k-75k, 7558.0% for AGIs $75k-100k, 12530.0% for AGIs $100k-200k)
Taxable interest for individuals: $832 (reported on 44.7% of returns)
This zip code:
$832
North Carolina:
$1,479
(% of AGI for various income ranges: 13.3% for AGIs below $25k, 24.2% for AGIs $25k-50k, 120.0% for AGIs $50k-75k, 128.0% for AGIs $75k-100k, 71.7% for AGIs $100k-200k)
Ordinary dividends: $6,247 (reported on 25.0% of returns)
Here:
$6,247
State:
$7,888
(% of AGI for various income ranges: 52.0% for AGIs below $25k, 87.5% for AGIs $25k-50k, 220.0% for AGIs $50k-75k, 272.0% for AGIs $75k-100k, 1153.3% for AGIs $100k-200k)
Net capital gain/loss in AGI: +$8,494 (reported on 23.7% of returns)
Here:
+$8,494
State:
+$23,652
(% of AGI for various income ranges: 14.0% for AGIs below $25k, 59.2% for AGIs $25k-50k, 200.0% for AGIs $50k-75k, 76.0% for AGIs $75k-100k, 771.7% for AGIs $100k-200k)
Profit/loss from business: +$6,209 (reported on 14.5% of returns)
Here:
+$6,209
State:
+$11,710
(% of AGI for various income ranges: 117.3% for AGIs below $25k, 285.8% for AGIs $25k-50k, 217.5% for AGIs $50k-75k)
Taxable individual retirement arrangement distribution: $19,464 (reported on 14.5% of returns)
28510:
$19,464
North Carolina:
$20,247
(% of AGI for various income ranges: 274.2% for AGIs $25k-50k, 843.8% for AGIs $50k-75k, 1895.0% for AGIs $100k-200k)
Total itemized deductions: $34,000 (reported on 7.9% of returns)
Here:
$34,000
State:
$34,549
(% of AGI for various income ranges: 926.2% for AGIs $50k-75k, 2165.0% for AGIs $100k-200k)
Charity contributions: $8,500 (reported on 6.6% of returns)
Here:
$8,500
State:
$13,360
(% of AGI for various income ranges: 52.7% for AGIs below $25k, 576.7% for AGIs $100k-200k)
Taxes paid: $7,100 (reported on 7.9% of returns)
28510:
$7,100
State:
$7,586
(% of AGI for various income ranges: 176.2% for AGIs $50k-75k, 475.0% for AGIs $100k-200k)
Earned income credit: $1,840 (reported on 13.2% of returns)
Here:
$1,840
State:
$2,337
(% of AGI for various income ranges: 77.3% for AGIs below $25k, 56.7% for AGIs $25k-50k)
Percentage of individuals using paid preparers for their 2020 taxes: 92.1%
Here:
92%
State:
93%
(% for various income ranges: 90.5% for AGIs below $25k, 94.4% for AGIs $25k-50k, 92.3% for AGIs $50k-75k, 88.9% for AGIs $75k-100k, 91.7% for AGIs $100k-200k, 100.0% for AGIs over 200k)
Averages for the 2012 tax year for zip code 28510, filed in 2013:
Average Adjusted Gross Income (AGI) in 2012: $52,781 (Individual Income Tax Returns)
Here:
$52,781
State:
$54,937
Salary/wage: $39,062 (reported on 72.5% of returns)
Here:
$39,062
State:
$46,336
(% of AGI for various income ranges: 65.8% for AGIs below $25k, 59.3% for AGIs $25k-50k, 54.1% for AGIs $50k-75k, 52.5% for AGIs $75k-100k, 48.9% for AGIs $100k-200k)
Taxable interest for individuals: $1,038 (reported on 46.4% of returns)
This zip code:
$1,038
North Carolina:
$1,298
(% of AGI for various income ranges: 0.6% for AGIs below $25k, 0.9% for AGIs $25k-50k, 1.3% for AGIs $50k-75k, 1.2% for AGIs $75k-100k, 0.7% for AGIs $100k-200k)
Ordinary dividends: $4,022 (reported on 26.1% of returns)
Here:
$4,022
State:
$6,213
(% of AGI for various income ranges: 2.7% for AGIs below $25k, 1.4% for AGIs $25k-50k, 2.6% for AGIs $50k-75k, 2.1% for AGIs $75k-100k, 1.7% for AGIs $100k-200k)
Net capital gain/loss in AGI: +$3,073 (reported on 21.7% of returns)
Here:
+$3,073
State:
+$12,740
(% of AGI for various income ranges: 0.3% for AGIs $25k-50k, 0.6% for AGIs $50k-75k, 3.0% for AGIs $100k-200k)
Profit/loss from business: +$4,983 (reported on 17.4% of returns)
Here:
+$4,983
State:
+$10,311
(% of AGI for various income ranges: 7.5% for AGIs below $25k, 3.1% for AGIs $25k-50k, 1.4% for AGIs $50k-75k, 0.5% for AGIs $100k-200k)
Taxable individual retirement arrangement distribution: $12,355 (reported on 15.9% of returns)
28510:
$12,355
North Carolina:
$15,575
(% of AGI for various income ranges: 3.4% for AGIs $25k-50k, 5.6% for AGIs $50k-75k, 5.1% for AGIs $100k-200k)
Total itemized deductions: $21,375 (24% of AGI, reported on 34.8% of returns)
Here:
$21,375
State:
$23,438
Here:
24.1% of AGI
State:
21.5% of AGI
(% of AGI for various income ranges: 14.1% for AGIs below $25k, 11.7% for AGIs $25k-50k, 12.3% for AGIs $50k-75k, 13.5% for AGIs $75k-100k, 16.2% for AGIs $100k-200k)
Charity contributions: $3,200 (reported on 29.0% of returns)
Here:
$3,200
State:
$4,687
(% of AGI for various income ranges: 1.9% for AGIs $25k-50k, 1.3% for AGIs $50k-75k, 2.5% for AGIs $75k-100k, 2.0% for AGIs $100k-200k)
Taxes paid: $6,804 (reported on 33.3% of returns)
28510:
$6,804
State:
$8,823
(% of AGI for various income ranges: 1.6% for AGIs below $25k, 2.8% for AGIs $25k-50k, 3.4% for AGIs $50k-75k, 3.9% for AGIs $75k-100k, 6.1% for AGIs $100k-200k)
Earned income credit: $2,445 (reported on 15.9% of returns)
Here:
$2,445
State:
$2,376
(% of AGI for various income ranges: 6.6% for AGIs below $25k, 1.1% for AGIs $25k-50k)
Percentage of individuals using paid preparers for their 2012 taxes: 62.3%
Here:
62%
State:
53%
(% for various income ranges: 58.3% for AGIs below $25k, 52.9% for AGIs $25k-50k, 75.0% for AGIs $50k-75k, 57.1% for AGIs $75k-100k, 77.8% for AGIs $100k-200k)
Averages for the 2004 tax year for zip code 28510, filed in 2005:
Average Adjusted Gross Income (AGI) in 2004: $36,136 (Individual Income Tax Returns)
Here:
$36,136
State:
$45,376
Salary/wage: $28,940 (reported on 73.9% of returns)
Here:
$28,940
State:
$39,442
(% of AGI for various income ranges: 93.1% for AGIs below $10k, 66.4% for AGIs $10k-25k, 58.4% for AGIs $25k-50k, 62.1% for AGIs $50k-75k, 65.4% for AGIs $75k-100k, 43.4% for AGIs over 100k)
Taxable interest for individuals: $1,201 (reported on 46.8% of returns)
This zip code:
$1,201
North Carolina:
$1,515
(% of AGI for various income ranges: 4.5% for AGIs below $10k, 1.5% for AGIs $10k-25k, 2.1% for AGIs $25k-50k, 1.0% for AGIs $50k-75k, 0.7% for AGIs $75k-100k, 1.7% for AGIs over 100k)
Taxable dividends: $2,977 (reported on 23.3% of returns)
Here:
$2,977
State:
$4,016
(% of AGI for various income ranges: 2.5% for AGIs below $10k, 1.1% for AGIs $10k-25k, 2.2% for AGIs $25k-50k, 1.0% for AGIs $50k-75k, 1.1% for AGIs $75k-100k, 3.6% for AGIs over 100k)
Net capital gain/loss: +$5,054 (reported on 19.8% of returns)
Here:
+$5,054
State:
+$11,152
(% of AGI for various income ranges: -1.7% for AGIs below $10k, -0.7% for AGIs $10k-25k, 1.2% for AGIs $25k-50k, 0.3% for AGIs $50k-75k, 3.3% for AGIs $75k-100k, 10.3% for AGIs over 100k)
Profit/loss from business: +$8,348 (reported on 19.0% of returns)
Here:
+$8,348
State:
+$9,490
(% of AGI for various income ranges: 9.4% for AGIs below $10k, 10.1% for AGIs $10k-25k, 5.4% for AGIs $25k-50k, 1.7% for AGIs $50k-75k, 7.6% for AGIs $75k-100k)
IRA payment deduction: $3,600 (reported on 2.7% of returns)
28510:
$3,600
North Carolina:
$2,967
Total itemized deductions: $16,592 (26% of AGI, reported on 31.3% of returns)
Here:
$16,592
State:
$19,464
Here:
26.3% of AGI
State:
22.7% of AGI
(% of AGI for various income ranges: 13.3% for AGIs $10k-25k, 16.4% for AGIs $25k-50k, 13.7% for AGIs $50k-75k, 15.8% for AGIs $75k-100k, 14.2% for AGIs over 100k)
Charity contributions deductions: $2,976 (5% of AGI, reported on 28.1% of returns)
Here:
$2,976
State:
$4,035
Here:
4.7% of AGI
State:
4.5% of AGI
(% of AGI for various income ranges: 2.3% for AGIs $10k-25k, 2.4% for AGIs $25k-50k, 1.7% for AGIs $50k-75k, 3.4% for AGIs $75k-100k, 2.5% for AGIs over 100k)
Total tax: $4,899 (reported on 69.0% of returns)
28510:
$4,899
State:
$7,257
(% of AGI for various income ranges: 2.0% for AGIs below $10k, 4.1% for AGIs $10k-25k, 6.5% for AGIs $25k-50k, 9.7% for AGIs $50k-75k, 9.9% for AGIs $75k-100k, 16.5% for AGIs over 100k)
Earned income credit: $1,994 (reported on 23.7% of returns)
Here:
$1,994
State:
$1,851
Percentage of individuals using paid preparers for their 2004 taxes: 70.7%
Here:
71%
State:
62%
(% for various income ranges: 63.2% for AGIs below $10k, 73.2% for AGIs $10k-25k, 74.6% for AGIs $25k-50k, 70.4% for AGIs $50k-75k, 65.1% for AGIs $75k-100k, 77.1% for AGIs over 100k)
Household received Food Stamps/SNAP in the past 12 months: 78 Household did not receive Food Stamps/SNAP in the past 12 months: 642
Women who had a birth in the past 12 months: 8 (3 now married, 4 unmarried) Women who did not have a birth in the past 12 months: 155 (47 now married, 108 unmarried)
Housing units in zip code 28510 with a mortgage: 273 (36 second mortgage, 38 both second mortgage and home equity loan) Houses without a mortgage: 6
Median monthly owner costs for units with a mortgage: $1,714 Median monthly owner costs for units without a mortgage: $534
Residents with income below the poverty level in 2022:
This zip code:
15.7%
Whole state:
12.8%
Residents with income below 50% of the poverty level in 2022:
This zip code:
6.7%
Whole state:
6.8%
Median number of rooms in houses and condos:
Here:
5.5
State:
6.4
Median number of rooms in apartments:
Here:
4.9
State:
4.4
Notable locations in this zip code not listed on our city pages
Churches in zip code 28510 include: Mount Zion Church (A), Weeping Mary Church (B), Saint Matthews Church (C), Saint Stephens Church (D), Small Chapel (E), Bethany Christian Church (F), Arapahoe Free Will Baptist Church (G). Display/hide their locations on the map
Streams, rivers, and creeks: Deep Run (A), Gatlin Creek (B), Alligator Gut (C), Mill Creek (D), Tarkiln Creek (E), Smith Gut (F), Granny Gut (G), Fork Run (H). Display/hide their locations on the map
Size of family households: 310 2-persons, 104 3-persons, 21 4-persons, 15 5-persons
Size of nonfamily households: 231 1-person, 43 2-persons
32 married couples with children.
96 single-parent households (39 men, 57 women).
96.4% of residents of 28510 zip code speak English at home.
3.6% of residents speak Spanish at home (19% very well, 71% well, 10% not well).
0.5% of residents speak other Indo-European language at home (71% very well, 29% not well).
Foreign born population: 62 (4.4%) (39.0% of them are naturalized citizens)
This zip code:
4.4%
Whole state:
8.6%
66%Honduras
8%Sweden
6%Bulgaria
5%United Kingdom, excluding England and Scotland
3%France
3%Dominica
21%English
10%American
7%Irish
7%French
4%Scottish
4%Italian
3%German
Year of entry for the foreign-born population
42010 or later
312000 to 2009
71990 to 1999
26Before 1990
Facilities with environmental interests located in this zip code:
CAMP SEAFARER (2744 SEAFARER RD in ARAPAHOE, NC)
STATE MASTER (North Carolina facility info) - DRINKING WATER PROGRAM, STATE MASTER (North Carolina facility info) - DRINKING WATER PROGRAM, -66AN2CF000AJKD848WJU0F513B, WASTEWATER FACILITY, -NC0469430, DRINKING WATER PROGRAM National Pollutant Discharge Elimination System NON-MAJOR (Tracking pollutant discharge elimination systems) - permit Business SIC classification: SPORTING AND RECREATIONAL CAMPS; NONCLASSIFIABLE ESTABLISHMENTS Alternative names: CAMP SEAFARER #2, YMCA, YMCA- CAMP SEAFARER
ARAPAHOE CHARTER SCHOOL (9005 NC HWY 306 S in ARAPAHOE, NC)
STATE MASTER (North Carolina facility info) - -3M05FMYG00WTJDM4BDS4R15EBW, WASTEWATER PROGRAM, WASTEWATER FACILITY (National Center for Education Statistics) - STATE ID-0 Business SIC classification: NONCLASSIFIABLE ESTABLISHMENTS
ADAMS SAND MINE (9291 HWY 306 S in ARAPAHOE, NC)
National Pollutant Discharge Elimination System NON-MAJOR (Tracking pollutant discharge elimination systems) - permit Business SIC classification: CONSTRUCTION SAND AND GRAVEL
Housing units lacking complete plumbing facilities: 4.1% Housing units lacking complete kitchen facilities: 4.1%
78.3%Electricity
18.6%Bottled, tank, or LP gas
1.3%Wood
1.0%Utility gas
Population in 1990: 1,378. Population change in the 1990s: +45 (+3.3%).
Place of birth for U.S.-born residents:
This state: 731
Northeast: 292
Midwest: 112
South: 142
West: 56
72% of the 28510 zip code residents lived in the same house 5 years ago. Out of people who lived in different houses, 39% lived in this county. Out of people who lived in different counties, 50% lived in North Carolina.
96% of the 28510 zip code residents lived in the same house 1 year ago. Out of people who lived in different houses, 13% moved from this county. Out of people who lived in different houses, 91% moved from different county within same state. Out of people who lived in different houses, 15% moved from different state.
Private vs. public school enrollment:
Students in private schools in grades 1 to 8 (elementary and middle school):
Here:
0.0%
North Carolina:
13.8%
Students in private schools in grades 9 to 12 (high school):
Here:
0.0%
North Carolina:
11.9%
Students in private undergraduate colleges:
Here:
0.0%
North Carolina:
19.3%
Occupation by median earnings in the past 12 months ($)
127,680Architecture and engineering occupations
114,331Business and financial operations occupations
106,607Transportation occupations
78,369Computer and mathematical occupations
77,946Health diagnosing and treating practitioners and other technical occupations
51,737Installation, maintenance, and repair occupations
Companies with federal contracts located in this zip code:
CAHOON FARMS, INC (7099 KERSHAW RD in ARAPAHOE, NC; small business) : $318,197 in 9 contractsfrom 2002 to 2006
Contracts for Miscellaneous Construction Materials, Miscellaneous Prefabricated Structures, Pipe, Tube and Rigid Tubing, Nonwood Construction Lumber and Related Materials by U.S. Fish and Wildlife Service, Air Force Signed by year:2000: $0; 2001: $0; 2002: $30,000; 2003: $64,021; 2004: $0; 2005: $80,216; 2006: $143,960.
Biggest contracts:
$131,580 with U.S. Fish and Wildlife Service for Miscellaneous Construction Materials. Signed on 2006-09-08. Completion date: 2006-12-31.
$50,422 with U.S. Fish and Wildlife Service for Miscellaneous Prefabricated Structures. Taking place in ME. Signed on 2003-09-15. Completion date: 2003-10-15.
$35,303 with U.S. Fish and Wildlife Service for Miscellaneous Construction Materials. Signed on 2005-07-27. Completion date: 2005-09-30.
$34,914 with U.S. Fish and Wildlife Service for Pipe, Tube and Rigid Tubing. Signed on 2005-09-30. Completion date: 2005-10-31.
Top industries in this zip code by the number of employees in 2005:
Accommodation and Food Services: Recreational and Vacation Camps (except Campgrounds) (50-99 employees: 1 establishment, 20-49 employees: 1 establishment)
Educational Services: Elementary and Secondary Schools (50-99: 1)
Accommodation and Food Services: Full-Service Restaurants (10-19: 1)
Construction: New Single-Family Housing Construction (except Operative Builders) (5-9: 1, 1-4: 1)
Accommodation and Food Services: Food Service Contractors (5-9: 1, 1-4: 1)
Administrative and Support and Waste Management and Remediation Services: All Other Support Services (5-9: 1)
Arts, Entertainment, and Recreation: Golf Courses and Country Clubs (5-9: 1)
Arts, Entertainment, and Recreation: Marinas (5-9: 1)
People in group quarters in 2000:
8 people in agriculture workers' dormitories on farms
Fatal accident statistics in 2014:
Fatal accident count: 1
Vehicles involved in fatal accidents: 1
Fatal accidents caused by drunken drivers: 0
Fatalities: 1
Persons involved in fatal accidents: 1
Pedestrians involved in fatal accidents: 0
2003 - 2018 National Fire Incident Reporting System (NFIRS) incidents
According to the data from the years 2003 - 2018 the average number of fires per year is 13. The highest number of fire incidents - 41 took place in 2007, and the least - 3 in 2004. The data has a dropping trend.
When looking into fire subcategories, the most incidents belonged to: Outside Fires (50.0%), and Structure Fires (32.5%).
Fire incident types reported to NFIRS in Zip Code 28510


 Nearest zip codes: 28529, 28532, 28533, 28571, 28583, 28570.


 According to the data from the years 2003 - 2018 the average number of fires per year is 13. The highest number of fire incidents - 41 took place in 2007, and the least - 3 in 2004. The data has a dropping trend.
 When looking into fire subcategories, the most incidents belonged to: Outside Fires (50.0%), and Structure Fires (32.5%).