Estimated zip code population in 2022: 8,380 Zip code population in 2010: 9,488 Zip code population in 2000: 10,245
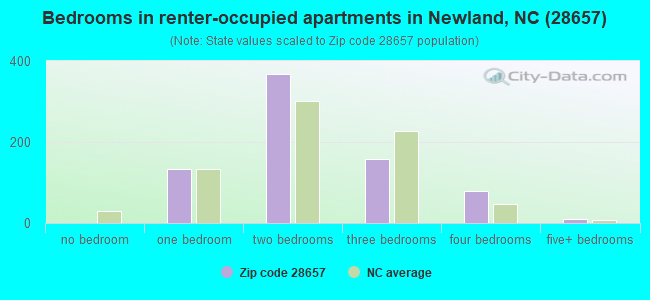
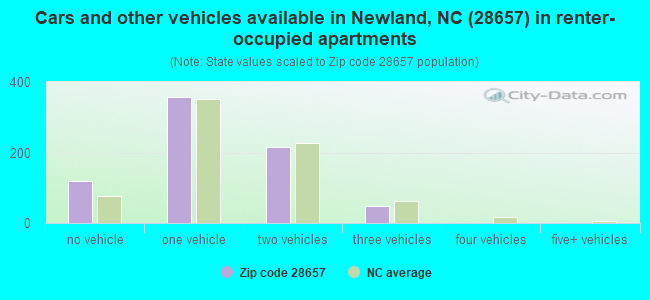
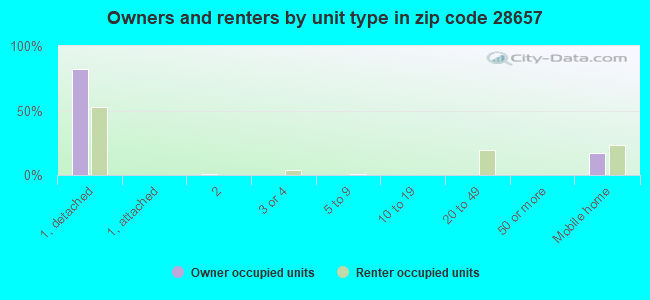
Houses and condos: 6,501 Renter-occupied apartments: 746
% of renters here:
20%
State:
33%
March 2022 cost of living index in zip code 28657: 81.0 (low, U.S. average is 100)
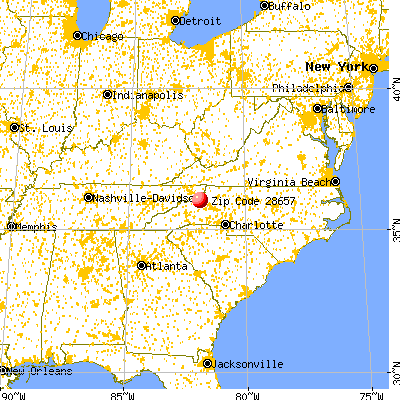
Land area: 159.8 sq. mi. Water area: 0.1 sq. mi.
Population density: 52 people per square mile
(very low).
OSM Map
General Map
Google Map
MSN Map
OSM Map
General Map
Google Map
MSN Map
OSM Map
General Map
Google Map
MSN Map
OSM Map
General Map
Google Map
MSN Map
Please wait while loading the map...
Real estate property taxes paid for housing units in 2022:
This zip code:
0.4% ($866)
North Carolina:
0.6% ($1,769)
Median real estate property taxes paid for housing units with mortgages in 2022: $1,059 (0.4%) Median real estate property taxes paid for housing units with no mortgage in 2022: $798 (0.3%)
Averages for the 2020 tax year for zip code 28657, filed in 2021:
Average Adjusted Gross Income (AGI) in 2020: $46,695 (Individual Income Tax Returns)
Here:
$46,695
State:
$70,020
Salary/wage: $40,064 (reported on 75.1% of returns)
Here:
$40,064
State:
$58,387
(% of AGI for various income ranges: 1175.9% for AGIs below $25k, 3572.5% for AGIs $25k-50k, 6437.7% for AGIs $50k-75k, 10174.4% for AGIs $75k-100k, 17351.3% for AGIs $100k-200k)
Taxable interest for individuals: $803 (reported on 30.7% of returns)
This zip code:
$803
North Carolina:
$1,479
(% of AGI for various income ranges: 21.6% for AGIs below $25k, 17.4% for AGIs $25k-50k, 60.6% for AGIs $50k-75k, 61.1% for AGIs $75k-100k, 108.7% for AGIs $100k-200k)
Ordinary dividends: $4,170 (reported on 14.4% of returns)
Here:
$4,170
State:
$7,888
(% of AGI for various income ranges: 31.0% for AGIs below $25k, 27.8% for AGIs $25k-50k, 115.5% for AGIs $50k-75k, 179.4% for AGIs $75k-100k, 598.7% for AGIs $100k-200k)
Net capital gain/loss in AGI: +$13,962 (reported on 16.3% of returns)
Here:
+$13,962
State:
+$23,652
(% of AGI for various income ranges: 27.5% for AGIs below $25k, 39.6% for AGIs $25k-50k, 232.3% for AGIs $50k-75k, 451.7% for AGIs $75k-100k, 1636.0% for AGIs $100k-200k)
Profit/loss from business: +$8,378 (reported on 21.4% of returns)
Here:
+$8,378
State:
+$11,710
(% of AGI for various income ranges: 259.0% for AGIs below $25k, 213.9% for AGIs $25k-50k, 252.3% for AGIs $50k-75k, 222.2% for AGIs $75k-100k, 869.3% for AGIs $100k-200k)
Taxable individual retirement arrangement distribution: $15,078 (reported on 10.7% of returns)
28657:
$15,078
North Carolina:
$20,247
(% of AGI for various income ranges: 70.0% for AGIs below $25k, 120.0% for AGIs $25k-50k, 325.2% for AGIs $50k-75k, 402.8% for AGIs $75k-100k, 1790.7% for AGIs $100k-200k)
Total itemized deductions: $30,577 (reported on 3.5% of returns)
Here:
$30,577
State:
$34,549
(% of AGI for various income ranges: 59.8% for AGIs below $25k, 296.5% for AGIs $50k-75k, 1040.7% for AGIs $100k-200k)
Charity contributions: $12,490 (reported on 2.7% of returns)
Here:
$12,490
State:
$13,360
(% of AGI for various income ranges: 80.6% for AGIs $50k-75k, 666.0% for AGIs $100k-200k)
Taxes paid: $6,142 (reported on 3.2% of returns)
28657:
$6,142
State:
$7,586
(% of AGI for various income ranges: 6.5% for AGIs below $25k, 41.9% for AGIs $50k-75k, 227.3% for AGIs $100k-200k)
Earned income credit: $2,162 (reported on 21.4% of returns)
Here:
$2,162
State:
$2,337
(% of AGI for various income ranges: 112.9% for AGIs below $25k, 79.1% for AGIs $25k-50k)
Percentage of individuals using paid preparers for their 2020 taxes: 94.7%
Here:
95%
State:
93%
(% for various income ranges: 92.9% for AGIs below $25k, 95.0% for AGIs $25k-50k, 95.8% for AGIs $50k-75k, 96.8% for AGIs $75k-100k, 97.0% for AGIs $100k-200k, 100.0% for AGIs over 200k)
Averages for the 2012 tax year for zip code 28657, filed in 2013:
Average Adjusted Gross Income (AGI) in 2012: $36,132 (Individual Income Tax Returns)
Here:
$36,132
State:
$54,937
Salary/wage: $30,680 (reported on 78.9% of returns)
Here:
$30,680
State:
$46,336
(% of AGI for various income ranges: 69.0% for AGIs below $25k, 73.8% for AGIs $25k-50k, 72.0% for AGIs $50k-75k, 68.5% for AGIs $75k-100k, 70.9% for AGIs $100k-200k)
Taxable interest for individuals: $1,235 (reported on 31.9% of returns)
This zip code:
$1,235
North Carolina:
$1,298
(% of AGI for various income ranges: 1.5% for AGIs below $25k, 0.8% for AGIs $25k-50k, 0.6% for AGIs $50k-75k, 0.8% for AGIs $75k-100k, 2.7% for AGIs $100k-200k)
Ordinary dividends: $2,807 (reported on 13.9% of returns)
Here:
$2,807
State:
$6,213
(% of AGI for various income ranges: 1.5% for AGIs below $25k, 0.8% for AGIs $25k-50k, 0.8% for AGIs $50k-75k, 0.7% for AGIs $75k-100k, 2.4% for AGIs $100k-200k)
Net capital gain/loss in AGI: +$9,743 (reported on 14.8% of returns)
Here:
+$9,743
State:
+$12,740
(% of AGI for various income ranges: 1.6% for AGIs below $25k, 1.2% for AGIs $25k-50k, 3.6% for AGIs $50k-75k, 4.5% for AGIs $75k-100k, 7.6% for AGIs $100k-200k, 14.4% for AGIs over 200k)
Profit/loss from business: +$6,963 (reported on 20.5% of returns)
Here:
+$6,963
State:
+$10,311
(% of AGI for various income ranges: 10.4% for AGIs below $25k, 4.7% for AGIs $25k-50k, 2.1% for AGIs $50k-75k, 1.6% for AGIs $75k-100k, 2.3% for AGIs $100k-200k)
Taxable individual retirement arrangement distribution: $11,212 (reported on 10.7% of returns)
28657:
$11,212
North Carolina:
$15,575
(% of AGI for various income ranges: 3.5% for AGIs below $25k, 2.6% for AGIs $25k-50k, 3.0% for AGIs $50k-75k, 4.2% for AGIs $75k-100k, 5.5% for AGIs $100k-200k)
Total itemized deductions: $19,878 (27% of AGI, reported on 18.9% of returns)
Here:
$19,878
State:
$23,438
Here:
26.6% of AGI
State:
21.5% of AGI
(% of AGI for various income ranges: 5.8% for AGIs below $25k, 7.9% for AGIs $25k-50k, 8.5% for AGIs $50k-75k, 13.8% for AGIs $75k-100k, 17.3% for AGIs $100k-200k, 16.1% for AGIs over 200k)
Charity contributions: $5,394 (reported on 15.5% of returns)
Here:
$5,394
State:
$4,687
(% of AGI for various income ranges: 0.8% for AGIs below $25k, 1.1% for AGIs $25k-50k, 1.9% for AGIs $50k-75k, 3.0% for AGIs $75k-100k, 4.5% for AGIs $100k-200k, 5.8% for AGIs over 200k)
Taxes paid: $4,952 (reported on 18.9% of returns)
28657:
$4,952
State:
$8,823
(% of AGI for various income ranges: 0.9% for AGIs below $25k, 1.3% for AGIs $25k-50k, 1.9% for AGIs $50k-75k, 4.0% for AGIs $75k-100k, 5.2% for AGIs $100k-200k, 5.8% for AGIs over 200k)
Earned income credit: $2,044 (reported on 25.6% of returns)
Here:
$2,044
State:
$2,376
(% of AGI for various income ranges: 6.4% for AGIs below $25k, 1.5% for AGIs $25k-50k)
Percentage of individuals using paid preparers for their 2012 taxes: 64.4%
Here:
64%
State:
53%
(% for various income ranges: 64.7% for AGIs below $25k, 59.3% for AGIs $25k-50k, 68.3% for AGIs $50k-75k, 68.4% for AGIs $75k-100k, 69.2% for AGIs $100k-200k, 100.0% for AGIs over 200k)
Averages for the 2004 tax year for zip code 28657, filed in 2005:
Average Adjusted Gross Income (AGI) in 2004: $31,818 (Individual Income Tax Returns)
Here:
$31,818
State:
$45,376
Salary/wage: $26,898 (reported on 80.8% of returns)
Here:
$26,898
State:
$39,442
(% of AGI for various income ranges: 82.2% for AGIs below $10k, 74.4% for AGIs $10k-25k, 79.1% for AGIs $25k-50k, 75.7% for AGIs $50k-75k, 58.4% for AGIs $75k-100k, 35.8% for AGIs over 100k)
Taxable interest for individuals: $1,945 (reported on 38.6% of returns)
This zip code:
$1,945
North Carolina:
$1,515
(% of AGI for various income ranges: 6.5% for AGIs below $10k, 2.5% for AGIs $10k-25k, 1.6% for AGIs $25k-50k, 1.5% for AGIs $50k-75k, 2.0% for AGIs $75k-100k, 4.2% for AGIs over 100k)
Taxable dividends: $3,394 (reported on 15.7% of returns)
Here:
$3,394
State:
$4,016
(% of AGI for various income ranges: 1.6% for AGIs below $10k, 1.3% for AGIs $10k-25k, 0.9% for AGIs $25k-50k, 1.0% for AGIs $50k-75k, 2.5% for AGIs $75k-100k, 3.9% for AGIs over 100k)
Net capital gain/loss: +$19,051 (reported on 16.4% of returns)
Here:
+$19,051
State:
+$11,152
(% of AGI for various income ranges: 1.4% for AGIs below $10k, 2.7% for AGIs $10k-25k, 4.4% for AGIs $25k-50k, 4.4% for AGIs $50k-75k, 9.6% for AGIs $75k-100k, 35.9% for AGIs over 100k)
Profit/loss from business: +$6,481 (reported on 20.4% of returns)
Here:
+$6,481
State:
+$9,490
(% of AGI for various income ranges: 14.2% for AGIs below $10k, 7.1% for AGIs $10k-25k, 3.7% for AGIs $25k-50k, 2.4% for AGIs $50k-75k, 0.4% for AGIs $75k-100k, 4.9% for AGIs over 100k)
IRA payment deduction: $3,238 (reported on 2.7% of returns)
28657:
$3,238
North Carolina:
$2,967
(% of AGI for various income ranges: 0.3% for AGIs $10k-25k, 0.3% for AGIs $25k-50k, 0.2% for AGIs $50k-75k, 0.8% for AGIs $75k-100k)
Total itemized deductions: $17,709 (28% of AGI, reported on 20.8% of returns)
Here:
$17,709
State:
$19,464
Here:
27.8% of AGI
State:
22.7% of AGI
(% of AGI for various income ranges: 8.9% for AGIs below $10k, 8.0% for AGIs $10k-25k, 8.3% for AGIs $25k-50k, 12.5% for AGIs $50k-75k, 19.6% for AGIs $75k-100k, 15.4% for AGIs over 100k)
Charity contributions deductions: $4,381 (6% of AGI, reported on 17.9% of returns)
Here:
$4,381
State:
$4,035
Here:
6.4% of AGI
State:
4.5% of AGI
(% of AGI for various income ranges: 0.6% for AGIs below $10k, 1.0% for AGIs $10k-25k, 1.7% for AGIs $25k-50k, 2.5% for AGIs $50k-75k, 4.5% for AGIs $75k-100k, 4.5% for AGIs over 100k)
Total tax: $3,480 (reported on 72.0% of returns)
28657:
$3,480
State:
$7,257
(% of AGI for various income ranges: 3.6% for AGIs below $10k, 4.0% for AGIs $10k-25k, 5.9% for AGIs $25k-50k, 8.0% for AGIs $50k-75k, 9.4% for AGIs $75k-100k, 15.2% for AGIs over 100k)
Earned income credit: $1,644 (reported on 20.9% of returns)
Here:
$1,644
State:
$1,851
Percentage of individuals using paid preparers for their 2004 taxes: 67.8%
Here:
68%
State:
62%
(% for various income ranges: 62.8% for AGIs below $10k, 70.3% for AGIs $10k-25k, 67.1% for AGIs $25k-50k, 63.4% for AGIs $50k-75k, 77.7% for AGIs $75k-100k, 87.1% for AGIs over 100k)
Likely homosexual households (counted as self-reported same-sex unmarried-partner households)
Lesbian couples: 0.1% of all households
Gay men: 0.0% of all households
Household received Food Stamps/SNAP in the past 12 months: 406 Household did not receive Food Stamps/SNAP in the past 12 months: 3,390
Women who had a birth in the past 12 months: 83 (74 now married, 9 unmarried) Women who did not have a birth in the past 12 months: 1,483 (922 now married, 566 unmarried)
Housing units in zip code 28657 with a mortgage: 1,432 (155 second mortgage, 163 both second mortgage and home equity loan) Houses without a mortgage: 57
Median monthly owner costs for units with a mortgage: $1,123 Median monthly owner costs for units without a mortgage: $356
Residents with income below the poverty level in 2022:
This zip code:
10.5%
Whole state:
12.8%
Residents with income below 50% of the poverty level in 2022:
This zip code:
3.8%
Whole state:
6.8%
Median number of rooms in houses and condos:
Here:
5.9
State:
6.4
Median number of rooms in apartments:
Here:
4.6
State:
4.4
Notable locations in this zip code not listed on our city pages
Churches in zip code 28657 include: Oak Grove Church (A), Aaron Church (B), New Cross Church (C), Mount Pleasant Church (D), Ashley Chapel (E), Midway Church (F), McCoury Rock Church (G), Long Ridge Church (H), Little Plumtree Church (I). Display/hide their locations on the map
Cemeteries: Ledford Cemetery (1), Jones Cemetery (2), Johnson Cemetery (3), Benfield Cemetery (4), Ingram Cemetery (5), Hughes Cemetery (6), Houston Cemetery (7). Display/hide their locations on the map
In group quarters: 106 (-1 institutionalized population)
Size of family households: 1,501 2-persons, 300 3-persons, 408 4-persons, 235 5-persons, 8 6-persons, 22 7-or-more-persons
Size of nonfamily households: 1,221 1-person, 108 2-persons
1,081 married couples with children.
153 single-parent households (37 men, 116 women).
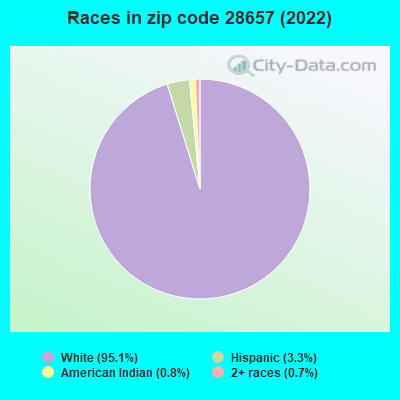
97.7% of residents of 28657 zip code speak English at home.
2.1% of residents speak Spanish at home (53% very well, 19% well, 16% not well, 12% not at all).
0.3% of residents speak other Indo-European language at home (85% very well, 15% well).
0.1% of residents speak Asian or Pacific Island language at home (100% very well).
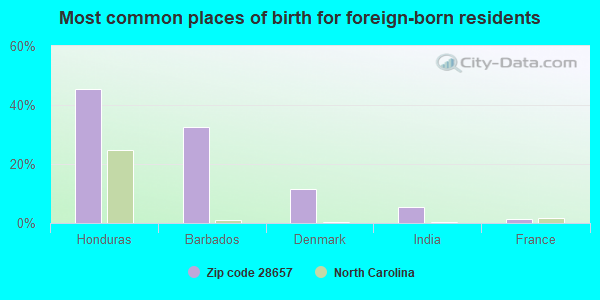
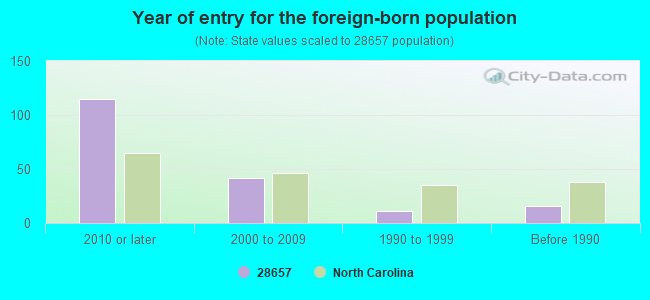
Foreign born population: 131 (1.6%) (35.3% of them are naturalized citizens)
This zip code:
1.6%
Whole state:
8.6%
45%Honduras
33%Barbados
11%Denmark
5%India
2%France
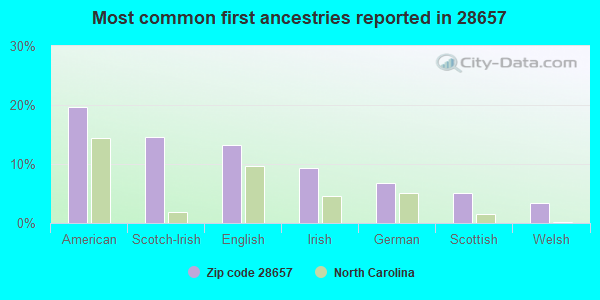
20%American
15%Scotch-Irish
13%English
9%Irish
7%German
5%Scottish
3%Welsh
Year of entry for the foreign-born population
1152010 or later
422000 to 2009
111990 to 1999
16Before 1990
Facilities with environmental interests located in this zip code:
AVERY COUNTY MIDDLE SCHOOL (102 MONTEZUMA ROAD in NEWLAND, NC)
STATE MASTER (North Carolina facility info) - UNDERGROUND STORAGE TANK PROGRAM STATE MASTER (North Carolina facility info) - DRINKING WATER PROGRAM (National Center for Education Statistics) - STATE ID-318 Business SIC classification: NONCLASSIFIABLE ESTABLISHMENTS Organizations: AVERY COUNTY SCHOOLS (SCHOOL DISTRICT)
Alternative names: AVERY MIDDLE
AVERY COUNTY HIGH SCHOOL (401 HIGH SCHOOL ROAD in NEWLAND, NC)
(Geographic Names Information System) STATE MASTER (North Carolina facility info) - UNDERGROUND STORAGE TANK PROGRAM, DRINKING WATER PROGRAM (National Center for Education Statistics) - STATE ID-302 Business SIC classification: NONCLASSIFIABLE ESTABLISHMENTS Organizations: AVERY COUNTY SCHOOLS (SCHOOL DISTRICT)
BANNERS CABINETS INCORPORATED (WATAUGA ST in NEWLAND, NC)
AIR MINOR (AIRS/AFS) STATE MASTER (North Carolina facility info) - AIR PROGRAM, -66AN2CF0005EKDA489NTR4B664, WASTEWATER FACILITY, -4958, HAZARDOUS WASTE PROGRAM Conditionally Exempt Small Quantity Generators, less than 100 kg/month of hazardous waste (Resource Conservation and Recovery Act (tracking hazardous waste)) - notification Business SIC classification: WOOD KITCHEN CABINETS; WOOD PRODUCTS; NONCLASSIFIABLE ESTABLISHMENTS Organizations: JOSEPH BANNER (CONTACT/OWNER)
Alternative names: BANNER'S CABINETE INC
AVERY DEVELOPMENT CORPORATION (MOUNTAIN GLEN RESORT in NEWLAND, NC)
STATE MASTER (North Carolina facility info) - -115DA4YG00M29W84AY3WG7ENGA, WASTEWATER FACILITY National Pollutant Discharge Elimination System NON-MAJOR (Tracking pollutant discharge elimination systems) - permit Business SIC classification: SEWERAGE SYSTEMS
CARPENTER, JOHNNY - RESIDENCE (ROUTE 1, BOX 186 in NEWLAND, NC)
STATE MASTER (North Carolina facility info) - -115DA4YG00M69W84AY3YG80DHQ, WASTEWATER FACILITY National Pollutant Discharge Elimination System NON-MAJOR (Tracking pollutant discharge elimination systems) - permit Business SIC classification: SEWERAGE SYSTEMS
BLUE RIDGE YOUTH CENTER WWTP (COUNTY RD 1110 in VALLEY, NC)
National Pollutant Discharge Elimination System NON-MAJOR (Tracking pollutant discharge elimination systems) - permit National Pollutant Discharge Elimination System NON-MAJOR (Tracking pollutant discharge elimination systems) - permit Business SIC classification: CORRECTIONAL INSTITUTIONS Alternative names: NC DEPARTMENT OF CORRECTION AV, NC DEPARTMENT OF CORRECTION BL, NC DOC - AVERY CORRECTIONAL, NC DOC-BLUE RIDGE YOUTH CENTER
AVERY COUNTY (3070 NEWLAND HWY in LINVILLE, NC)
(Resource Conservation and Recovery Act (tracking hazardous waste)) Organizations: COUNTY OF AVERY (CONTACT/OWNER)
CLARK STONE COMPANY (NC HIGHWAY 181 in NEWLAND, NC)
AIR MINOR (AIRS/AFS) Business SIC classification: CRUSHED AND BROKEN GRANITE
CARLOS & SONS BODY SHOP (HWY 194 in NEWLAND, NC)
Conditionally Exempt Small Quantity Generators, less than 100 kg/month of hazardous waste (Resource Conservation and Recovery Act (tracking hazardous waste)) - notification Organizations: CARLOS CALHOON (CONTACT/OWNER)
Housing units lacking complete plumbing facilities: 1.5% Housing units lacking complete kitchen facilities: 0.5%
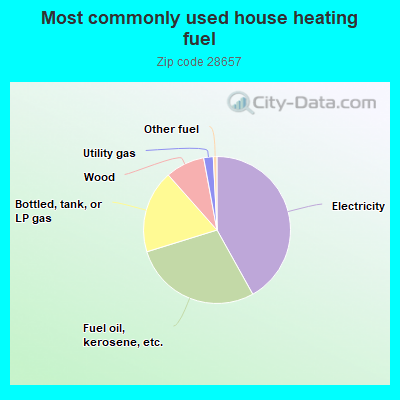
41.8%Electricity
28.2%Fuel oil, kerosene, etc.
18.2%Bottled, tank, or LP gas
8.6%Wood
2.1%Utility gas
0.8%Other fuel
Population in 1990: 8,906. Population change in the 1990s: +1,339 (+15.0%).
Place of birth for U.S.-born residents:
This state: 5,762
Northeast: 265
Midwest: 470
South: 1,404
West: 228
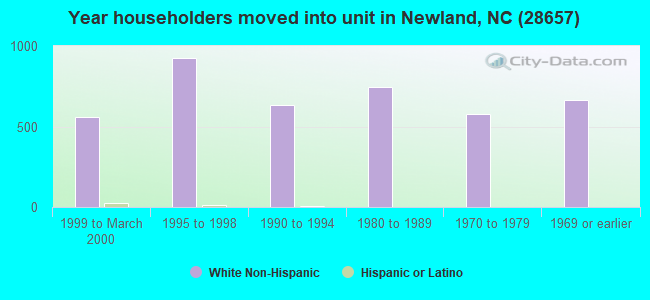
66% of the 28657 zip code residents lived in the same house 5 years ago. Out of people who lived in different houses, 46% lived in this county. Out of people who lived in different counties, 50% lived in North Carolina.
95% of the 28657 zip code residents lived in the same house 1 year ago. Out of people who lived in different houses, 28% moved from this county. Out of people who lived in different houses, 22% moved from different county within same state. Out of people who lived in different houses, 58% moved from different state. Out of people who lived in different houses, 6% moved from abroad.
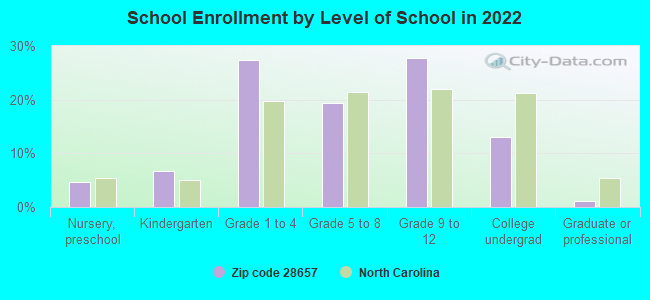
Private vs. public school enrollment:
Students in private schools in grades 1 to 8 (elementary and middle school): 160
Here:
28.0%
North Carolina:
13.8%
Students in private schools in grades 9 to 12 (high school): 45
Here:
13.7%
North Carolina:
11.9%
Students in private undergraduate colleges: 56
Here:
35.7%
North Carolina:
19.3%
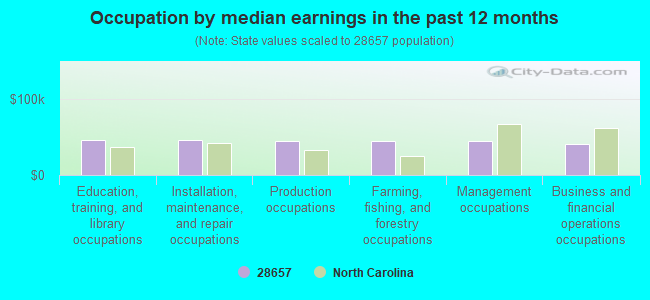
Occupation by median earnings in the past 12 months ($)
46,162Education, training, and library occupations
45,982Installation, maintenance, and repair occupations
44,544Production occupations
44,462Farming, fishing, and forestry occupations
44,355Management occupations
40,381Business and financial operations occupations
Companies with federal contracts located in this zip code:
CORNERSTONE DESIGNS INC (1021 OLD JONAS RIDGE ROAD in NEWLAND, NC; small business) : $449,776 in 4 contractsfrom 2005 to 2006
$347,556 with Army for Construction of Structures and Facilities -- Recreation Facilities (Non-Building). Signed on 2005-12-21. Completion date: 2006-01-31.
$77,000, same as above.Signed on 2006-03-03. Completion date: 2006-01-31.
$22,000 with Army for Administrative and Service Buildings. Signed on 2006-02-14. Completion date: 2006-03-31.
$3,220 with Army for Lectures For Training. Taking place in TN. Signed on 2005-08-16. Completion date: 2005-07-29.
Top industries in this zip code by the number of employees in 2005:
Health Care and Social Assistance: Home Health Care Services (100-249 employees: 1 establishment, 20-49 employees: 1 establishment, 10-19 employees: 1 establishment)
Construction: New Single-Family Housing Construction (except Operative Builders) (10-19: 2, 5-9: 5, 1-4: 5)
Other Services (except Public Administration): Religious Organizations (5-9: 2, 1-4: 11)
Construction: Plumbing, Heating, and Air-Conditioning Contractors (20-49: 1, 1-4: 1)
People in group quarters in 2010:
30 people in local jails and other municipal confinement facilities
29 people in workers' group living quarters and job corps centers
8 people in group homes intended for adults
People in group quarters in 2000:
73 people in agriculture workers' dormitories on farms
60 people in state prisons
44 people in other noninstitutional group quarters
36 people in nursing homes
5 people in local jails and other confinement facilities (including police lockups)
5 people in homes for the mentally retarded
Fatal accident statistics in 2013:
Fatal accident count: 2
Vehicles involved in fatal accidents: 3
Fatal accidents caused by drunken drivers: 1
Fatalities: 2
Persons involved in fatal accidents: 7
Pedestrians involved in fatal accidents: 0
Fatal accident statistics in 2012:
Fatal accident count: 1
Vehicles involved in fatal accidents: 1
Fatal accidents caused by drunken drivers: 0
Fatalities: 1
Persons involved in fatal accidents: 1
Pedestrians involved in fatal accidents: 0
Home Mortgage Disclosure Act Aggregated Statistics For Year 2009 (Based on 2 partial tracts)
A) FHA, FSA/RHS & VA Home Purchase Loans
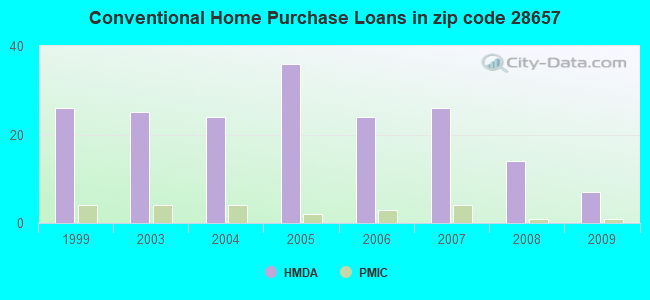
B) Conventional Home Purchase Loans
C) Refinancings
D) Home Improvement Loans
F) Non-occupant Loans on < 5 Family Dwellings (A B C & D)
G) Loans On Manufactured Home Dwelling (A B C & D)
Number
Average Value
Number
Average Value
Number
Average Value
Number
Average Value
Number
Average Value
Number
Average Value
LOANS ORIGINATED
5
$123,360
7
$218,631
49
$181,599
4
$110,532
12
$283,850
3
$72,117
APPLICATIONS APPROVED, NOT ACCEPTED
0
$0
1
$83,350
3
$122,613
1
$36,960
1
$104,010
2
$35,695
APPLICATIONS DENIED
1
$167,790
3
$83,110
15
$182,722
2
$28,630
2
$107,635
4
$54,722
APPLICATIONS WITHDRAWN
0
$0
0
$0
9
$196,541
0
$0
2
$112,345
0
$0
FILES CLOSED FOR INCOMPLETENESS
0
$0
0
$0
4
$239,818
0
$0
0
$0
1
$44,940
Aggregated Statistics For Year 2008 (Based on 2 partial tracts)
A) FHA, FSA/RHS & VA Home Purchase Loans
B) Conventional Home Purchase Loans
C) Refinancings
D) Home Improvement Loans
F) Non-occupant Loans on < 5 Family Dwellings (A B C & D)
G) Loans On Manufactured Home Dwelling (A B C & D)
Number
Average Value
Number
Average Value
Number
Average Value
Number
Average Value
Number
Average Value
Number
Average Value
LOANS ORIGINATED
4
$98,755
14
$208,018
30
$159,299
2
$59,435
14
$213,324
3
$75,863
APPLICATIONS APPROVED, NOT ACCEPTED
0
$0
0
$0
1
$181,920
1
$20,290
1
$49,290
1
$40,950
APPLICATIONS DENIED
1
$102,920
2
$321,990
21
$136,055
5
$29,716
3
$240,753
6
$86,432
APPLICATIONS WITHDRAWN
0
$0
1
$206,210
8
$151,619
1
$51,100
1
$247,520
1
$95,670
FILES CLOSED FOR INCOMPLETENESS
0
$0
0
$0
3
$190,020
0
$0
0
$0
1
$54,000
Aggregated Statistics For Year 2007 (Based on 2 partial tracts)
A) FHA, FSA/RHS & VA Home Purchase Loans
B) Conventional Home Purchase Loans
C) Refinancings
D) Home Improvement Loans
F) Non-occupant Loans on < 5 Family Dwellings (A B C & D)
G) Loans On Manufactured Home Dwelling (A B C & D)
Number
Average Value
Number
Average Value
Number
Average Value
Number
Average Value
Number
Average Value
Number
Average Value
LOANS ORIGINATED
3
$128,170
26
$215,698
45
$156,074
6
$70,305
13
$325,379
8
$70,804
APPLICATIONS APPROVED, NOT ACCEPTED
0
$0
1
$89,880
11
$88,557
2
$16,670
1
$55,810
0
$0
APPLICATIONS DENIED
0
$0
5
$225,196
28
$96,101
3
$77,190
1
$78,640
5
$76,104
APPLICATIONS WITHDRAWN
0
$0
3
$420,627
12
$158,158
1
$82,260
1
$557,010
2
$69,220
FILES CLOSED FOR INCOMPLETENESS
0
$0
1
$132,280
2
$113,975
0
$0
0
$0
0
$0
Aggregated Statistics For Year 2006 (Based on 2 partial tracts)
A) FHA, FSA/RHS & VA Home Purchase Loans
B) Conventional Home Purchase Loans
C) Refinancings
D) Home Improvement Loans
F) Non-occupant Loans on < 5 Family Dwellings (A B C & D)
G) Loans On Manufactured Home Dwelling (A B C & D)
Number
Average Value
Number
Average Value
Number
Average Value
Number
Average Value
Number
Average Value
Number
Average Value
LOANS ORIGINATED
1
$125,750
24
$130,690
38
$130,903
6
$34,850
15
$151,121
9
$54,762
APPLICATIONS APPROVED, NOT ACCEPTED
0
$0
4
$88,878
10
$112,996
1
$35,150
3
$147,980
5
$59,144
APPLICATIONS DENIED
1
$75,740
7
$104,474
27
$92,734
2
$46,205
2
$157,645
6
$72,722
APPLICATIONS WITHDRAWN
0
$0
2
$199,140
16
$107,338
1
$56,170
0
$0
1
$39,860
FILES CLOSED FOR INCOMPLETENESS
0
$0
1
$293,910
5
$137,856
0
$0
0
$0
0
$0
Aggregated Statistics For Year 2005 (Based on 2 partial tracts)
A) FHA, FSA/RHS & VA Home Purchase Loans
B) Conventional Home Purchase Loans
C) Refinancings
D) Home Improvement Loans
F) Non-occupant Loans on < 5 Family Dwellings (A B C & D)
G) Loans On Manufactured Home Dwelling (A B C & D)
Number
Average Value
Number
Average Value
Number
Average Value
Number
Average Value
Number
Average Value
Number
Average Value
LOANS ORIGINATED
3
$86,250
36
$212,084
38
$113,813
5
$56,896
16
$250,169
10
$53,526
APPLICATIONS APPROVED, NOT ACCEPTED
0
$0
4
$87,700
8
$97,305
1
$46,390
1
$90,960
3
$50,373
APPLICATIONS DENIED
0
$0
7
$66,371
36
$92,452
7
$35,826
2
$83,350
8
$54,722
APPLICATIONS WITHDRAWN
0
$0
14
$140,326
18
$104,109
1
$222,150
2
$267,815
2
$75,380
FILES CLOSED FOR INCOMPLETENESS
0
$0
1
$137,350
4
$144,508
0
$0
1
$158,370
0
$0
Aggregated Statistics For Year 2004 (Based on 2 partial tracts)
A) FHA, FSA/RHS & VA Home Purchase Loans
B) Conventional Home Purchase Loans
C) Refinancings
D) Home Improvement Loans
F) Non-occupant Loans on < 5 Family Dwellings (A B C & D)
G) Loans On Manufactured Home Dwelling (A B C & D)
Number
Average Value
Number
Average Value
Number
Average Value
Number
Average Value
Number
Average Value
Number
Average Value
LOANS ORIGINATED
1
$116,330
24
$143,918
40
$124,629
3
$43,247
9
$164,489
7
$55,551
APPLICATIONS APPROVED, NOT ACCEPTED
0
$0
6
$56,655
6
$103,103
0
$0
1
$68,490
3
$57,140
APPLICATIONS DENIED
0
$0
11
$98,573
24
$92,790
2
$18,845
3
$68,373
10
$70,487
APPLICATIONS WITHDRAWN
0
$0
2
$117,055
13
$124,945
0
$0
1
$184,100
1
$86,610
FILES CLOSED FOR INCOMPLETENESS
0
$0
0
$0
4
$111,258
0
$0
0
$0
0
$0
Aggregated Statistics For Year 2003 (Based on 2 partial tracts)
A) FHA, FSA/RHS & VA Home Purchase Loans
B) Conventional Home Purchase Loans
C) Refinancings
D) Home Improvement Loans
F) Non-occupant Loans on < 5 Family Dwellings (A B C & D)
Number
Average Value
Number
Average Value
Number
Average Value
Number
Average Value
Number
Average Value
LOANS ORIGINATED
1
$73,200
25
$135,668
86
$127,063
2
$14,860
14
$166,989
APPLICATIONS APPROVED, NOT ACCEPTED
0
$0
7
$87,027
14
$115,476
1
$38,780
1
$161,270
APPLICATIONS DENIED
0
$0
15
$56,897
25
$100,631
3
$14,133
2
$99,115
APPLICATIONS WITHDRAWN
0
$0
2
$94,770
9
$100,466
0
$0
1
$77,550
FILES CLOSED FOR INCOMPLETENESS
0
$0
0
$0
4
$100,022
0
$0
0
$0
Aggregated Statistics For Year 1999 (Based on 1 partial tract)
A) FHA, FSA/RHS & VA Home Purchase Loans
B) Conventional Home Purchase Loans
C) Refinancings
D) Home Improvement Loans
F) Non-occupant Loans on < 5 Family Dwellings (A B C & D)
Detailed PMIC statistics for the following Tracts:0202.01
2002 - 2018 National Fire Incident Reporting System (NFIRS) incidents
Based on the data from the years 2002 - 2018 the average number of fire incidents per year is 46. The highest number of fire incidents - 95 took place in 2015, and the least - 12 in 2003. The data has a growing trend.
When looking into fire subcategories, the most reports belonged to: Structure Fires (60.0%), and Outside Fires (27.4%).
Fire incident types reported to NFIRS in Zip Code 28657


 Nearest zip codes: 28616, 28662, 28652, 28647, 28646, 28622.
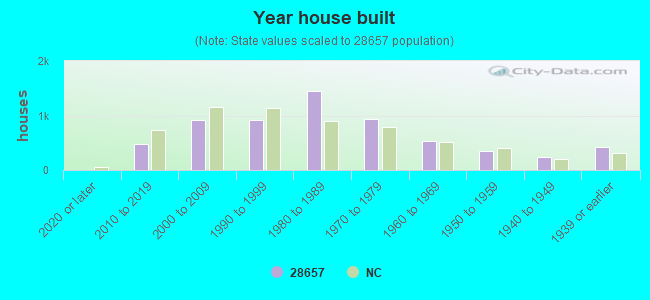


 Based on the data from the years 2002 - 2018 the average number of fire incidents per year is 46. The highest number of fire incidents - 95 took place in 2015, and the least - 12 in 2003. The data has a growing trend.
 When looking into fire subcategories, the most reports belonged to: Structure Fires (60.0%), and Outside Fires (27.4%).