Estimated zip code population in 2022: 1,487 Zip code population in 2010: 1,129 Zip code population in 2000: 860
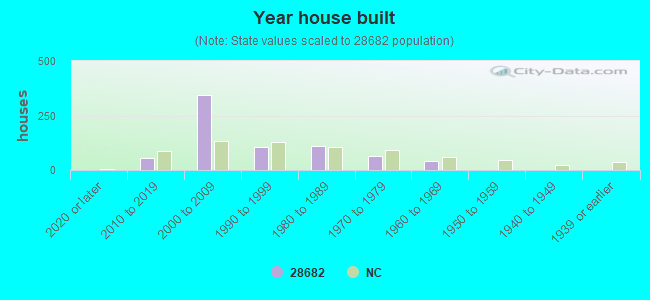
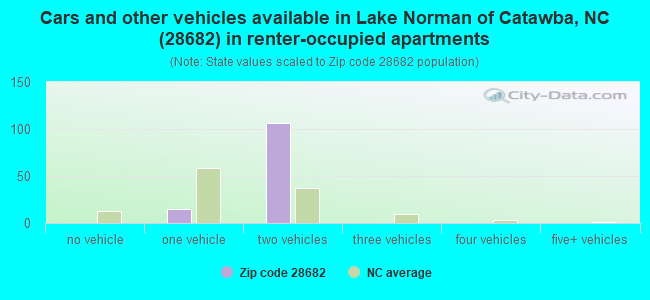
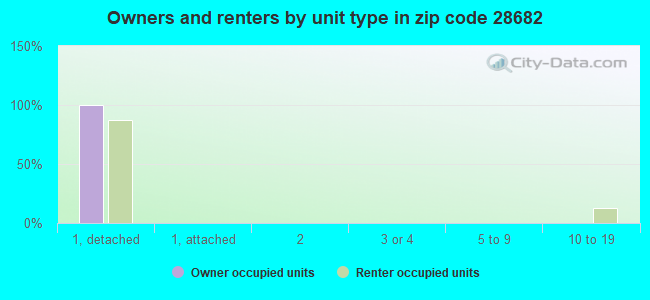
Houses and condos: 720 Renter-occupied apartments: 120
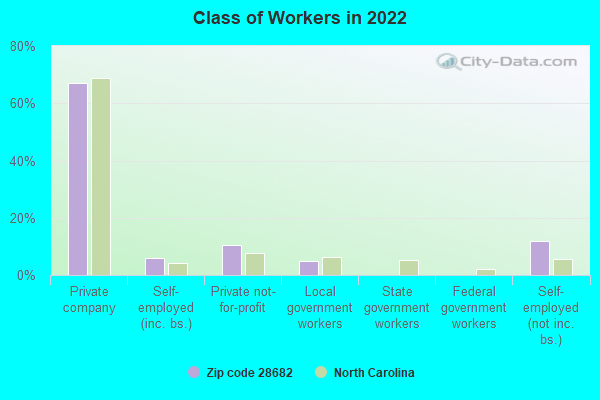
% of renters here:
20%
State:
33%
March 2022 cost of living index in zip code 28682: 85.3 (less than average, U.S. average is 100)
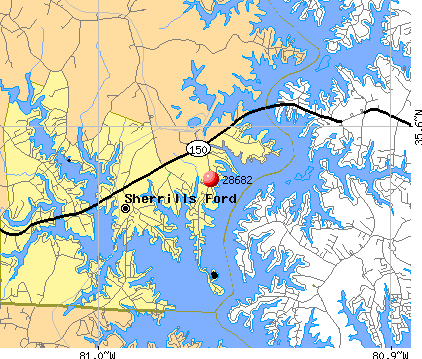
Land area: 3.2 sq. mi. Water area: 3.0 sq. mi.
Population density: 458 people per square mile
(low).
OSM Map
General Map
Google Map
MSN Map
OSM Map
General Map
Google Map
MSN Map
OSM Map
General Map
Google Map
MSN Map
OSM Map
General Map
Google Map
MSN Map
Please wait while loading the map...
Real estate property taxes paid for housing units in 2022:
This zip code:
0.5% ($3,127)
North Carolina:
0.6% ($1,769)
Median real estate property taxes paid for housing units with mortgages in 2022: $2,859 (0.4%) Median real estate property taxes paid for housing units with no mortgage in 2022: $3,712 (0.7%)
Business Search- 14 Million verified businesses
Males: 622
(41.8%)
Females: 865
(58.2%)
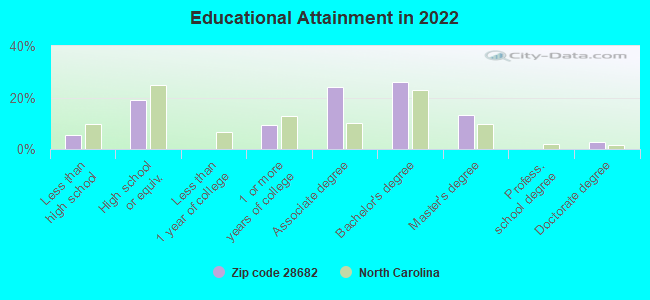
For population 25 years and over in 28682:
High school or higher: 95.4%
Bachelor's degree or higher: 42.8%
Graduate or professional degree: 16.3%
Unemployed: 3.7%
Mean travel time to work (commute): 36.5 minutes
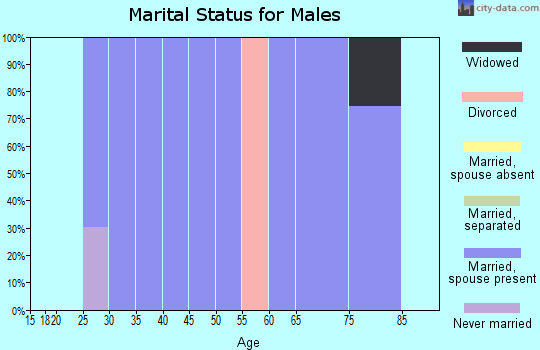
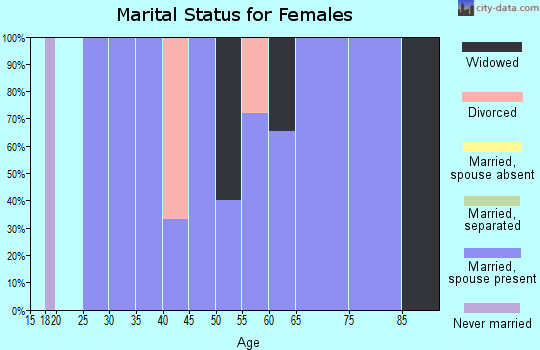
For population 15 years and over in 28682:
Never married: 6.7%
Now married: 84.0%
Separated: 0.6%
Widowed: 2.1%
Divorced: 6.5%
Zip code 28682 compared to state average:
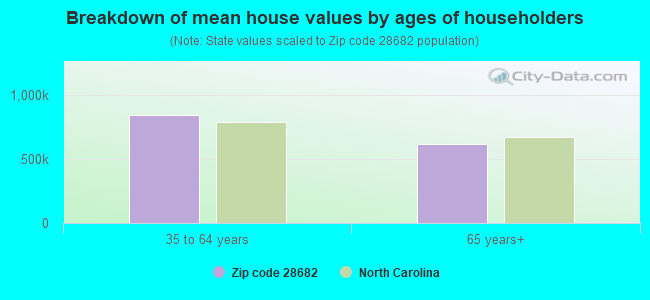
Median house value significantly above state average.
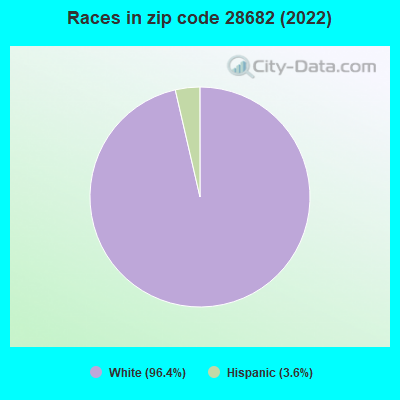
Black race population percentage significantly below state average.
Hispanic race population percentage below state average.
Median age significantly above state average.
Foreign-born population percentage below state average.
Renting percentage below state average.
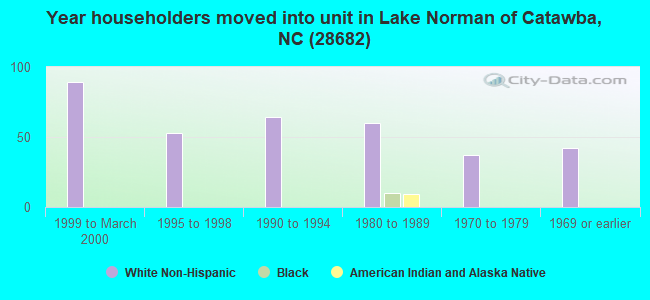
Length of stay since moving in significantly above state average.
Estimated median house/condo value in 2022: $655,928
28682:
$655,928
North Carolina:
$280,600
According to our research of North Carolina and other state lists, there was 1 registered sex offender living in 28682 zip code as of May 17, 2024. The ratio of all residents to sex offenders in zip code 28682 is 1,122 to 1. The ratio of registered sex offenders to all residents in this zip code is lower than the state average.
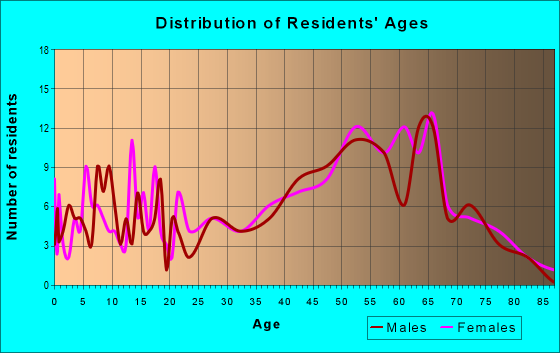
Median resident age:
This zip code:
50.4 years
North Carolina median age:
39.2 years
Average household size:
This zip code:
2.5 people
North Carolina:
2.4 people
Averages for the 2020 tax year for zip code 28682, filed in 2021:
Average Adjusted Gross Income (AGI) in 2020: $126,767 (Individual Income Tax Returns)
Here:
$126,767
State:
$70,020
Salary/wage: $99,263 (reported on 74.2% of returns)
Here:
$99,263
State:
$58,387
(% of AGI for various income ranges: 1134.0% for AGIs below $25k, 4485.0% for AGIs $25k-50k, 6300.0% for AGIs $50k-75k, 7003.3% for AGIs $75k-100k, 14674.4% for AGIs $100k-200k)
Taxable interest for individuals: $2,277 (reported on 47.0% of returns)
This zip code:
$2,277
North Carolina:
$1,479
(% of AGI for various income ranges: 9.0% for AGIs below $25k, 85.0% for AGIs $25k-50k, 67.5% for AGIs $50k-75k, 526.7% for AGIs $75k-100k, 156.7% for AGIs $100k-200k)
Ordinary dividends: $9,004 (reported on 40.9% of returns)
Here:
$9,004
State:
$7,888
(% of AGI for various income ranges: 72.0% for AGIs below $25k, 101.2% for AGIs $25k-50k, 267.5% for AGIs $50k-75k, 673.3% for AGIs $75k-100k, 776.7% for AGIs $100k-200k)
Net capital gain/loss in AGI: +$39,609 (reported on 34.8% of returns)
Here:
+$39,609
State:
+$23,652
(% of AGI for various income ranges: 40.0% for AGIs below $25k, 27.5% for AGIs $25k-50k, 177.5% for AGIs $50k-75k, 303.3% for AGIs $75k-100k, 956.7% for AGIs $100k-200k)
Profit/loss from business: +$20,069 (reported on 19.7% of returns)
Here:
+$20,069
State:
+$11,710
(% of AGI for various income ranges: 149.0% for AGIs below $25k, 476.2% for AGIs $25k-50k, 1094.4% for AGIs $100k-200k)
Taxable individual retirement arrangement distribution: $24,338 (reported on 19.7% of returns)
28682:
$24,338
North Carolina:
$20,247
(% of AGI for various income ranges: 339.0% for AGIs below $25k, 1642.5% for AGIs $50k-75k, 2408.9% for AGIs $100k-200k)
Total itemized deductions: $38,477 (reported on 19.7% of returns)
Here:
$38,477
State:
$34,549
(% of AGI for various income ranges: 2462.5% for AGIs $50k-75k, 1686.7% for AGIs $100k-200k)
Charity contributions: $11,760 (reported on 15.2% of returns)
Here:
$11,760
State:
$13,360
(% of AGI for various income ranges: 105.0% for AGIs $25k-50k, 193.3% for AGIs $100k-200k)
Taxes paid: $8,846 (reported on 19.7% of returns)
28682:
$8,846
State:
$7,586
(% of AGI for various income ranges: 495.0% for AGIs $50k-75k, 451.1% for AGIs $100k-200k)
Earned income credit: $1,925 (reported on 6.1% of returns)
Here:
$1,925
State:
$2,337
(% of AGI for various income ranges: 77.0% for AGIs below $25k)
Percentage of individuals using paid preparers for their 2020 taxes: 93.9%
Here:
94%
State:
93%
(% for various income ranges: 93.3% for AGIs below $25k, 100.0% for AGIs $25k-50k, 87.5% for AGIs $50k-75k, 100.0% for AGIs $75k-100k, 87.5% for AGIs $100k-200k, 100.0% for AGIs over 200k)
Averages for the 2012 tax year for zip code 28682, filed in 2013:
Average Adjusted Gross Income (AGI) in 2012: $84,516 (Individual Income Tax Returns)
Here:
$84,516
State:
$54,937
Salary/wage: $72,018 (reported on 77.2% of returns)
Here:
$72,018
State:
$46,336
(% of AGI for various income ranges: 64.9% for AGIs below $25k, 75.5% for AGIs $25k-50k, 66.1% for AGIs $50k-75k, 67.9% for AGIs $75k-100k, 64.7% for AGIs $100k-200k, 63.9% for AGIs over 200k)
Taxable interest for individuals: $1,490 (reported on 50.9% of returns)
This zip code:
$1,490
North Carolina:
$1,298
(% of AGI for various income ranges: 1.6% for AGIs below $25k, 1.1% for AGIs $25k-50k, 0.8% for AGIs $50k-75k, 1.3% for AGIs $75k-100k, 0.8% for AGIs $100k-200k, 0.7% for AGIs over 200k)
Ordinary dividends: $5,252 (reported on 40.4% of returns)
Here:
$5,252
State:
$6,213
(% of AGI for various income ranges: 3.6% for AGIs below $25k, 3.4% for AGIs $25k-50k, 1.7% for AGIs $50k-75k, 1.8% for AGIs $75k-100k, 3.0% for AGIs $100k-200k, 2.0% for AGIs over 200k)
Net capital gain/loss in AGI: +$3,493 (reported on 26.3% of returns)
Here:
+$3,493
State:
+$12,740
(% of AGI for various income ranges: 2.5% for AGIs $100k-200k, 0.8% for AGIs over 200k)
Profit/loss from business: +$12,067 (reported on 15.8% of returns)
Here:
+$12,067
State:
+$10,311
(% of AGI for various income ranges: 4.8% for AGIs below $25k, 5.7% for AGIs $50k-75k, 4.1% for AGIs $100k-200k)
Taxable individual retirement arrangement distribution: $18,736 (reported on 19.3% of returns)
28682:
$18,736
North Carolina:
$15,575
(% of AGI for various income ranges: 19.8% for AGIs below $25k, 11.2% for AGIs $50k-75k, 6.5% for AGIs $100k-200k)
Total itemized deductions: $28,890 (23% of AGI, reported on 52.6% of returns)
Here:
$28,890
State:
$23,438
Here:
22.9% of AGI
State:
21.5% of AGI
(% of AGI for various income ranges: 22.2% for AGIs below $25k, 16.3% for AGIs $25k-50k, 15.1% for AGIs $50k-75k, 17.7% for AGIs $75k-100k, 19.7% for AGIs $100k-200k, 16.7% for AGIs over 200k)
Charity contributions: $4,915 (reported on 47.4% of returns)
Here:
$4,915
State:
$4,687
(% of AGI for various income ranges: 1.9% for AGIs below $25k, 1.6% for AGIs $25k-50k, 2.5% for AGIs $50k-75k, 2.1% for AGIs $75k-100k, 3.2% for AGIs $100k-200k, 2.9% for AGIs over 200k)
Taxes paid: $11,207 (reported on 52.6% of returns)
28682:
$11,207
State:
$8,823
(% of AGI for various income ranges: 5.3% for AGIs below $25k, 4.8% for AGIs $25k-50k, 4.6% for AGIs $50k-75k, 5.8% for AGIs $75k-100k, 7.3% for AGIs $100k-200k, 8.6% for AGIs over 200k)
Earned income credit: $2,217 (reported on 10.5% of returns)
Here:
$2,217
State:
$2,376
(% of AGI for various income ranges: 6.5% for AGIs below $25k)
Percentage of individuals using paid preparers for their 2012 taxes: 63.2%
Here:
63%
State:
53%
(% for various income ranges: 58.8% for AGIs below $25k, 60.0% for AGIs $25k-50k, 71.4% for AGIs $50k-75k, 66.7% for AGIs $75k-100k, 61.5% for AGIs $100k-200k, 75.0% for AGIs over 200k)
Averages for the 2004 tax year for zip code 28682, filed in 2005:
Average Adjusted Gross Income (AGI) in 2004: $73,482 (Individual Income Tax Returns)
Here:
$73,482
State:
$45,376
Salary/wage: $67,209 (reported on 79.3% of returns)
Here:
$67,209
State:
$39,442
(% of AGI for various income ranges: 62.5% for AGIs $10k-25k, 69.8% for AGIs $25k-50k, 72.9% for AGIs $50k-75k, 65.4% for AGIs $75k-100k, 73.4% for AGIs over 100k)
Taxable interest for individuals: $1,536 (reported on 59.4% of returns)
This zip code:
$1,536
North Carolina:
$1,515
(% of AGI for various income ranges: 0.8% for AGIs $10k-25k, 2.3% for AGIs $25k-50k, 0.9% for AGIs $50k-75k, 2.0% for AGIs $75k-100k, 0.9% for AGIs over 100k)
Taxable dividends: $3,014 (reported on 39.9% of returns)
Here:
$3,014
State:
$4,016
(% of AGI for various income ranges: 2.7% for AGIs $10k-25k, 3.6% for AGIs $25k-50k, 1.1% for AGIs $50k-75k, 1.1% for AGIs $75k-100k, 1.3% for AGIs over 100k)
Net capital gain/loss: +$6,579 (reported on 28.3% of returns)
Here:
+$6,579
State:
+$11,152
(% of AGI for various income ranges: 0.3% for AGIs $25k-50k, 1.2% for AGIs $50k-75k, 1.8% for AGIs $75k-100k, 3.4% for AGIs over 100k)
Profit/loss from business: +$9,116 (reported on 17.7% of returns)
Here:
+$9,116
State:
+$9,490
(% of AGI for various income ranges: 8.3% for AGIs $10k-25k, 4.3% for AGIs $50k-75k, 1.7% for AGIs over 100k)
IRA payment deduction: $3,200 (reported on 3.7% of returns)
28682:
$3,200
North Carolina:
$2,967
Total itemized deductions: $25,325 (22% of AGI, reported on 53.3% of returns)
Here:
$25,325
State:
$19,464
Here:
21.8% of AGI
State:
22.7% of AGI
(% of AGI for various income ranges: 30.4% for AGIs $10k-25k, 14.3% for AGIs $25k-50k, 17.2% for AGIs $50k-75k, 16.9% for AGIs $75k-100k, 18.6% for AGIs over 100k)
Charity contributions deductions: $4,226 (3% of AGI, reported on 47.9% of returns)
Here:
$4,226
State:
$4,035
Here:
3.5% of AGI
State:
4.5% of AGI
(% of AGI for various income ranges: 1.1% for AGIs $10k-25k, 1.9% for AGIs $25k-50k, 2.1% for AGIs $50k-75k, 2.2% for AGIs $75k-100k, 3.2% for AGIs over 100k)
Total tax: $12,838 (reported on 84.0% of returns)
28682:
$12,838
State:
$7,257
(% of AGI for various income ranges: 3.9% for AGIs $10k-25k, 7.2% for AGIs $25k-50k, 9.2% for AGIs $50k-75k, 10.9% for AGIs $75k-100k, 18.2% for AGIs over 100k)
Earned income credit: $1,225 (reported on 7.4% of returns)
Here:
$1,225
State:
$1,851
Percentage of individuals using paid preparers for their 2004 taxes: 69.5%
Here:
69%
State:
62%
(% for various income ranges: 55.7% for AGIs below $10k, 73.1% for AGIs $10k-25k, 71.2% for AGIs $25k-50k, 74.4% for AGIs $50k-75k, 58.8% for AGIs $75k-100k, 75.0% for AGIs over 100k)
Household received Food Stamps/SNAP in the past 12 months: 8 Household did not receive Food Stamps/SNAP in the past 12 months: 581
Women who had a birth in the past 12 months: 23 (24 now married, 0 unmarried) Women who did not have a birth in the past 12 months: 243 (213 now married, 32 unmarried)
Housing units in zip code 28682 with a mortgage: 267 (22 second mortgage, 23 both second mortgage and home equity loan) Houses without a mortgage: 19
Residents with income below the poverty level in 2022:
This zip code:
10.6%
Whole state:
12.8%
Residents with income below 50% of the poverty level in 2022:
This zip code:
9.3%
Whole state:
6.8%
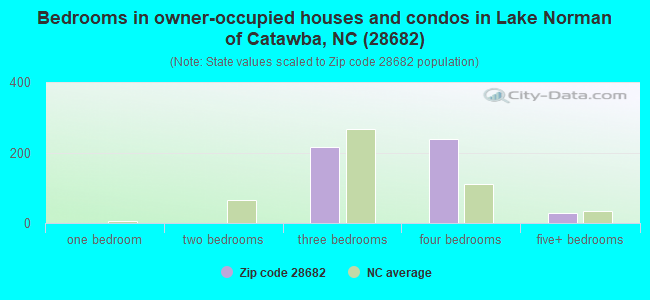
Median number of rooms in houses and condos:
Here:
10.0
State:
6.4
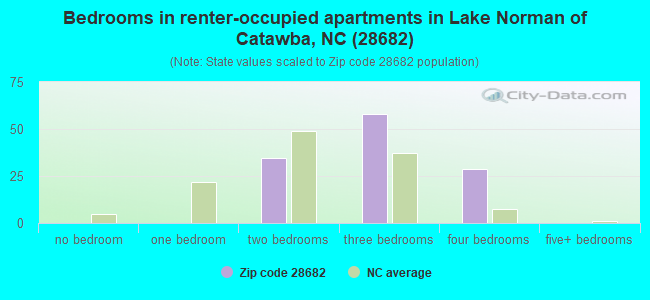
Median number of rooms in apartments:
Here:
4.9
State:
4.4
Notable locations in this zip code not listed on our city pages
Size of family households: 382 2-persons, 15 3-persons, 23 4-persons, 72 5-persons, 27 6-persons, 7 7-or-more-persons
Size of nonfamily households: 72 1-person
268 married couples with children.
0 single-parent households ().
92.5% of residents of 28682 zip code speak English at home.
3.7% of residents speak Spanish at home (57% very well, 20% not well, 22% not at all).
3.8% of residents speak other Indo-European language at home (71% very well, 29% well).
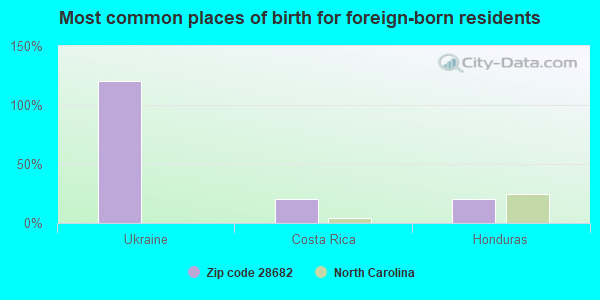
Foreign born population: 56 (3.8%) (58.4% of them are naturalized citizens)
This zip code:
3.8%
Whole state:
8.6%
120%Ukraine
20%Costa Rica
20%Honduras
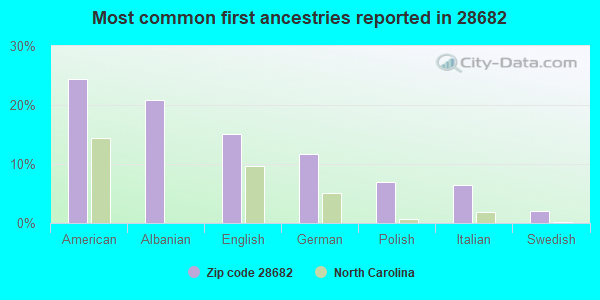
24%American
21%Albanian
15%English
12%German
7%Polish
6%Italian
2%Swedish
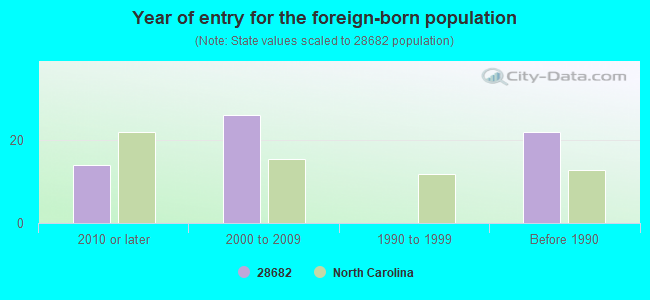
Year of entry for the foreign-born population
142010 or later
262000 to 2009
01990 to 1999
22Before 1990
Facilities with environmental interests located in this zip code:
DUKE POWER MARSHALL PLT (8320 EAST NC HIGHWAY 150 in TERRELL, NC)
AIR MAJOR (AIRS/AFS) AIR PROGRAM (Clean Air Markets Division Business System) (Integrated Compliance Information System) - ICIS-04-2000-0278, FORMAL ENFORCEMENT ACTION STATE MASTER (North Carolina facility info) - AIR PROGRAM, -115DA4YG00T6SW64FBEPR8N8S7, WASTEWATER FACILITY, -000118676, DRINKING WATER PROGRAM, -NC0118676, CRITERIA AND HAZARDOUS AIR POLLUTANT INVENTORY (Inventory of air pollution sources) National Pollutant Discharge Elimination System MAJOR (Tracking pollutant discharge elimination systems) - permit Conditionally Exempt Small Quantity Generators, less than 100 kg/month of hazardous waste (Resource Conservation and Recovery Act (tracking hazardous waste)) - notification USED OIL PROGRAM (Resource Conservation and Recovery Act (tracking hazardous waste)) TRI REPORTER (Tracking of toxic chemicals releasing facilities) Business SIC classification: ELECTRIC SERVICES; NONCLASSIFIABLE ESTABLISHMENTS Organizations: DUKE POWER CO (CONTACT/OPERATOR)
, DUKE ENERGY CORPORATION (OWNER/OPERATOR)
Alternative names: DUKE ENERGY ATTN: J. ED HOGAN, DUKE ENERGY CAROLINAS LLC - MARSHALL ST, DUKE ENERGY MARSHALL STEAM STATION, DUKE POWER CO., MARSHALL S.E., DUKE POWER-MARSHALL STEAM
BORAL MATERIAL TECHNOLOGIES, INCORPORATED, MARSH (8356 EAST HIGHWAY 150 in TERRELL, NC)
AIR SYNTHETIC MINOR (AIRS/AFS) STATE MASTER (North Carolina facility info) - AIR PROGRAM CRITERIA AND HAZARDOUS AIR POLLUTANT INVENTORY (Inventory of air pollution sources) Business SIC classification: BRICK, STONE, AND RELATED CONSTRUCTION MATERIALS
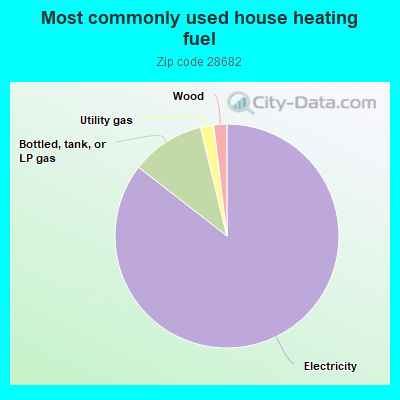
85.7%Electricity
10.7%Bottled, tank, or LP gas
1.9%Utility gas
1.9%Wood
Population in 1990: 440. Population change in the 1990s: +420 (+95.5%).
Place of birth for U.S.-born residents:
This state: 819
Northeast: 313
Midwest: 51
South: 222
West: 11
53% of the 28682 zip code residents lived in the same house 5 years ago. Out of people who lived in different houses, 37% lived in this county. Out of people who lived in different counties, 50% lived in North Carolina.
93% of the 28682 zip code residents lived in the same house 1 year ago. Out of people who lived in different houses, 37% moved from this county. Out of people who lived in different houses, 20% moved from different county within same state. Out of people who lived in different houses, 49% moved from different state.
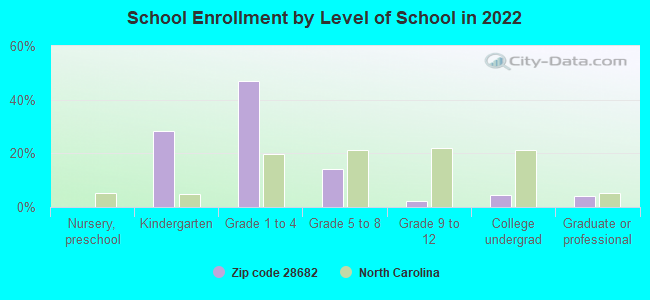
Private vs. public school enrollment:
Students in private schools in grades 1 to 8 (elementary and middle school): 57
Here:
30.5%
North Carolina:
13.8%
Students in private schools in grades 9 to 12 (high school):
Here:
0.0%
North Carolina:
11.9%
Students in private undergraduate colleges:
Here:
0.0%
North Carolina:
19.3%
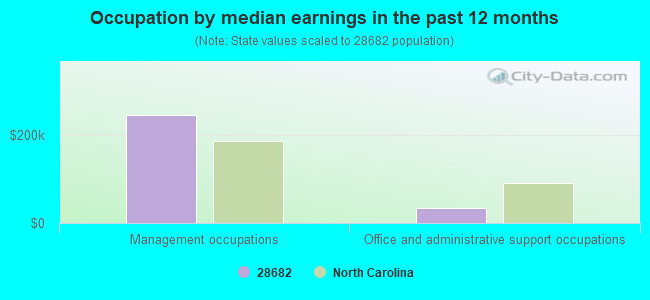
Occupation by median earnings in the past 12 months ($)
244,884Management occupations
33,620Office and administrative support occupations
Companies with federal contracts located in this zip code:
IOMAX USA, INC (3920 LONGVIEW COVE in TERRELL, NC; small business) : $13,526,888 in 36 contractsfrom 2002 to 2006
Contracts for ADP Components, ADPE System Configuration, ADP System Acquisition Support Services. Includes preparation of statement of work, benchmarks, specifications, etc., Other ADP and Telecommunications Services (includes data storage on tapes, compact disks, etc.), and moreby Army, Navy, Department of Veterans Affairs, Department of Defense, and others Signed by year:2000: $0; 2001: $0; 2002: $709,342; 2003: $4,321,076; 2004: $8,846,814; 2005: -$394,491; 2006: $44,147.
Biggest contracts:
$2,469,595 with Army for ADP Components. Signed on 2004-09-29. Completion date: 2005-05-20.
$1,999,595 with Army for ADPE System Configuration. Signed on 2003-09-29. Completion date: 2004-09-28.
$999,440 with Army for ADP System Acquisition Support Services. Includes preparation of statement of work, benchmarks, specifications, etc.. Signed on 2004-08-20. Completion date: 2005-02-28.
$930,631 with Army for Other ADP and Telecommunications Services (includes data storage on tapes, compact disks, etc.). Signed on 2003-01-02. Completion date: 2003-12-31.
Top industries in this zip code by the number of employees in 2005:
Utilities: Electric Power Distribution (100-249 employees: 1 establishment)
Professional, Scientific, and Technical Services: Other Scientific and Technical Consulting Services (20-49: 1, 1-4: 1)
Professional, Scientific, and Technical Services: Other Accounting Services (10-19: 1)
Other Services (except Public Administration): Other Automotive Mechanical and Electrical Repair and Maintenance (10-19: 1)
Administrative and Support and Waste Management and Remediation Services: Landscaping Services (10-19: 1)
Arts, Entertainment, and Recreation: Marinas (10-19: 1)
Real Estate and Rental and Leasing: Offices of Real Estate Agents and Brokers (1-4: 2)
Construction: New Single-Family Housing Construction (except Operative Builders) (1-4: 2)
Home Mortgage Disclosure Act Aggregated Statistics For Year 2009 (Based on 2 partial tracts)
A) FHA, FSA/RHS & VA Home Purchase Loans
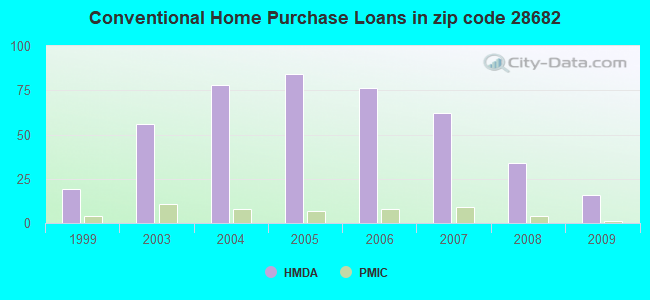
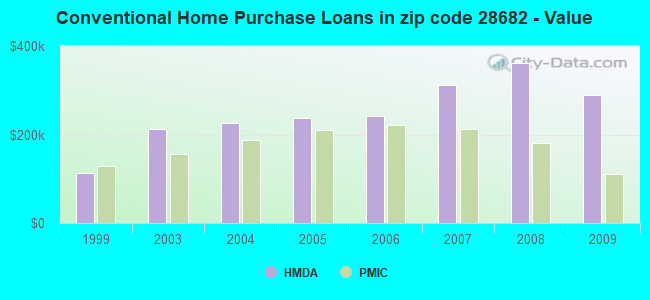
B) Conventional Home Purchase Loans
C) Refinancings
D) Home Improvement Loans
F) Non-occupant Loans on < 5 Family Dwellings (A B C & D)
G) Loans On Manufactured Home Dwelling (A B C & D)
Number
Average Value
Number
Average Value
Number
Average Value
Number
Average Value
Number
Average Value
Number
Average Value
LOANS ORIGINATED
4
$150,025
16
$289,654
104
$265,236
2
$184,070
14
$269,366
3
$114,320
APPLICATIONS APPROVED, NOT ACCEPTED
0
$0
1
$182,130
9
$301,004
0
$0
1
$305,310
1
$81,380
APPLICATIONS DENIED
0
$0
2
$347,385
30
$275,711
1
$30,450
2
$467,790
3
$73,630
APPLICATIONS WITHDRAWN
1
$77,230
2
$582,385
17
$310,879
1
$115,430
3
$310,293
1
$58,960
FILES CLOSED FOR INCOMPLETENESS
0
$0
1
$200,960
7
$238,364
1
$48,720
1
$337,420
1
$42,630
Aggregated Statistics For Year 2008 (Based on 2 partial tracts)
A) FHA, FSA/RHS & VA Home Purchase Loans
B) Conventional Home Purchase Loans
C) Refinancings
D) Home Improvement Loans
F) Non-occupant Loans on < 5 Family Dwellings (A B C & D)
G) Loans On Manufactured Home Dwelling (A B C & D)
Number
Average Value
Number
Average Value
Number
Average Value
Number
Average Value
Number
Average Value
Number
Average Value
LOANS ORIGINATED
6
$123,315
34
$361,574
61
$278,778
5
$116,588
17
$315,047
6
$133,602
APPLICATIONS APPROVED, NOT ACCEPTED
0
$0
2
$137,985
6
$223,793
1
$198,740
1
$240,260
1
$32,110
APPLICATIONS DENIED
1
$124,840
6
$424,103
34
$244,886
5
$75,678
4
$332,022
4
$162,758
APPLICATIONS WITHDRAWN
1
$463,640
5
$359,618
15
$283,997
1
$24,080
2
$294,375
1
$337,140
FILES CLOSED FOR INCOMPLETENESS
0
$0
1
$318,870
2
$261,020
0
$0
0
$0
0
$0
Aggregated Statistics For Year 2007 (Based on 2 partial tracts)
A) FHA, FSA/RHS & VA Home Purchase Loans
B) Conventional Home Purchase Loans
C) Refinancings
D) Home Improvement Loans
F) Non-occupant Loans on < 5 Family Dwellings (A B C & D)
G) Loans On Manufactured Home Dwelling (A B C & D)
Number
Average Value
Number
Average Value
Number
Average Value
Number
Average Value
Number
Average Value
Number
Average Value
LOANS ORIGINATED
1
$124,280
62
$312,663
61
$276,759
4
$246,352
19
$285,701
6
$115,195
APPLICATIONS APPROVED, NOT ACCEPTED
0
$0
7
$272,094
12
$230,274
1
$152,240
3
$222,363
1
$114,600
APPLICATIONS DENIED
0
$0
10
$211,586
41
$239,391
7
$88,457
5
$252,330
4
$78,542
APPLICATIONS WITHDRAWN
0
$0
7
$237,534
21
$287,081
1
$72,240
3
$361,870
2
$154,595
FILES CLOSED FOR INCOMPLETENESS
0
$0
2
$235,555
4
$199,365
0
$0
1
$63,390
0
$0
Aggregated Statistics For Year 2006 (Based on 2 partial tracts)
A) FHA, FSA/RHS & VA Home Purchase Loans
B) Conventional Home Purchase Loans
C) Refinancings
D) Home Improvement Loans
F) Non-occupant Loans on < 5 Family Dwellings (A B C & D)
G) Loans On Manufactured Home Dwelling (A B C & D)
Number
Average Value
Number
Average Value
Number
Average Value
Number
Average Value
Number
Average Value
Number
Average Value
LOANS ORIGINATED
2
$175,770
76
$242,644
65
$215,874
6
$59,097
27
$234,788
7
$104,947
APPLICATIONS APPROVED, NOT ACCEPTED
0
$0
10
$197,801
13
$172,105
3
$79,810
3
$299,497
2
$155,975
APPLICATIONS DENIED
0
$0
12
$220,863
31
$139,355
4
$54,808
5
$139,950
7
$153,584
APPLICATIONS WITHDRAWN
0
$0
8
$265,970
17
$172,707
1
$145,600
3
$252,997
1
$198,740
FILES CLOSED FOR INCOMPLETENESS
0
$0
2
$389,875
7
$246,550
0
$0
2
$277,490
0
$0
Aggregated Statistics For Year 2005 (Based on 2 partial tracts)
A) FHA, FSA/RHS & VA Home Purchase Loans
B) Conventional Home Purchase Loans
C) Refinancings
D) Home Improvement Loans
F) Non-occupant Loans on < 5 Family Dwellings (A B C & D)
G) Loans On Manufactured Home Dwelling (A B C & D)
Number
Average Value
Number
Average Value
Number
Average Value
Number
Average Value
Number
Average Value
Number
Average Value
LOANS ORIGINATED
2
$130,650
84
$236,390
70
$221,033
5
$84,036
24
$185,283
7
$105,936
APPLICATIONS APPROVED, NOT ACCEPTED
0
$0
4
$245,522
14
$139,033
1
$20,480
2
$206,770
3
$79,440
APPLICATIONS DENIED
1
$40,410
10
$211,946
45
$142,638
5
$51,098
3
$366,113
8
$84,285
APPLICATIONS WITHDRAWN
0
$0
9
$239,556
24
$189,804
3
$112,657
2
$392,085
4
$79,165
FILES CLOSED FOR INCOMPLETENESS
0
$0
1
$83,590
8
$182,619
0
$0
1
$272,920
2
$87,885
Aggregated Statistics For Year 2004 (Based on 2 partial tracts)
A) FHA, FSA/RHS & VA Home Purchase Loans
B) Conventional Home Purchase Loans
C) Refinancings
D) Home Improvement Loans
F) Non-occupant Loans on < 5 Family Dwellings (A B C & D)
G) Loans On Manufactured Home Dwelling (A B C & D)
Number
Average Value
Number
Average Value
Number
Average Value
Number
Average Value
Number
Average Value
Number
Average Value
LOANS ORIGINATED
2
$107,120
78
$225,429
74
$184,270
4
$72,175
22
$188,073
8
$108,264
APPLICATIONS APPROVED, NOT ACCEPTED
0
$0
8
$146,220
10
$201,870
2
$31,000
2
$134,525
4
$59,720
APPLICATIONS DENIED
0
$0
14
$186,049
34
$137,619
4
$26,228
4
$116,810
10
$90,956
APPLICATIONS WITHDRAWN
0
$0
6
$228,360
18
$143,521
2
$94,805
3
$165,620
1
$169,400
FILES CLOSED FOR INCOMPLETENESS
0
$0
2
$287,040
7
$135,513
0
$0
1
$91,070
0
$0
Aggregated Statistics For Year 2003 (Based on 2 partial tracts)
A) FHA, FSA/RHS & VA Home Purchase Loans
B) Conventional Home Purchase Loans
C) Refinancings
D) Home Improvement Loans
F) Non-occupant Loans on < 5 Family Dwellings (A B C & D)
Number
Average Value
Number
Average Value
Number
Average Value
Number
Average Value
Number
Average Value
LOANS ORIGINATED
3
$107,860
56
$211,742
150
$177,868
2
$40,550
31
$169,526
APPLICATIONS APPROVED, NOT ACCEPTED
0
$0
4
$204,210
21
$163,193
1
$6,640
3
$124,560
APPLICATIONS DENIED
1
$103,520
11
$158,154
44
$140,998
2
$11,485
4
$173,900
APPLICATIONS WITHDRAWN
0
$0
6
$193,713
20
$191,947
0
$0
4
$125,252
FILES CLOSED FOR INCOMPLETENESS
0
$0
1
$244,140
4
$212,305
0
$0
0
$0
Aggregated Statistics For Year 1999 (Based on 1 partial tract)
A) FHA, FSA/RHS & VA Home Purchase Loans
B) Conventional Home Purchase Loans
C) Refinancings
D) Home Improvement Loans
F) Non-occupant Loans on < 5 Family Dwellings (A B C & D)
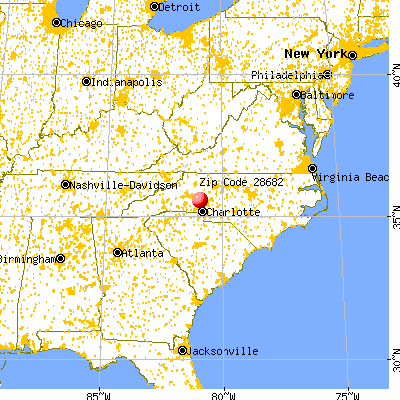


 Nearest zip codes: 28673, 28117, 28037, 28609, 28166, 28031.