Estimated zip code population in 2022: 496 Zip code population in 2010: 551 Zip code population in 2000: 563
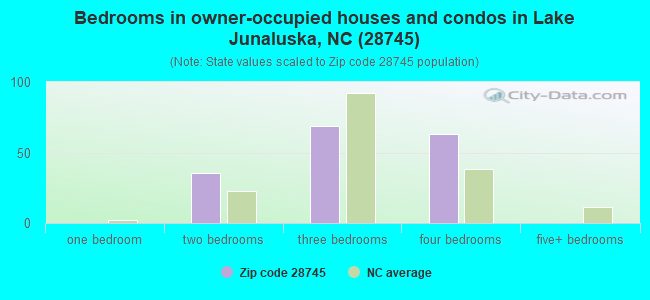
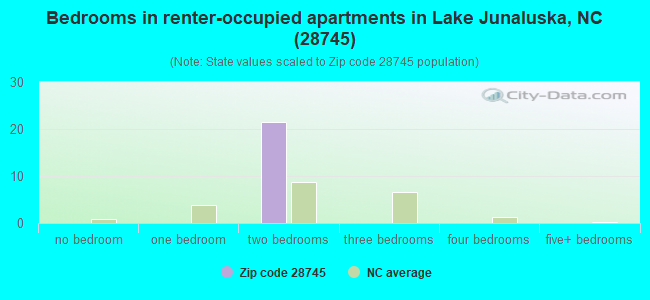
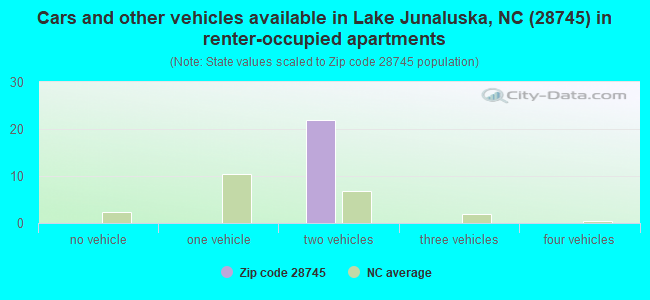
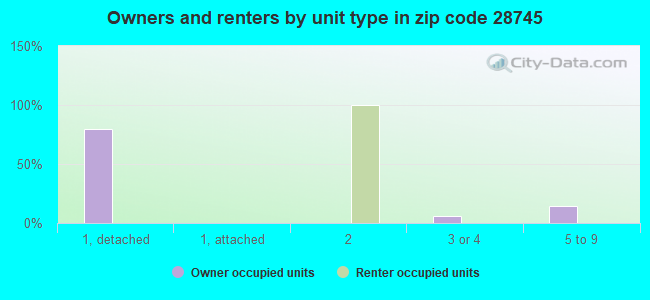
Houses and condos: 581 Renter-occupied apartments: 21
% of renters here:
11%
State:
33%
March 2022 cost of living index in zip code 28745: 88.1 (less than average, U.S. average is 100)
Land area: 0.6 sq. mi. Water area: 0.2 sq. mi.
Population density: 796 people per square mile
(low).
OSM Map
General Map
Google Map
MSN Map
OSM Map
General Map
Google Map
MSN Map
OSM Map
General Map
Google Map
MSN Map
OSM Map
General Map
Google Map
MSN Map
Please wait while loading the map...
Real estate property taxes paid for housing units in 2022:
This zip code:
0.4% ($1,706)
North Carolina:
0.6% ($1,769)
Median real estate property taxes paid for housing units with mortgages in 2022: $1,617 (0.3%) Median real estate property taxes paid for housing units with no mortgage in 2022: $2,272 (0.6%)
Business Search- 14 Million verified businesses
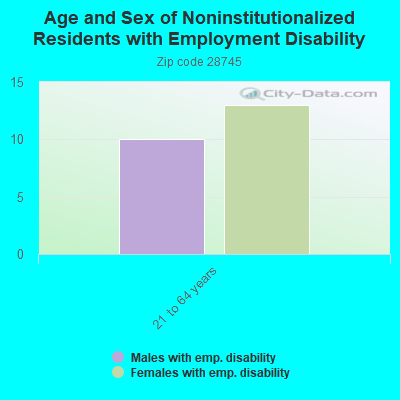
Males: 279
(56.3%)
Females: 217
(43.7%)
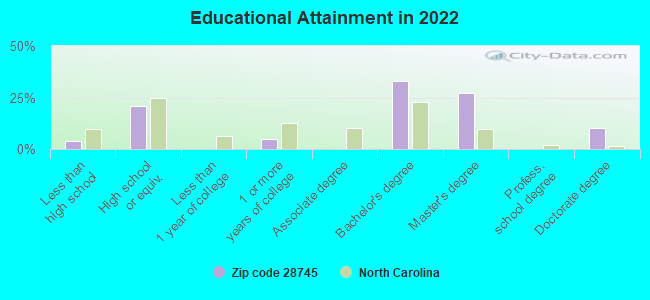
For population 25 years and over in 28745:
High school or higher: 99.3%
Bachelor's degree or higher: 72.7%
Graduate or professional degree: 38.7%
Mean travel time to work (commute): 14.3 minutes
For population 15 years and over in 28745:
Never married: 12.4%
Now married: 63.0%
Separated: 0.0%
Widowed: 12.6%
Divorced: 11.9%
Zip code 28745 compared to state average:
Median house value above state average.
Unemployed percentage significantly below state average.
Black race population percentage significantly below state average.
Hispanic race population percentage significantly below state average.
Median age significantly above state average.
Foreign-born population percentage significantly below state average.
Renting percentage significantly below state average.
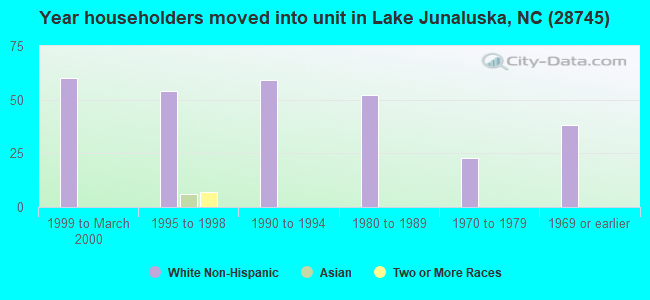
Length of stay since moving in significantly above state average.
House age above state average.
Number of college students below state average.
Percentage of population with a bachelor's degree or higher significantly above state average.
Estimated median house/condo value in 2022: $436,369
28745:
$436,369
North Carolina:
$280,600
Median resident age:
This zip code:
58.0 years
North Carolina median age:
39.2 years
Average household size:
This zip code:
2.7 people
North Carolina:
2.4 people
Averages for the 2020 tax year for zip code 28745, filed in 2021:
Average Adjusted Gross Income (AGI) in 2020: $73,481 (Individual Income Tax Returns)
Here:
$73,481
State:
$70,020
Salary/wage: $58,374 (reported on 63.5% of returns)
Here:
$58,374
State:
$58,387
(% of AGI for various income ranges: 1182.5% for AGIs below $25k, 3489.0% for AGIs $25k-50k, 5945.7% for AGIs $50k-75k, 7237.5% for AGIs $75k-100k, 16740.0% for AGIs $100k-200k)
Taxable interest for individuals: $1,269 (reported on 47.3% of returns)
This zip code:
$1,269
North Carolina:
$1,479
(% of AGI for various income ranges: 40.8% for AGIs below $25k, 37.0% for AGIs $25k-50k, 105.7% for AGIs $50k-75k, 42.5% for AGIs $75k-100k, 444.0% for AGIs $100k-200k)
Ordinary dividends: $6,709 (reported on 31.1% of returns)
Here:
$6,709
State:
$7,888
(% of AGI for various income ranges: 55.0% for AGIs below $25k, 114.0% for AGIs $25k-50k, 252.9% for AGIs $50k-75k, 627.5% for AGIs $75k-100k, 1106.0% for AGIs $100k-200k)
Net capital gain/loss in AGI: +$15,043 (reported on 31.1% of returns)
Here:
+$15,043
State:
+$23,652
(% of AGI for various income ranges: 1.7% for AGIs below $25k, 30.0% for AGIs $25k-50k, 262.9% for AGIs $50k-75k, 527.5% for AGIs $75k-100k, 1606.0% for AGIs $100k-200k)
Profit/loss from business: +$6,431 (reported on 17.6% of returns)
Here:
+$6,431
State:
+$11,710
(% of AGI for various income ranges: 206.7% for AGIs below $25k, 77.0% for AGIs $25k-50k, 474.3% for AGIs $50k-75k, 358.0% for AGIs $100k-200k)
Taxable individual retirement arrangement distribution: $17,167 (reported on 20.3% of returns)
28745:
$17,167
North Carolina:
$20,247
(% of AGI for various income ranges: 223.3% for AGIs below $25k, 337.0% for AGIs $25k-50k, 1140.0% for AGIs $50k-75k, 2344.0% for AGIs $100k-200k)
Total itemized deductions: $34,760 (reported on 13.5% of returns)
Here:
$34,760
State:
$34,549
(% of AGI for various income ranges: 1604.3% for AGIs $50k-75k, 4706.0% for AGIs $100k-200k)
Charity contributions: $17,688 (reported on 10.8% of returns)
Here:
$17,688
State:
$13,360
(% of AGI for various income ranges: 390.0% for AGIs $50k-75k, 2284.0% for AGIs $100k-200k)
Taxes paid: $6,760 (reported on 13.5% of returns)
28745:
$6,760
State:
$7,586
(% of AGI for various income ranges: 297.1% for AGIs $50k-75k, 936.0% for AGIs $100k-200k)
Earned income credit: $2,133 (reported on 8.1% of returns)
Here:
$2,133
State:
$2,337
(% of AGI for various income ranges: 106.7% for AGIs below $25k)
Percentage of individuals using paid preparers for their 2020 taxes: 90.5%
Here:
91%
State:
93%
(% for various income ranges: 90.5% for AGIs below $25k, 93.3% for AGIs $25k-50k, 92.3% for AGIs $50k-75k, 85.7% for AGIs $75k-100k, 92.3% for AGIs $100k-200k, 80.0% for AGIs over 200k)
Averages for the 2012 tax year for zip code 28745, filed in 2013:
Average Adjusted Gross Income (AGI) in 2012: $53,806 (Individual Income Tax Returns)
Here:
$53,806
State:
$54,937
Salary/wage: $44,348 (reported on 64.8% of returns)
Here:
$44,348
State:
$46,336
(% of AGI for various income ranges: 53.1% for AGIs below $25k, 62.6% for AGIs $25k-50k, 55.5% for AGIs $50k-75k, 48.1% for AGIs $75k-100k, 80.3% for AGIs $100k-200k)
Taxable interest for individuals: $1,457 (reported on 49.3% of returns)
This zip code:
$1,457
North Carolina:
$1,298
(% of AGI for various income ranges: 3.0% for AGIs below $25k, 1.0% for AGIs $25k-50k, 1.6% for AGIs $50k-75k, 1.7% for AGIs $75k-100k, 1.4% for AGIs $100k-200k)
Ordinary dividends: $5,086 (reported on 31.0% of returns)
Here:
$5,086
State:
$6,213
(% of AGI for various income ranges: 3.5% for AGIs below $25k, 2.8% for AGIs $25k-50k, 2.9% for AGIs $50k-75k, 3.9% for AGIs $75k-100k, 3.9% for AGIs $100k-200k)
Net capital gain/loss in AGI: +$1,606 (reported on 25.4% of returns)
Here:
+$1,606
State:
+$12,740
(% of AGI for various income ranges: 0.1% for AGIs $25k-50k, 0.2% for AGIs $50k-75k, 0.9% for AGIs $75k-100k, 2.4% for AGIs $100k-200k)
Profit/loss from business: +$5,114 (reported on 19.7% of returns)
Here:
+$5,114
State:
+$10,311
(% of AGI for various income ranges: 9.9% for AGIs below $25k, 6.2% for AGIs $25k-50k, 0.2% for AGIs $75k-100k)
Taxable individual retirement arrangement distribution: $13,920 (reported on 21.1% of returns)
28745:
$13,920
North Carolina:
$15,575
(% of AGI for various income ranges: 4.8% for AGIs below $25k, 4.0% for AGIs $25k-50k, 5.8% for AGIs $50k-75k, 3.8% for AGIs $75k-100k, 10.4% for AGIs $100k-200k)
Total itemized deductions: $23,138 (26% of AGI, reported on 40.8% of returns)
Here:
$23,138
State:
$23,438
Here:
26.4% of AGI
State:
21.5% of AGI
(% of AGI for various income ranges: 16.0% for AGIs below $25k, 16.2% for AGIs $25k-50k, 16.4% for AGIs $50k-75k, 19.6% for AGIs $75k-100k, 28.4% for AGIs $100k-200k)
Charity contributions: $6,172 (reported on 35.2% of returns)
Here:
$6,172
State:
$4,687
(% of AGI for various income ranges: 2.2% for AGIs below $25k, 2.6% for AGIs $25k-50k, 3.9% for AGIs $50k-75k, 4.3% for AGIs $75k-100k, 7.7% for AGIs $100k-200k)
Taxes paid: $6,646 (reported on 39.4% of returns)
28745:
$6,646
State:
$8,823
(% of AGI for various income ranges: 2.8% for AGIs below $25k, 3.0% for AGIs $25k-50k, 3.6% for AGIs $50k-75k, 5.1% for AGIs $75k-100k, 10.0% for AGIs $100k-200k)
Earned income credit: $1,836 (reported on 15.5% of returns)
Here:
$1,836
State:
$2,376
(% of AGI for various income ranges: 4.2% for AGIs below $25k, 0.9% for AGIs $25k-50k)
Percentage of individuals using paid preparers for their 2012 taxes: 63.4%
Here:
63%
State:
53%
(% for various income ranges: 55.6% for AGIs below $25k, 62.5% for AGIs $25k-50k, 72.7% for AGIs $50k-75k, 71.4% for AGIs $75k-100k, 87.5% for AGIs $100k-200k)
Averages for the 2004 tax year for zip code 28745, filed in 2005:
Average Adjusted Gross Income (AGI) in 2004: $38,721 (Individual Income Tax Returns)
Here:
$38,721
State:
$45,376
Salary/wage: $30,981 (reported on 70.8% of returns)
Here:
$30,981
State:
$39,442
(% of AGI for various income ranges: 91.9% for AGIs below $10k, 62.1% for AGIs $10k-25k, 64.8% for AGIs $25k-50k, 57.3% for AGIs $50k-75k, 51.8% for AGIs $75k-100k, 43.6% for AGIs over 100k)
Taxable interest for individuals: $1,672 (reported on 54.6% of returns)
This zip code:
$1,672
North Carolina:
$1,515
(% of AGI for various income ranges: 7.6% for AGIs below $10k, 2.6% for AGIs $10k-25k, 2.0% for AGIs $25k-50k, 3.0% for AGIs $50k-75k, 2.1% for AGIs $75k-100k, 1.6% for AGIs over 100k)
Taxable dividends: $3,528 (reported on 30.7% of returns)
Here:
$3,528
State:
$4,016
(% of AGI for various income ranges: 3.9% for AGIs below $10k, 2.3% for AGIs $10k-25k, 1.9% for AGIs $25k-50k, 4.8% for AGIs $50k-75k, 2.2% for AGIs $75k-100k, 2.2% for AGIs over 100k)
Net capital gain/loss: +$2,985 (reported on 24.6% of returns)
Here:
+$2,985
State:
+$11,152
(% of AGI for various income ranges: 0.8% for AGIs below $10k, 0.9% for AGIs $10k-25k, 0.8% for AGIs $25k-50k, 0.9% for AGIs $50k-75k, 0.6% for AGIs $75k-100k, 6.0% for AGIs over 100k)
Profit/loss from business: +$9,095 (reported on 18.0% of returns)
Here:
+$9,095
State:
+$9,490
(% of AGI for various income ranges: 20.3% for AGIs below $10k, 9.4% for AGIs $10k-25k, 2.4% for AGIs $25k-50k, 3.6% for AGIs $50k-75k, 7.6% for AGIs $75k-100k)
IRA payment deduction: $1,870 (reported on 2.8% of returns)
28745:
$1,870
North Carolina:
$2,967
Total itemized deductions: $19,031 (30% of AGI, reported on 35.7% of returns)
Here:
$19,031
State:
$19,464
Here:
29.7% of AGI
State:
22.7% of AGI
(% of AGI for various income ranges: 19.2% for AGIs $10k-25k, 16.1% for AGIs $25k-50k, 19.9% for AGIs $50k-75k, 17.6% for AGIs $75k-100k, 17.2% for AGIs over 100k)
Charity contributions deductions: $5,538 (8% of AGI, reported on 33.5% of returns)
Here:
$5,538
State:
$4,035
Here:
8.4% of AGI
State:
4.5% of AGI
(% of AGI for various income ranges: 3.1% for AGIs $10k-25k, 3.7% for AGIs $25k-50k, 5.9% for AGIs $50k-75k, 5.6% for AGIs $75k-100k, 5.7% for AGIs over 100k)
Total tax: $4,951 (reported on 74.7% of returns)
28745:
$4,951
State:
$7,257
(% of AGI for various income ranges: 4.5% for AGIs below $10k, 3.8% for AGIs $10k-25k, 6.2% for AGIs $25k-50k, 8.6% for AGIs $50k-75k, 11.2% for AGIs $75k-100k, 17.1% for AGIs over 100k)
Earned income credit: $1,912 (reported on 15.2% of returns)
Here:
$1,912
State:
$1,851
Percentage of individuals using paid preparers for their 2004 taxes: 69.1%
Here:
69%
State:
62%
(% for various income ranges: 60.9% for AGIs below $10k, 72.2% for AGIs $10k-25k, 73.4% for AGIs $25k-50k, 71.1% for AGIs $50k-75k, 65.6% for AGIs $75k-100k, 59.1% for AGIs over 100k)
Household received Food Stamps/SNAP in the past 12 months: 13 Household did not receive Food Stamps/SNAP in the past 12 months: 172
Women who did not have a birth in the past 12 months: 53 (53 now married, 0 unmarried)
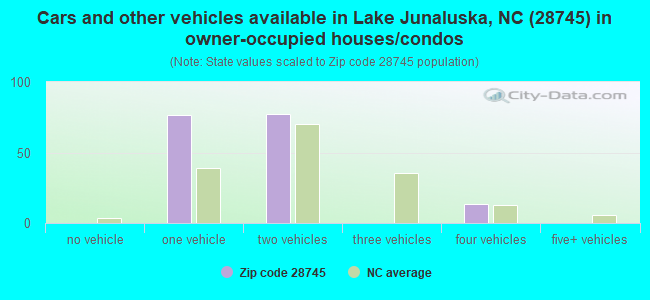
Housing units in zip code 28745 with a mortgage: 106 (11 second mortgage, 12 both second mortgage and home equity loan) Median monthly owner costs for units with a mortgage: $1,732 Median monthly owner costs for units without a mortgage: $467
Residents with income below the poverty level in 2022:
This zip code:
1.6%
Whole state:
12.8%
Median number of rooms in houses and condos:
Here:
7.0
State:
6.4
Notable locations in this zip code not listed on our city pages
Size of family households: 78 2-persons, 19 3-persons, 21 4-persons, 21 6-persons
Size of nonfamily households: 33 1-person, 12 3-persons
82 married couples with children.
0 single-parent households ().
97.7% of residents of 28745 zip code speak English at home.
3.4% of residents speak other Indo-European language at home (100% very well).
Foreign born population: 0 (0.0%)
:
0.0%
Whole state:
8.6%
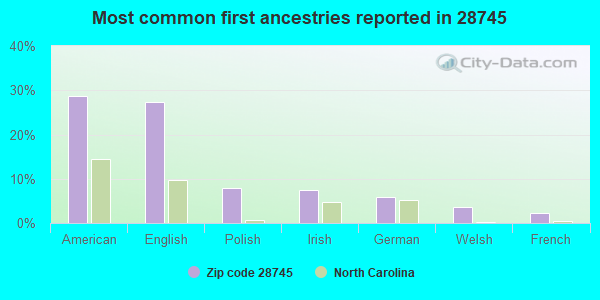
29%American
27%English
8%Polish
8%Irish
6%German
4%Welsh
2%French
Housing units lacking complete plumbing facilities: 6.1%
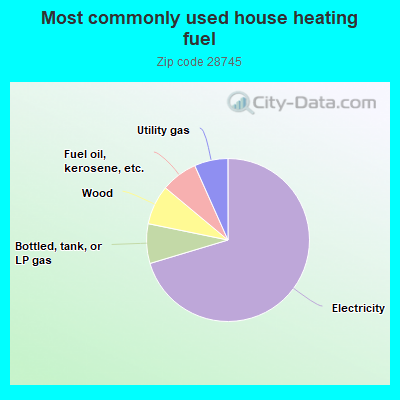
71.7%Electricity
8.0%Bottled, tank, or LP gas
8.0%Wood
7.4%Fuel oil, kerosene, etc.
6.8%Utility gas
Population in 1990: 539. Population change in the 1990s: +24 (+4.5%).
Place of birth for U.S.-born residents:
This state: 282
Northeast: 63
Midwest: 31
South: 90
West: 26
54% of the 28745 zip code residents lived in the same house 5 years ago. Out of people who lived in different houses, 45% lived in this county. Out of people who lived in different counties, 50% lived in North Carolina.
88% of the 28745 zip code residents lived in the same house 1 year ago. Out of people who lived in different houses, 31% moved from this county. Out of people who lived in different houses, 65% moved from different county within same state.
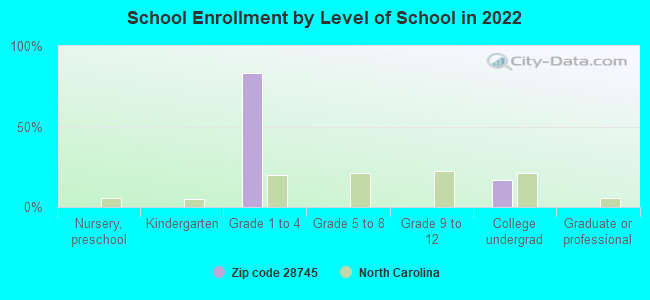
Private vs. public school enrollment:
Students in private schools in grades 1 to 8 (elementary and middle school):
Here:
0.0%
North Carolina:
13.8%
Students in private undergraduate colleges:
Here:
0.0%
North Carolina:
19.3%
Top industries in this zip code by the number of employees in 2005:
Other Services (except Public Administration): Religious Organizations (100-249 employees: 1 establishment, 50-99 employees: 1 establishment, 5-9 employees: 1 establishment, 1-4 employees: 1 establishment)
Accommodation and Food Services: Full-Service Restaurants (20-49: 1)
Accommodation and Food Services: Food Service Contractors (10-19: 1)
Construction: New Single-Family Housing Construction (except Operative Builders) (5-9: 1, 1-4: 1)
Real Estate and Rental and Leasing: Offices of Real Estate Agents and Brokers (5-9: 1, 1-4: 1)
Health Care and Social Assistance: Offices of Dentists (5-9: 1)
Professional, Scientific, and Technical Services: Architectural Services (1-4: 1)
Home Mortgage Disclosure Act Aggregated Statistics For Year 2009 (Based on 2 partial tracts)
A) FHA, FSA/RHS & VA Home Purchase Loans
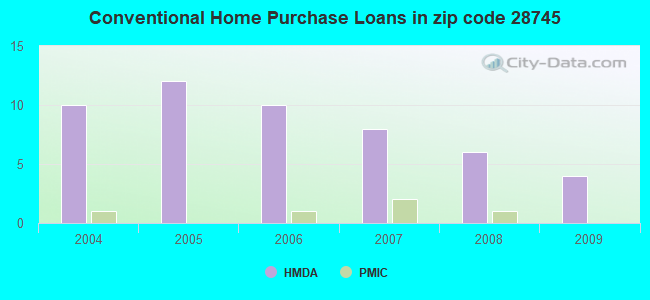
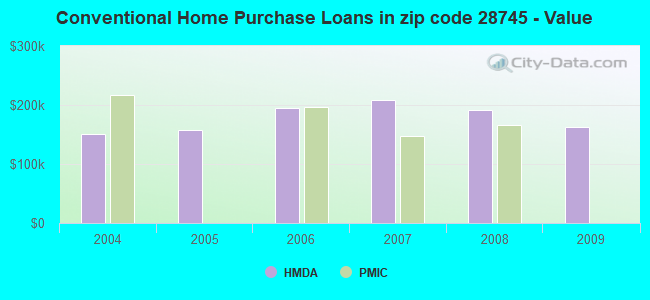
B) Conventional Home Purchase Loans
C) Refinancings
F) Non-occupant Loans on < 5 Family Dwellings (A B C & D)
G) Loans On Manufactured Home Dwelling (A B C & D)
Number
Average Value
Number
Average Value
Number
Average Value
Number
Average Value
Number
Average Value
LOANS ORIGINATED
1
$173,450
4
$162,840
18
$175,263
5
$205,042
1
$51,240
APPLICATIONS APPROVED, NOT ACCEPTED
0
$0
0
$0
1
$134,240
0
$0
0
$0
APPLICATIONS DENIED
0
$0
1
$94,910
3
$183,253
1
$153,060
0
$0
APPLICATIONS WITHDRAWN
0
$0
1
$118,530
2
$217,065
1
$184,140
0
$0
FILES CLOSED FOR INCOMPLETENESS
0
$0
0
$0
0
$0
0
$0
0
$0
Aggregated Statistics For Year 2008 (Based on 2 partial tracts)
B) Conventional Home Purchase Loans
C) Refinancings
D) Home Improvement Loans
F) Non-occupant Loans on < 5 Family Dwellings (A B C & D)
G) Loans On Manufactured Home Dwelling (A B C & D)
Number
Average Value
Number
Average Value
Number
Average Value
Number
Average Value
Number
Average Value
LOANS ORIGINATED
6
$191,960
12
$169,365
1
$114,960
4
$210,825
1
$55,700
APPLICATIONS APPROVED, NOT ACCEPTED
1
$120,650
1
$214,670
0
$0
0
$0
0
$0
APPLICATIONS DENIED
1
$223,470
5
$180,468
0
$0
1
$140,360
1
$76,420
APPLICATIONS WITHDRAWN
0
$0
2
$259,060
0
$0
0
$0
0
$0
FILES CLOSED FOR INCOMPLETENESS
0
$0
1
$112,740
0
$0
0
$0
0
$0
Aggregated Statistics For Year 2007 (Based on 2 partial tracts)
B) Conventional Home Purchase Loans
C) Refinancings
D) Home Improvement Loans
F) Non-occupant Loans on < 5 Family Dwellings (A B C & D)
G) Loans On Manufactured Home Dwelling (A B C & D)
Number
Average Value
Number
Average Value
Number
Average Value
Number
Average Value
Number
Average Value
LOANS ORIGINATED
8
$208,889
12
$141,552
1
$40,770
5
$184,390
1
$99,590
APPLICATIONS APPROVED, NOT ACCEPTED
1
$167,430
2
$107,835
0
$0
0
$0
0
$0
APPLICATIONS DENIED
1
$264,800
5
$201,054
1
$31,640
1
$357,370
1
$44,340
APPLICATIONS WITHDRAWN
0
$0
1
$197,850
0
$0
0
$0
0
$0
FILES CLOSED FOR INCOMPLETENESS
0
$0
0
$0
0
$0
0
$0
0
$0
Aggregated Statistics For Year 2006 (Based on 2 partial tracts)
B) Conventional Home Purchase Loans
C) Refinancings
D) Home Improvement Loans
F) Non-occupant Loans on < 5 Family Dwellings (A B C & D)
Number
Average Value
Number
Average Value
Number
Average Value
Number
Average Value
LOANS ORIGINATED
10
$194,137
11
$149,610
0
$0
6
$186,910
APPLICATIONS APPROVED, NOT ACCEPTED
0
$0
1
$102,820
0
$0
0
$0
APPLICATIONS DENIED
1
$120,310
4
$165,095
1
$37,650
1
$73,080
APPLICATIONS WITHDRAWN
1
$142,590
2
$116,190
0
$0
0
$0
FILES CLOSED FOR INCOMPLETENESS
0
$0
1
$104,600
0
$0
0
$0
Aggregated Statistics For Year 2005 (Based on 2 partial tracts)
B) Conventional Home Purchase Loans
C) Refinancings
D) Home Improvement Loans
F) Non-occupant Loans on < 5 Family Dwellings (A B C & D)
G) Loans On Manufactured Home Dwelling (A B C & D)
Number
Average Value
Number
Average Value
Number
Average Value
Number
Average Value
Number
Average Value
LOANS ORIGINATED
12
$157,947
11
$131,341
2
$55,200
9
$168,313
1
$52,910
APPLICATIONS APPROVED, NOT ACCEPTED
1
$111,960
2
$123,095
0
$0
0
$0
0
$0
APPLICATIONS DENIED
1
$140,140
6
$134,163
0
$0
1
$59,490
1
$58,260
APPLICATIONS WITHDRAWN
1
$207,320
3
$115,113
0
$0
1
$128,670
0
$0
FILES CLOSED FOR INCOMPLETENESS
0
$0
1
$169,440
0
$0
0
$0
0
$0
Aggregated Statistics For Year 2004 (Based on 2 partial tracts)
B) Conventional Home Purchase Loans
C) Refinancings
D) Home Improvement Loans
F) Non-occupant Loans on < 5 Family Dwellings (A B C & D)
G) Loans On Manufactured Home Dwelling (A B C & D)


 Nearest zip codes: 28786, 28721, 28751, 28716, 28707, 28785.