Estimated zip code population in 2022: 4,336 Zip code population in 2010: 4,504 Zip code population in 2000: 4,193
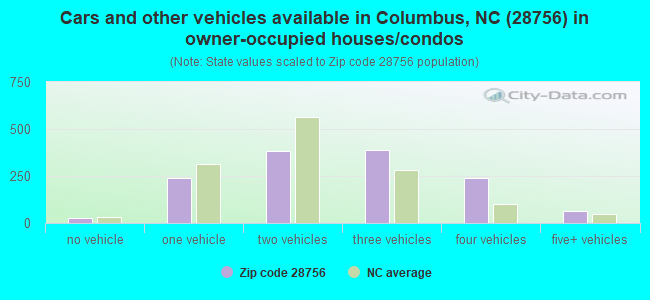
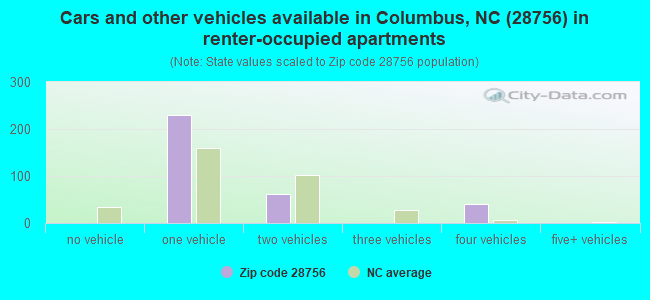
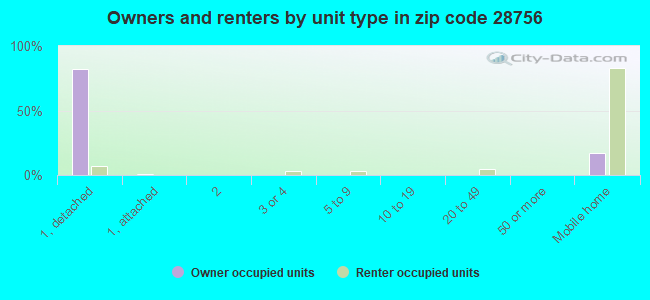
Houses and condos: 2,255 Renter-occupied apartments: 330
% of renters here:
20%
State:
33%
March 2022 cost of living index in zip code 28756: 80.3 (low, U.S. average is 100)
Land area: 89.8 sq. mi. Water area: 0.6 sq. mi.
Population density: 48 people per square mile
(very low).
OSM Map
General Map
Google Map
MSN Map
OSM Map
General Map
Google Map
MSN Map
OSM Map
General Map
Google Map
MSN Map
OSM Map
General Map
Google Map
MSN Map
Please wait while loading the map...
Real estate property taxes paid for housing units in 2022:
This zip code:
0.5% ($1,200)
North Carolina:
0.6% ($1,769)
Median real estate property taxes paid for housing units with mortgages in 2022: $991 (0.5%) Median real estate property taxes paid for housing units with no mortgage in 2022: $1,321 (0.4%)
Business Search- 14 Million verified businesses
Males: 1,957
(45.1%)
Females: 2,379
(54.9%)
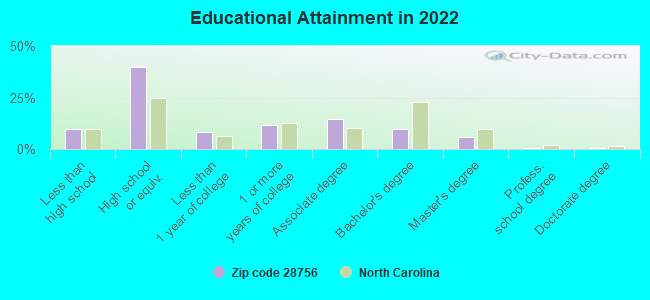
For population 25 years and over in 28756:
High school or higher: 89.5%
Bachelor's degree or higher: 16.2%
Graduate or professional degree: 6.7%
Unemployed: 4.2%
Mean travel time to work (commute): 33.0 minutes
For population 15 years and over in 28756:
Never married: 28.4%
Now married: 55.0%
Separated: 0.3%
Widowed: 7.3%
Divorced: 8.9%
Zip code 28756 compared to state average:
Black race population percentage significantly below state average.
Median age above state average.
Foreign-born population percentage below state average.
Renting percentage below state average.
Length of stay since moving in significantly above state average.
Number of college students significantly below state average.
Percentage of population with a bachelor's degree or higher below state average.
Averages for the 2020 tax year for zip code 28756, filed in 2021:
Average Adjusted Gross Income (AGI) in 2020: $63,128 (Individual Income Tax Returns)
Here:
$63,128
State:
$70,020
Salary/wage: $49,162 (reported on 75.9% of returns)
Here:
$49,162
State:
$58,387
(% of AGI for various income ranges: 1259.4% for AGIs below $25k, 3592.4% for AGIs $25k-50k, 6924.0% for AGIs $50k-75k, 10215.0% for AGIs $75k-100k, 16185.0% for AGIs $100k-200k, 50396.7% for AGIs over 200k)
Taxable interest for individuals: $1,620 (reported on 35.3% of returns)
This zip code:
$1,620
North Carolina:
$1,479
(% of AGI for various income ranges: 13.0% for AGIs below $25k, 35.8% for AGIs $25k-50k, 80.0% for AGIs $50k-75k, 43.8% for AGIs $75k-100k, 256.0% for AGIs $100k-200k, 1523.3% for AGIs over 200k)
Ordinary dividends: $12,094 (reported on 16.6% of returns)
Here:
$12,094
State:
$7,888
(% of AGI for various income ranges: 21.6% for AGIs below $25k, 45.0% for AGIs $25k-50k, 248.7% for AGIs $50k-75k, 397.5% for AGIs $75k-100k, 799.0% for AGIs $100k-200k, 6600.0% for AGIs over 200k)
Net capital gain/loss in AGI: +$12,833 (reported on 17.6% of returns)
Here:
+$12,833
State:
+$23,652
(% of AGI for various income ranges: 11.6% for AGIs below $25k, 42.1% for AGIs $25k-50k, 198.7% for AGIs $50k-75k, 491.2% for AGIs $75k-100k, 781.0% for AGIs $100k-200k, 8483.3% for AGIs over 200k)
Profit/loss from business: +$11,935 (reported on 19.8% of returns)
Here:
+$11,935
State:
+$11,710
(% of AGI for various income ranges: 187.6% for AGIs below $25k, 321.6% for AGIs $25k-50k, 266.7% for AGIs $50k-75k, 255.0% for AGIs $75k-100k, 1652.0% for AGIs $100k-200k)
Taxable individual retirement arrangement distribution: $28,620 (reported on 10.7% of returns)
28756:
$28,620
North Carolina:
$20,247
(% of AGI for various income ranges: 70.8% for AGIs below $25k, 120.3% for AGIs $25k-50k, 362.0% for AGIs $50k-75k, 862.5% for AGIs $75k-100k, 1561.0% for AGIs $100k-200k, 7063.3% for AGIs over 200k)
Total itemized deductions: $36,189 (reported on 4.8% of returns)
Here:
$36,189
State:
$34,549
(% of AGI for various income ranges: 193.4% for AGIs $25k-50k, 1192.0% for AGIs $100k-200k, 4433.3% for AGIs over 200k)
Charity contributions: $11,575 (reported on 4.3% of returns)
Here:
$11,575
State:
$13,360
(% of AGI for various income ranges: 40.8% for AGIs $25k-50k, 398.0% for AGIs $100k-200k, 1243.3% for AGIs over 200k)
Taxes paid: $7,989 (reported on 4.8% of returns)
28756:
$7,989
State:
$7,586
(% of AGI for various income ranges: 39.2% for AGIs $25k-50k, 270.0% for AGIs $100k-200k, 1000.0% for AGIs over 200k)
Earned income credit: $2,369 (reported on 20.9% of returns)
Here:
$2,369
State:
$2,337
(% of AGI for various income ranges: 118.0% for AGIs below $25k, 87.9% for AGIs $25k-50k)
Percentage of individuals using paid preparers for their 2020 taxes: 92.0%
Here:
92%
State:
93%
(% for various income ranges: 90.1% for AGIs below $25k, 94.1% for AGIs $25k-50k, 95.7% for AGIs $50k-75k, 92.9% for AGIs $75k-100k, 90.0% for AGIs $100k-200k, 87.5% for AGIs over 200k)
Averages for the 2012 tax year for zip code 28756, filed in 2013:
Average Adjusted Gross Income (AGI) in 2012: $42,028 (Individual Income Tax Returns)
Here:
$42,028
State:
$54,937
Salary/wage: $35,974 (reported on 79.8% of returns)
Here:
$35,974
State:
$46,336
(% of AGI for various income ranges: 75.8% for AGIs below $25k, 75.5% for AGIs $25k-50k, 72.8% for AGIs $50k-75k, 65.2% for AGIs $75k-100k, 50.8% for AGIs $100k-200k, 75.0% for AGIs over 200k)
Taxable interest for individuals: $1,104 (reported on 31.9% of returns)
This zip code:
$1,104
North Carolina:
$1,298
(% of AGI for various income ranges: 1.1% for AGIs below $25k, 0.8% for AGIs $25k-50k, 0.3% for AGIs $50k-75k, 0.7% for AGIs $75k-100k, 1.2% for AGIs $100k-200k, 0.8% for AGIs over 200k)
Ordinary dividends: $4,243 (reported on 14.1% of returns)
Here:
$4,243
State:
$6,213
(% of AGI for various income ranges: 1.5% for AGIs below $25k, 1.3% for AGIs $25k-50k, 0.4% for AGIs $50k-75k, 2.7% for AGIs $75k-100k, 2.4% for AGIs $100k-200k)
Net capital gain/loss in AGI: +$3,575 (reported on 12.3% of returns)
Here:
+$3,575
State:
+$12,740
(% of AGI for various income ranges: 0.6% for AGIs $25k-50k, 3.1% for AGIs $75k-100k, 2.8% for AGIs $100k-200k)
Profit/loss from business: +$12,165 (reported on 20.9% of returns)
Here:
+$12,165
State:
+$10,311
(% of AGI for various income ranges: 8.7% for AGIs below $25k, 6.1% for AGIs $25k-50k, 4.7% for AGIs $50k-75k, 6.4% for AGIs $75k-100k, 8.5% for AGIs $100k-200k)
Taxable individual retirement arrangement distribution: $15,200 (reported on 11.7% of returns)
28756:
$15,200
North Carolina:
$15,575
(% of AGI for various income ranges: 2.4% for AGIs below $25k, 3.6% for AGIs $25k-50k, 3.5% for AGIs $50k-75k, 5.9% for AGIs $75k-100k, 7.9% for AGIs $100k-200k)
Total itemized deductions: $22,982 (26% of AGI, reported on 23.9% of returns)
Here:
$22,982
State:
$23,438
Here:
25.7% of AGI
State:
21.5% of AGI
(% of AGI for various income ranges: 8.2% for AGIs below $25k, 10.4% for AGIs $25k-50k, 12.1% for AGIs $50k-75k, 13.9% for AGIs $75k-100k, 15.6% for AGIs $100k-200k, 19.3% for AGIs over 200k)
Charity contributions: $4,987 (reported on 19.0% of returns)
Here:
$4,987
State:
$4,687
(% of AGI for various income ranges: 1.2% for AGIs below $25k, 2.2% for AGIs $25k-50k, 2.1% for AGIs $50k-75k, 2.3% for AGIs $75k-100k, 3.3% for AGIs $100k-200k, 1.9% for AGIs over 200k)
Taxes paid: $8,068 (reported on 23.3% of returns)
28756:
$8,068
State:
$8,823
(% of AGI for various income ranges: 1.1% for AGIs below $25k, 2.0% for AGIs $25k-50k, 3.1% for AGIs $50k-75k, 4.5% for AGIs $75k-100k, 5.9% for AGIs $100k-200k, 11.7% for AGIs over 200k)
Earned income credit: $2,321 (reported on 26.4% of returns)
Here:
$2,321
State:
$2,376
(% of AGI for various income ranges: 7.9% for AGIs below $25k, 1.6% for AGIs $25k-50k)
Percentage of individuals using paid preparers for their 2012 taxes: 62.0%
Here:
62%
State:
53%
(% for various income ranges: 59.5% for AGIs below $25k, 62.5% for AGIs $25k-50k, 70.0% for AGIs $50k-75k, 70.0% for AGIs $75k-100k, 72.7% for AGIs $100k-200k)
Averages for the 2004 tax year for zip code 28756, filed in 2005:
Average Adjusted Gross Income (AGI) in 2004: $33,849 (Individual Income Tax Returns)
Here:
$33,849
State:
$45,376
Salary/wage: $31,004 (reported on 84.8% of returns)
Here:
$31,004
State:
$39,442
(% of AGI for various income ranges: 107.1% for AGIs below $10k, 78.5% for AGIs $10k-25k, 82.6% for AGIs $25k-50k, 79.5% for AGIs $50k-75k, 82.1% for AGIs $75k-100k, 62.9% for AGIs over 100k)
Taxable interest for individuals: $1,317 (reported on 35.6% of returns)
This zip code:
$1,317
North Carolina:
$1,515
(% of AGI for various income ranges: 6.0% for AGIs below $10k, 1.6% for AGIs $10k-25k, 1.5% for AGIs $25k-50k, 1.4% for AGIs $50k-75k, 0.8% for AGIs $75k-100k, 0.9% for AGIs over 100k)
Taxable dividends: $2,537 (reported on 12.1% of returns)
Here:
$2,537
State:
$4,016
(% of AGI for various income ranges: 2.4% for AGIs below $10k, 0.7% for AGIs $10k-25k, 1.2% for AGIs $25k-50k, 0.3% for AGIs $50k-75k, 0.7% for AGIs $75k-100k, 1.2% for AGIs over 100k)
Net capital gain/loss: +$8,188 (reported on 11.5% of returns)
Here:
+$8,188
State:
+$11,152
(% of AGI for various income ranges: -1.8% for AGIs below $10k, 0.3% for AGIs $10k-25k, 0.9% for AGIs $25k-50k, 2.0% for AGIs $50k-75k, 3.2% for AGIs $75k-100k, 8.3% for AGIs over 100k)
Profit/loss from business: +$7,204 (reported on 21.2% of returns)
Here:
+$7,204
State:
+$9,490
(% of AGI for various income ranges: 0.9% for AGIs below $10k, 8.6% for AGIs $10k-25k, 5.3% for AGIs $25k-50k, 3.6% for AGIs $50k-75k, 1.0% for AGIs $75k-100k, 3.8% for AGIs over 100k)
IRA payment deduction: $3,133 (reported on 1.9% of returns)
28756:
$3,133
North Carolina:
$2,967
Total itemized deductions: $17,792 (25% of AGI, reported on 23.6% of returns)
Here:
$17,792
State:
$19,464
Here:
24.9% of AGI
State:
22.7% of AGI
(% of AGI for various income ranges: 6.2% for AGIs $10k-25k, 10.3% for AGIs $25k-50k, 14.3% for AGIs $50k-75k, 16.4% for AGIs $75k-100k, 17.0% for AGIs over 100k)
Charity contributions deductions: $3,782 (5% of AGI, reported on 20.1% of returns)
Here:
$3,782
State:
$4,035
Here:
5.0% of AGI
State:
4.5% of AGI
(% of AGI for various income ranges: 0.8% for AGIs $10k-25k, 1.7% for AGIs $25k-50k, 2.9% for AGIs $50k-75k, 3.1% for AGIs $75k-100k, 3.1% for AGIs over 100k)
Total tax: $4,300 (reported on 69.4% of returns)
28756:
$4,300
State:
$7,257
(% of AGI for various income ranges: 3.7% for AGIs below $10k, 4.1% for AGIs $10k-25k, 6.0% for AGIs $25k-50k, 8.1% for AGIs $50k-75k, 9.4% for AGIs $75k-100k, 17.0% for AGIs over 100k)
Earned income credit: $1,781 (reported on 24.1% of returns)
Here:
$1,781
State:
$1,851
Percentage of individuals using paid preparers for their 2004 taxes: 70.6%
Here:
71%
State:
62%
(% for various income ranges: 66.2% for AGIs below $10k, 73.0% for AGIs $10k-25k, 71.5% for AGIs $25k-50k, 74.6% for AGIs $50k-75k, 60.5% for AGIs $75k-100k, 69.8% for AGIs over 100k)
Household received Food Stamps/SNAP in the past 12 months: 228 Household did not receive Food Stamps/SNAP in the past 12 months: 1,442
Women who had a birth in the past 12 months: 122 (96 now married, 27 unmarried) Women who did not have a birth in the past 12 months: 717 (221 now married, 493 unmarried)
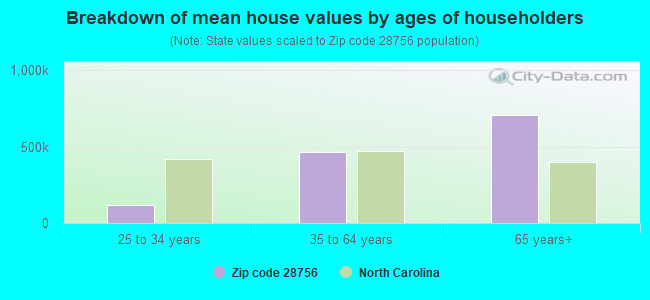
Housing units in zip code 28756 with a mortgage: 478 (19 second mortgage, 20 both second mortgage and home equity loan) Median monthly owner costs for units with a mortgage: $1,020 Median monthly owner costs for units without a mortgage: $447
Residents with income below the poverty level in 2022:
This zip code:
10.2%
Whole state:
12.8%
Residents with income below 50% of the poverty level in 2022:
This zip code:
7.5%
Whole state:
6.8%
Median number of rooms in houses and condos:
Here:
6.2
State:
6.4
Median number of rooms in apartments:
Here:
4.1
State:
4.4
Notable locations in this zip code not listed on our city pages
Churches in zip code 28756 include: Lebanon Church (A), Big Level Church (B), Mountain View Church (C), New Zion Church (D), Stony Knoll Church (E), Faith Church (F), Faith Temple (G), Victory Church (H), Cooper Gap Church (I). Display/hide their locations on the map
Creeks: Britten Creek (A), Canal Creek (B), Brights Creek (C), Ostin Creek (D), Walnut Creek (E), South Branch Little White Oak Creek (F), Silver Creek (G), Rotten Creek (H), Rash Creek (I). Display/hide their locations on the map
In group quarters: 37 (-1 institutionalized population)
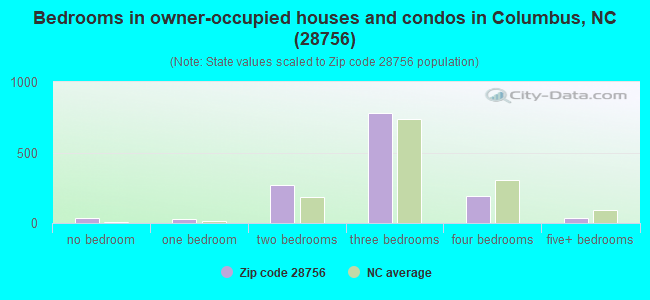
Size of family households: 756 2-persons, 227 3-persons, 125 4-persons, 55 5-persons, 72 6-persons, 24 7-or-more-persons
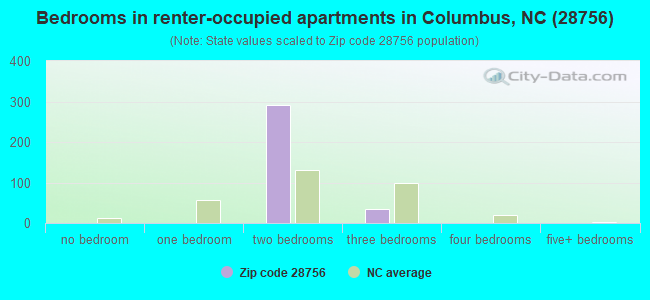
Size of nonfamily households: 319 1-person, 101 2-persons
577 married couples with children.
280 single-parent households (25 men, 255 women).
88.6% of residents of 28756 zip code speak English at home.
10.7% of residents speak Spanish at home (80% very well, 10% well, 10% not at all).
0.9% of residents speak other Indo-European language at home (42% not well, 58% not at all).
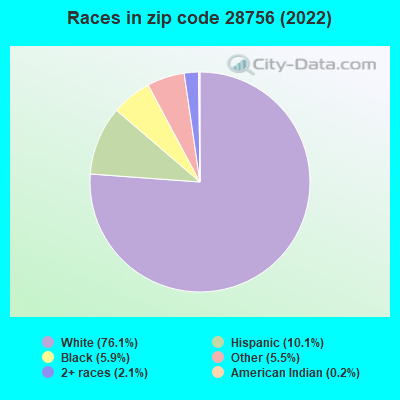
Foreign born population: 233 (5.4%) (83.4% of them are naturalized citizens)
This zip code:
5.4%
Whole state:
8.6%
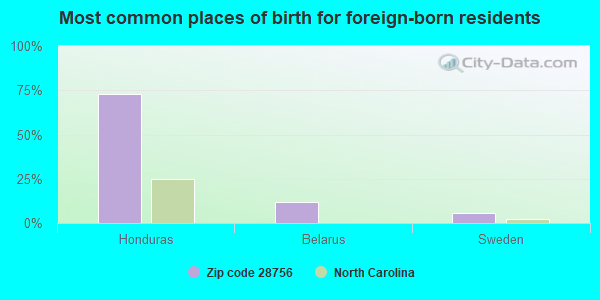
73%Honduras
12%Belarus
6%Sweden
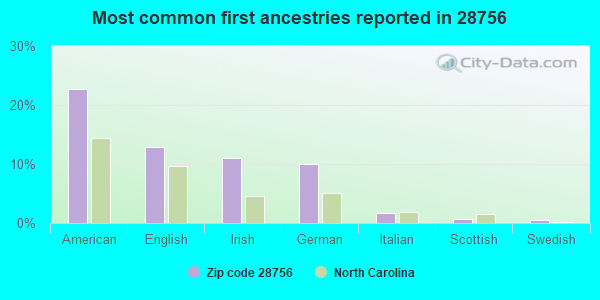
23%American
13%English
11%Irish
10%German
2%Italian
1%Scottish
1%Swedish
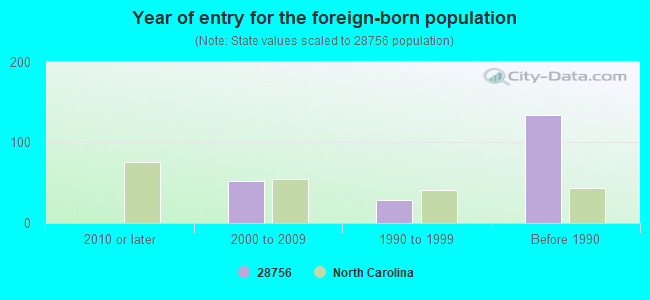
Year of entry for the foreign-born population
02010 or later
522000 to 2009
291990 to 1999
134Before 1990
Facilities with environmental interests located in this zip code:
A & L LUMBER CO., INC. (PO BOX 245 in MILL SPRING, NC)
STATE MASTER (North Carolina facility info) - -66AN2CF0001ANWA489NRG99VE5, WASTEWATER FACILITY National Pollutant Discharge Elimination System NON-MAJOR (Tracking pollutant discharge elimination systems) - permit Business SIC classification: SAWMILLS AND PLANING MILLS, GENERAL
A & L LUMBER CO INC (206 WILL GREEN RD in MILL SPRING, NC)
National Pollutant Discharge Elimination System NON-MAJOR (Tracking pollutant discharge elimination systems) - permit Business SIC classification: SAWMILLS AND PLANING MILLS, GENERAL
Housing units lacking complete plumbing facilities: 5.0% Housing units lacking complete kitchen facilities: 1.5%
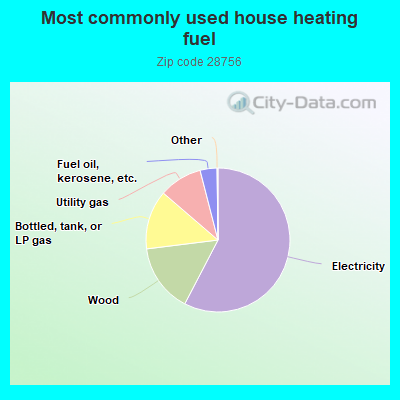
57.7%Electricity
15.4%Wood
13.3%Bottled, tank, or LP gas
9.7%Utility gas
3.8%Fuel oil, kerosene, etc.
Population in 1990: 3,075. Population change in the 1990s: +1,118 (+36.4%).
Place of birth for U.S.-born residents:
This state: 2,082
Northeast: 349
Midwest: 276
South: 1,298
West: 106
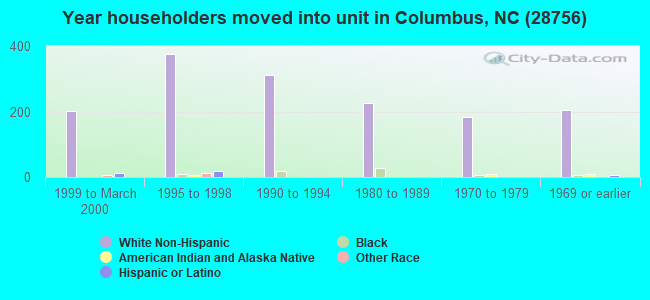
73% of the 28756 zip code residents lived in the same house 5 years ago. Out of people who lived in different houses, 54% lived in this county. Out of people who lived in different counties, 50% lived in North Carolina.
92% of the 28756 zip code residents lived in the same house 1 year ago. Out of people who lived in different houses, 40% moved from this county. Out of people who lived in different houses, 17% moved from different county within same state. Out of people who lived in different houses, 47% moved from different state.
Private vs. public school enrollment:
Students in private schools in grades 1 to 8 (elementary and middle school): 27
Here:
6.9%
North Carolina:
13.8%
Students in private schools in grades 9 to 12 (high school):
Here:
0.0%
North Carolina:
11.9%
Students in private undergraduate colleges: 11
Here:
45.3%
North Carolina:
19.3%
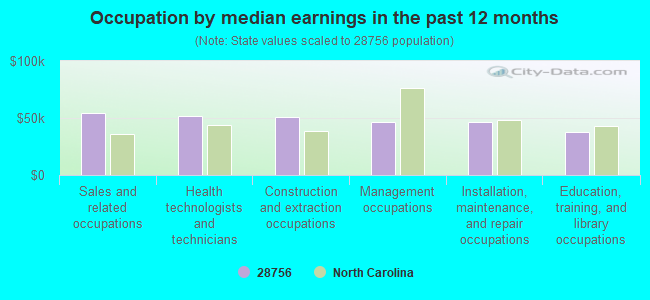
Occupation by median earnings in the past 12 months ($)
54,324Sales and related occupations
51,523Health technologists and technicians
50,448Construction and extraction occupations
46,270Management occupations
46,091Installation, maintenance, and repair occupations
37,346Education, training, and library occupations
Top industries in this zip code by the number of employees in 2005:
Health Care and Social Assistance: Residential Mental Health and Substance Abuse Facilities (50-99 employees: 1 establishment)
Health Care and Social Assistance: Other Individual and Family Services (20-49: 1)
Construction: Water and Sewer Line and Related Structures Construction (20-49: 1)
Other Services (except Public Administration): Religious Organizations (5-9: 2, 1-4: 5)
Accommodation and Food Services: Full-Service Restaurants (10-19: 1, 1-4: 1)
Construction: Framing Contractors (10-19: 1)
People in group quarters in 2010:
56 people in residential treatment centers for adults
Fatal accident statistics in 2014:
Fatal accident count: 1
Vehicles involved in fatal accidents: 1
Fatal accidents caused by drunken drivers: 0
Fatalities: 1
Persons involved in fatal accidents: 2
Pedestrians involved in fatal accidents: 0
Fatal accident statistics in 2013:
Fatal accident count: 1
Vehicles involved in fatal accidents: 2
Fatal accidents caused by drunken drivers: 0
Fatalities: 1
Persons involved in fatal accidents: 3
Pedestrians involved in fatal accidents: 0
2003 - 2018 National Fire Incident Reporting System (NFIRS) incidents
Based on the data from the years 2003 - 2018 the average number of fires per year is 39. The highest number of reported fire incidents - 66 took place in 2018, and the least - 5 in 2005. The data has a rising trend.
When looking into fire subcategories, the most reports belonged to: Structure Fires (44.8%), and Outside Fires (41.5%).
Fire incident types reported to NFIRS in Zip Code 28756

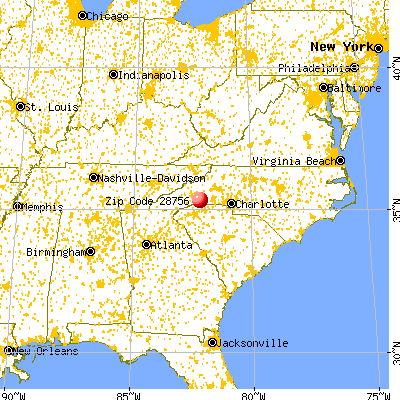


 Nearest zip codes: 28746, 28720, 28782, 28773, 28792, 28722.


 Based on the data from the years 2003 - 2018 the average number of fires per year is 39. The highest number of reported fire incidents - 66 took place in 2018, and the least - 5 in 2005. The data has a rising trend.
 When looking into fire subcategories, the most reports belonged to: Structure Fires (44.8%), and Outside Fires (41.5%).