Estimated zip code population in 2022: 2,398 Zip code population in 2010: 2,539 Zip code population in 2000: 2,766
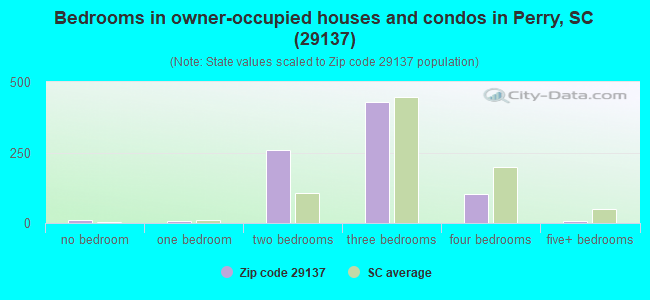
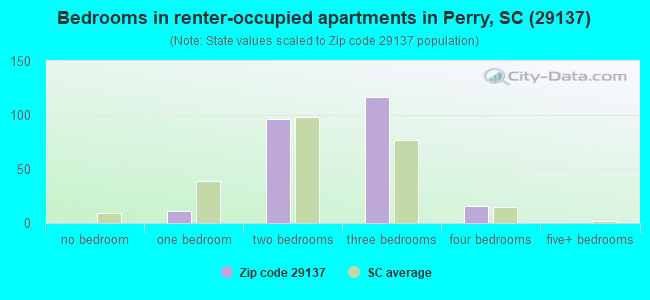
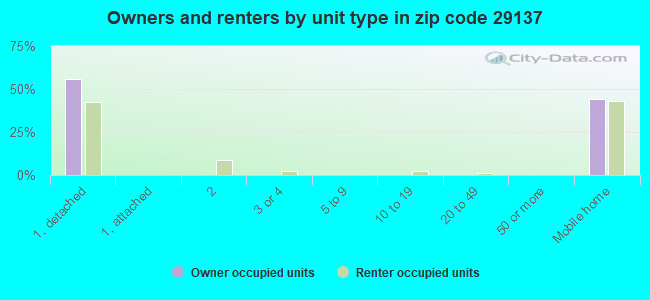
Houses and condos: 1,359 Renter-occupied apartments: 242
% of renters here:
23%
State:
28%
March 2022 cost of living index in zip code 29137: 80.4 (low, U.S. average is 100)
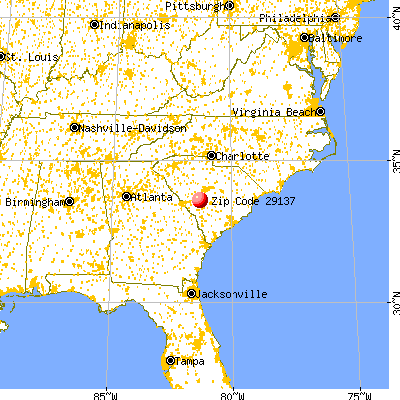
Land area: 85.2 sq. mi. Water area: 0.5 sq. mi.
Population density: 28 people per square mile
(very low).
OSM Map
General Map
Google Map
MSN Map
OSM Map
General Map
Google Map
MSN Map
OSM Map
General Map
Google Map
MSN Map
OSM Map
General Map
Google Map
MSN Map
Please wait while loading the map...
Real estate property taxes paid for housing units in 2022:
This zip code:
0.3% ($415)
South Carolina:
0.5% ($1,185)
Median real estate property taxes paid for housing units with mortgages in 2022: $692 (0.5%) Median real estate property taxes paid for housing units with no mortgage in 2022: $314 (0.5%)
Business Search- 14 Million verified businesses
Males: 1,165
(48.6%)
Females: 1,233
(51.4%)
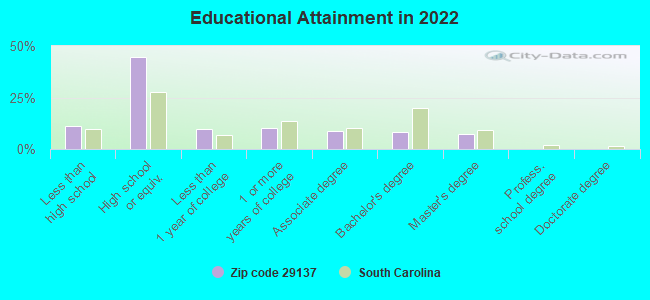
For population 25 years and over in 29137:
High school or higher: 87.7%
Bachelor's degree or higher: 15.6%
Graduate or professional degree: 7.2%
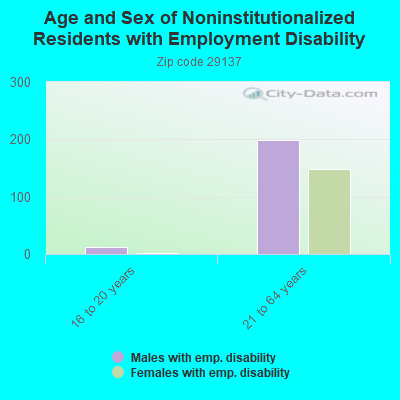
Unemployed: 6.8%
Mean travel time to work (commute): 40.9 minutes
For population 15 years and over in 29137:
Never married: 25.9%
Now married: 49.6%
Separated: 4.2%
Widowed: 11.0%
Divorced: 9.3%
Zip code 29137 compared to state average:
Median household income below state average.
Median house value below state average.
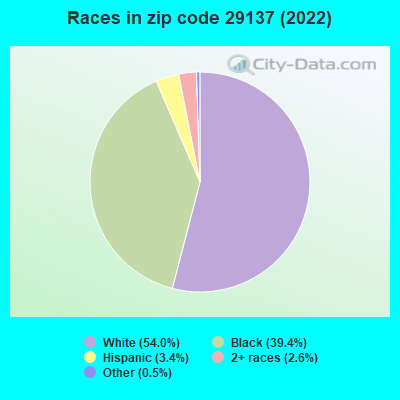
Hispanic race population percentage below state average.
Median age above state average.
Foreign-born population percentage significantly below state average.
Length of stay since moving in significantly above state average.
Number of college students below state average.
Percentage of population with a bachelor's degree or higher below state average.
Estimated median house/condo value in 2022: $137,192
29137:
$137,192
South Carolina:
$254,600
According to our research of South Carolina and other state lists, there were 3 registered sex offenders living in 29137 zip code as of May 28, 2024. The ratio of all residents to sex offenders in zip code 29137 is 700 to 1.
Median resident age:
This zip code:
45.9 years
South Carolina median age:
40.5 years
Average household size:
This zip code:
2.3 people
South Carolina:
2.4 people
Averages for the 2020 tax year for zip code 29137, filed in 2021:
Average Adjusted Gross Income (AGI) in 2020: $41,881 (Individual Income Tax Returns)
Here:
$41,881
State:
$65,754
Salary/wage: $38,059 (reported on 82.6% of returns)
Here:
$38,059
State:
$52,566
(% of AGI for various income ranges: 1240.9% for AGIs below $25k, 3998.4% for AGIs $25k-50k, 7095.0% for AGIs $50k-75k, 10402.5% for AGIs $75k-100k, 22575.0% for AGIs $100k-200k)
Taxable interest for individuals: $562 (reported on 14.7% of returns)
This zip code:
$562
South Carolina:
$1,749
(% of AGI for various income ranges: 11.2% for AGIs below $25k, 7.2% for AGIs $25k-50k, 24.0% for AGIs $50k-75k, 30.0% for AGIs $100k-200k)
Ordinary dividends: $2,000 (reported on 7.3% of returns)
Here:
$2,000
State:
$8,783
(% of AGI for various income ranges: 40.0% for AGIs $25k-50k, 150.0% for AGIs $75k-100k)
Net capital gain/loss in AGI: +$4,829 (reported on 6.4% of returns)
Here:
+$4,829
State:
+$24,194
(% of AGI for various income ranges: 24.0% for AGIs $25k-50k, 695.0% for AGIs $75k-100k)
Profit/loss from business: +$7,163 (reported on 17.4% of returns)
Here:
+$7,163
State:
+$11,253
(% of AGI for various income ranges: 136.6% for AGIs below $25k, 245.2% for AGIs $25k-50k, 777.5% for AGIs $75k-100k)
Taxable individual retirement arrangement distribution: $14,743 (reported on 6.4% of returns)
29137:
$14,743
South Carolina:
$21,604
(% of AGI for various income ranges: 139.6% for AGIs $25k-50k, 683.0% for AGIs $50k-75k)
Total itemized deductions: $38,550 (reported on 1.8% of returns)
Here:
$38,550
State:
$35,199
(% of AGI for various income ranges: 771.0% for AGIs $50k-75k)
Taxes paid: $5,600 (reported on 1.8% of returns)
29137:
$5,600
State:
$7,486
(% of AGI for various income ranges: 112.0% for AGIs $50k-75k)
Earned income credit: $2,588 (reported on 30.3% of returns)
Here:
$2,588
State:
$2,397
(% of AGI for various income ranges: 184.1% for AGIs below $25k, 106.0% for AGIs $25k-50k)
Percentage of individuals using paid preparers for their 2020 taxes: 94.5%
Here:
94%
State:
93%
(% for various income ranges: 95.6% for AGIs below $25k, 94.1% for AGIs $25k-50k, 93.3% for AGIs $50k-75k, 100.0% for AGIs $75k-100k, 88.9% for AGIs $100k-200k)
Averages for the 2012 tax year for zip code 29137, filed in 2013:
Average Adjusted Gross Income (AGI) in 2012: $33,617 (Individual Income Tax Returns)
Here:
$33,617
State:
$51,133
Salary/wage: $30,649 (reported on 83.7% of returns)
Here:
$30,649
State:
$42,173
(% of AGI for various income ranges: 74.6% for AGIs below $25k, 82.5% for AGIs $25k-50k, 77.7% for AGIs $50k-75k, 78.6% for AGIs $75k-100k, 62.9% for AGIs $100k-200k)
Taxable interest for individuals: $588 (reported on 17.3% of returns)
This zip code:
$588
South Carolina:
$1,468
(% of AGI for various income ranges: 0.7% for AGIs below $25k, 0.3% for AGIs $25k-50k, 0.3% for AGIs $50k-75k, 0.2% for AGIs $75k-100k)
Ordinary dividends: $1,300 (reported on 8.2% of returns)
Here:
$1,300
State:
$6,511
Profit/loss from business: +$6,987 (reported on 15.3% of returns)
Here:
+$6,987
State:
+$10,167
(% of AGI for various income ranges: 9.9% for AGIs below $25k, 3.2% for AGIs $25k-50k, 1.3% for AGIs $50k-75k)
Taxable individual retirement arrangement distribution: $14,133 (reported on 6.1% of returns)
29137:
$14,133
South Carolina:
$17,019
Total itemized deductions: $16,636 (24% of AGI, reported on 14.3% of returns)
Here:
$16,636
State:
$22,890
Here:
23.8% of AGI
State:
21.4% of AGI
(% of AGI for various income ranges: 6.7% for AGIs $25k-50k, 10.0% for AGIs $50k-75k, 9.1% for AGIs $75k-100k, 11.2% for AGIs $100k-200k)
Charity contributions: $4,008 (reported on 12.2% of returns)
Here:
$4,008
State:
$5,169
(% of AGI for various income ranges: 1.5% for AGIs $25k-50k, 2.3% for AGIs $50k-75k, 1.7% for AGIs $75k-100k, 1.9% for AGIs $100k-200k)
Taxes paid: $4,721 (reported on 14.3% of returns)
29137:
$4,721
State:
$7,644
(% of AGI for various income ranges: 1.1% for AGIs $25k-50k, 2.3% for AGIs $50k-75k, 3.0% for AGIs $75k-100k, 5.0% for AGIs $100k-200k)
Earned income credit: $2,730 (reported on 33.7% of returns)
Here:
$2,730
State:
$2,418
(% of AGI for various income ranges: 11.2% for AGIs below $25k, 1.6% for AGIs $25k-50k)
Percentage of individuals using paid preparers for their 2012 taxes: 70.4%
Here:
70%
State:
57%
(% for various income ranges: 67.3% for AGIs below $25k, 71.4% for AGIs $25k-50k, 81.8% for AGIs $50k-75k, 66.7% for AGIs $75k-100k, 75.0% for AGIs $100k-200k)
Averages for the 2004 tax year for zip code 29137, filed in 2005:
Average Adjusted Gross Income (AGI) in 2004: $29,471 (Individual Income Tax Returns)
Here:
$29,471
State:
$41,965
Salary/wage: $27,981 (reported on 85.7% of returns)
Here:
$27,981
State:
$35,695
(% of AGI for various income ranges: 77.1% for AGIs below $10k, 81.1% for AGIs $10k-25k, 87.8% for AGIs $25k-50k, 87.7% for AGIs $50k-75k, 83.2% for AGIs $75k-100k, 49.7% for AGIs over 100k)
Taxable interest for individuals: $918 (reported on 24.3% of returns)
This zip code:
$918
South Carolina:
$1,623
(% of AGI for various income ranges: 1.7% for AGIs below $10k, 1.3% for AGIs $10k-25k, 0.8% for AGIs $25k-50k, 0.5% for AGIs $50k-75k, 0.2% for AGIs $75k-100k, 0.3% for AGIs over 100k)
Taxable dividends: $1,125 (reported on 8.4% of returns)
Here:
$1,125
State:
$3,999
(% of AGI for various income ranges: 0.2% for AGIs $10k-25k, 0.2% for AGIs $25k-50k, 0.4% for AGIs $50k-75k, 1.0% for AGIs $75k-100k)
Net capital gain/loss: +$10,293 (reported on 6.1% of returns)
Here:
+$10,293
State:
+$13,100
Profit/loss from business: +$2,318 (reported on 13.8% of returns)
Here:
+$2,318
State:
+$9,144
(% of AGI for various income ranges: 8.6% for AGIs below $10k, 4.0% for AGIs $10k-25k, 0.0% for AGIs $25k-50k, -0.3% for AGIs $50k-75k, -0.5% for AGIs $75k-100k)
Total itemized deductions: $14,689 (23% of AGI, reported on 17.1% of returns)
Here:
$14,689
State:
$19,039
Here:
23.5% of AGI
State:
22.8% of AGI
(% of AGI for various income ranges: 2.7% for AGIs $10k-25k, 8.5% for AGIs $25k-50k, 10.3% for AGIs $50k-75k, 15.1% for AGIs $75k-100k, 12.6% for AGIs over 100k)
Charity contributions deductions: $3,310 (5% of AGI, reported on 15.1% of returns)
Here:
$3,310
State:
$4,305
Here:
5.2% of AGI
State:
5.0% of AGI
(% of AGI for various income ranges: 0.5% for AGIs $10k-25k, 1.7% for AGIs $25k-50k, 2.2% for AGIs $50k-75k, 3.1% for AGIs $75k-100k, 2.1% for AGIs over 100k)
Total tax: $3,341 (reported on 64.6% of returns)
29137:
$3,341
State:
$6,497
(% of AGI for various income ranges: 2.9% for AGIs below $10k, 2.8% for AGIs $10k-25k, 6.4% for AGIs $25k-50k, 8.7% for AGIs $50k-75k, 10.5% for AGIs $75k-100k, 14.5% for AGIs over 100k)
Earned income credit: $2,052 (reported on 33.9% of returns)
Here:
$2,052
State:
$1,882
Percentage of individuals using paid preparers for their 2004 taxes: 79.4%
Here:
79%
State:
66%
(% for various income ranges: 75.8% for AGIs below $10k, 78.9% for AGIs $10k-25k, 81.9% for AGIs $25k-50k, 80.8% for AGIs $50k-75k, 82.5% for AGIs $75k-100k, 81.8% for AGIs over 100k)
Household received Food Stamps/SNAP in the past 12 months: 267 Household did not receive Food Stamps/SNAP in the past 12 months: 803
Women who had a birth in the past 12 months: 13 (0 now married, 11 unmarried) Women who did not have a birth in the past 12 months: 519 (204 now married, 314 unmarried)
Housing units in zip code 29137 with a mortgage: 317 (6 second mortgage, 6 both second mortgage and home equity loan) Median monthly owner costs for units with a mortgage: $1,422 Median monthly owner costs for units without a mortgage: $312
Residents with income below the poverty level in 2022:
This zip code:
32.0%
Whole state:
14.0%
Residents with income below 50% of the poverty level in 2022:
This zip code:
14.9%
Whole state:
7.3%
Median number of rooms in houses and condos:
Here:
5.5
State:
6.4
Median number of rooms in apartments:
Here:
5.1
State:
4.5
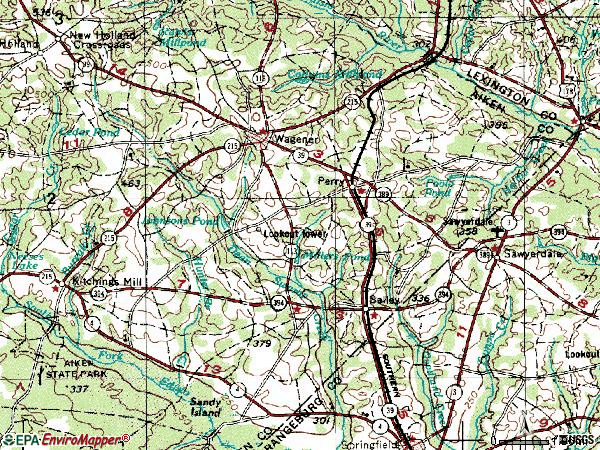
Notable locations in this zip code not listed on our city pages
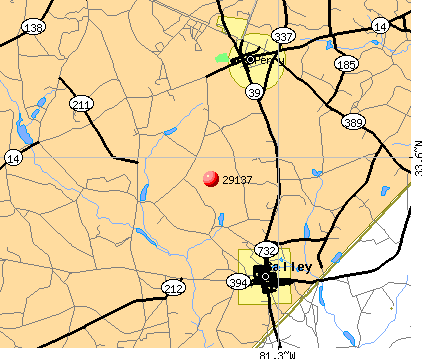
Notable locations in zip code 29137: Walling Poultry Farm (A), Hollow Creek Fire Department (B), Salley Volunteer Fire Department (C). Display/hide their locations on the map
Churches in zip code 29137 include: New Mount Hermon Church (A), Clinton Church (B), Corinth Church (C), Union Church (D), Rocky Grove Baptist Church (E). Display/hide their locations on the map
In group quarters: 3 (-1 institutionalized population)
Size of family households: 334 2-persons, 82 3-persons, 127 4-persons, 72 5-persons, 3 6-persons, 11 7-or-more-persons
Size of nonfamily households: 385 1-person, 47 2-persons
162 married couples with children.
285 single-parent households (137 men, 148 women).
97.6% of residents of 29137 zip code speak English at home.
2.3% of residents speak Spanish at home (100% very well).
Foreign born population: 19 (0.8%) (90.3% of them are naturalized citizens)
This zip code:
0.8%
Whole state:
5.2%
78%France
17%El Salvador
6%Malaysia
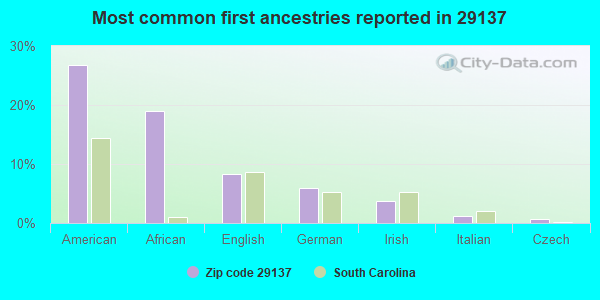
27%American
19%African
8%English
6%German
4%Irish
1%Italian
1%Czech
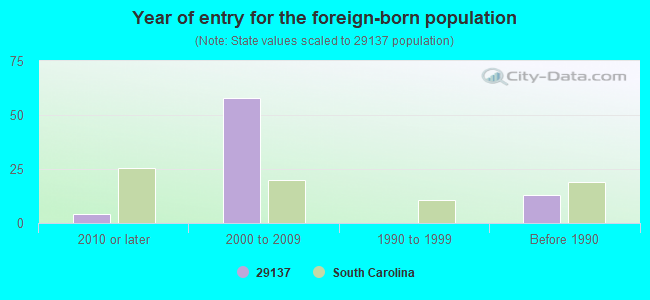
Year of entry for the foreign-born population
42010 or later
582000 to 2009
01990 to 1999
13Before 1990
Housing units lacking complete plumbing facilities: 7.9% Housing units lacking complete kitchen facilities: 9.6%
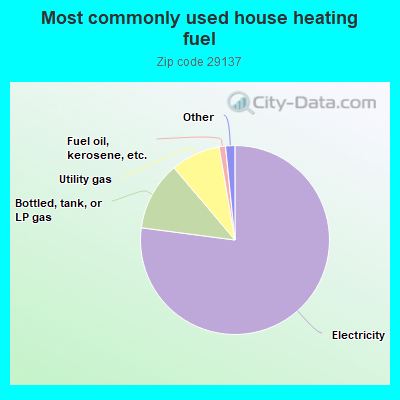
77.3%Electricity
11.8%Bottled, tank, or LP gas
8.5%Utility gas
1.1%Fuel oil, kerosene, etc.
0.9%No fuel used
0.8%Other fuel
Population in 1990: 2,537. Population change in the 1990s: +229 (+9.0%).
Place of birth for U.S.-born residents:
This state: 1,682
Northeast: 224
Midwest: 58
South: 265
West: 68
76% of the 29137 zip code residents lived in the same house 5 years ago. Out of people who lived in different houses, 62% lived in this county. Out of people who lived in different counties, 50% lived in South Carolina.
91% of the 29137 zip code residents lived in the same house 1 year ago. Out of people who lived in different houses, 8% moved from this county. Out of people who lived in different houses, 20% moved from different county within same state. Out of people who lived in different houses, 85% moved from different state.
Private vs. public school enrollment:
Students in private schools in grades 1 to 8 (elementary and middle school): 17
Here:
6.4%
South Carolina:
14.4%
Students in private schools in grades 9 to 12 (high school): 2
Here:
1.6%
South Carolina:
11.1%
Students in private undergraduate colleges:
Here:
0.0%
South Carolina:
21.9%
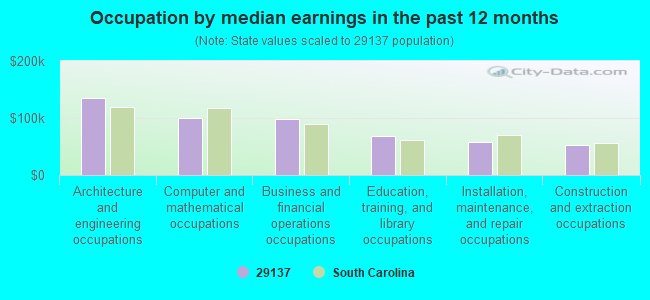
Occupation by median earnings in the past 12 months ($)
134,909Architecture and engineering occupations
99,623Computer and mathematical occupations
99,065Business and financial operations occupations
68,101Education, training, and library occupations
58,674Installation, maintenance, and repair occupations
52,479Construction and extraction occupations
Top industries in this zip code by the number of employees in 2005:
Educational Services: Elementary and Secondary Schools (100-249 employees: 1 establishment)
Administrative and Support and Waste Management and Remediation Services: Landscaping Services (10-19: 1)
Other Services (except Public Administration): Religious Organizations (1-4: 3)
Finance and Insurance: Commercial Banking (1-4: 1)
Construction: Plumbing, Heating, and Air-Conditioning Contractors (1-4: 1)
Construction: Siding Contractors (1-4: 1)
Real Estate and Rental and Leasing: Offices of Real Estate Agents and Brokers (1-4: 1)
Fatal accident statistics in 2014:
Fatal accident count: 2
Vehicles involved in fatal accidents: 2
Fatal accidents caused by drunken drivers: 1
Fatalities: 2
Persons involved in fatal accidents: 2
Pedestrians involved in fatal accidents: 0
Fatal accident statistics in 2013:
Fatal accident count: 1
Vehicles involved in fatal accidents: 1
Fatal accidents caused by drunken drivers: 0
Fatalities: 1
Persons involved in fatal accidents: 1
Pedestrians involved in fatal accidents: 0
Home Mortgage Disclosure Act Aggregated Statistics For Year 2009 (Based on 4 partial tracts)
A) FHA, FSA/RHS & VA Home Purchase Loans
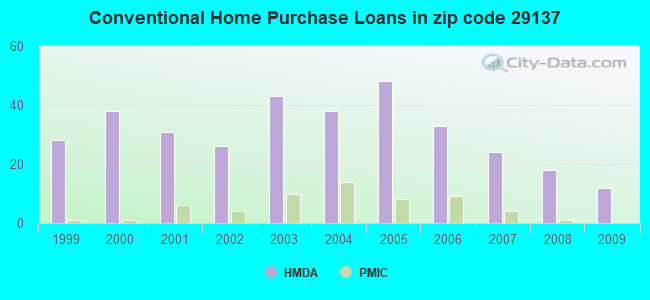
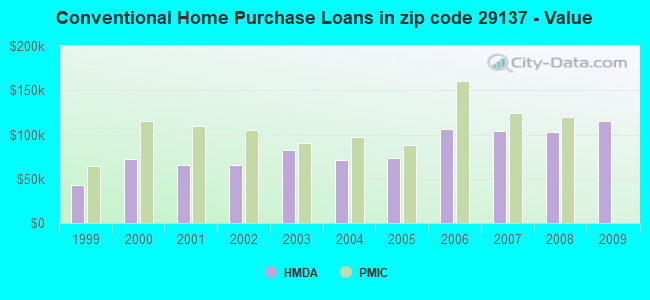
B) Conventional Home Purchase Loans
C) Refinancings
D) Home Improvement Loans
F) Non-occupant Loans on < 5 Family Dwellings (A B C & D)
G) Loans On Manufactured Home Dwelling (A B C & D)
Number
Average Value
Number
Average Value
Number
Average Value
Number
Average Value
Number
Average Value
Number
Average Value
LOANS ORIGINATED
3
$127,610
12
$115,792
42
$128,352
3
$191,737
6
$51,723
5
$47,778
APPLICATIONS APPROVED, NOT ACCEPTED
0
$0
2
$53,815
13
$130,135
3
$33,690
1
$62,420
5
$65,504
APPLICATIONS DENIED
1
$136,850
10
$52,487
31
$121,110
3
$21,127
0
$0
13
$68,498
APPLICATIONS WITHDRAWN
2
$137,925
1
$188,670
14
$200,451
0
$0
0
$0
5
$76,036
FILES CLOSED FOR INCOMPLETENESS
0
$0
0
$0
3
$368,287
1
$39,880
0
$0
0
$0
Aggregated Statistics For Year 2008 (Based on 4 partial tracts)
A) FHA, FSA/RHS & VA Home Purchase Loans
B) Conventional Home Purchase Loans
C) Refinancings
D) Home Improvement Loans
F) Non-occupant Loans on < 5 Family Dwellings (A B C & D)
G) Loans On Manufactured Home Dwelling (A B C & D)
Number
Average Value
Number
Average Value
Number
Average Value
Number
Average Value
Number
Average Value
Number
Average Value
LOANS ORIGINATED
1
$73,690
18
$102,834
45
$103,341
7
$33,783
9
$64,943
18
$45,051
APPLICATIONS APPROVED, NOT ACCEPTED
0
$0
6
$90,755
5
$116,854
1
$14,360
1
$44,660
6
$83,737
APPLICATIONS DENIED
2
$171,370
19
$84,436
33
$97,438
9
$66,104
3
$52,017
16
$55,491
APPLICATIONS WITHDRAWN
0
$0
2
$100,325
15
$118,474
4
$138,320
2
$77,205
0
$0
FILES CLOSED FOR INCOMPLETENESS
0
$0
0
$0
5
$90,350
0
$0
1
$15,600
1
$61,000
Aggregated Statistics For Year 2007 (Based on 4 partial tracts)
A) FHA, FSA/RHS & VA Home Purchase Loans
B) Conventional Home Purchase Loans
C) Refinancings
D) Home Improvement Loans
F) Non-occupant Loans on < 5 Family Dwellings (A B C & D)
G) Loans On Manufactured Home Dwelling (A B C & D)
Number
Average Value
Number
Average Value
Number
Average Value
Number
Average Value
Number
Average Value
Number
Average Value
LOANS ORIGINATED
7
$88,153
24
$104,180
37
$108,493
16
$55,037
9
$97,052
19
$51,543
APPLICATIONS APPROVED, NOT ACCEPTED
0
$0
3
$84,417
10
$104,200
7
$10,597
0
$0
2
$46,075
APPLICATIONS DENIED
1
$86,130
18
$93,098
27
$76,185
23
$57,404
1
$541,340
18
$44,972
APPLICATIONS WITHDRAWN
0
$0
4
$74,200
13
$134,099
5
$50,352
1
$23,930
4
$56,332
FILES CLOSED FOR INCOMPLETENESS
0
$0
0
$0
1
$108,460
0
$0
0
$0
0
$0
Aggregated Statistics For Year 2006 (Based on 4 partial tracts)
A) FHA, FSA/RHS & VA Home Purchase Loans
B) Conventional Home Purchase Loans
C) Refinancings
D) Home Improvement Loans
F) Non-occupant Loans on < 5 Family Dwellings (A B C & D)
G) Loans On Manufactured Home Dwelling (A B C & D)
Number
Average Value
Number
Average Value
Number
Average Value
Number
Average Value
Number
Average Value
Number
Average Value
LOANS ORIGINATED
3
$79,520
33
$106,398
41
$88,160
6
$44,042
8
$62,178
23
$62,983
APPLICATIONS APPROVED, NOT ACCEPTED
0
$0
9
$68,790
12
$97,077
6
$22,815
0
$0
7
$47,690
APPLICATIONS DENIED
0
$0
43
$76,164
41
$86,330
24
$26,421
7
$88,391
30
$47,667
APPLICATIONS WITHDRAWN
0
$0
5
$116,238
25
$86,060
2
$55,845
1
$126,260
2
$83,915
FILES CLOSED FOR INCOMPLETENESS
0
$0
3
$124,177
3
$131,417
0
$0
0
$0
1
$185,840
Aggregated Statistics For Year 2005 (Based on 4 partial tracts)
A) FHA, FSA/RHS & VA Home Purchase Loans
B) Conventional Home Purchase Loans
C) Refinancings
D) Home Improvement Loans
F) Non-occupant Loans on < 5 Family Dwellings (A B C & D)
G) Loans On Manufactured Home Dwelling (A B C & D)
Number
Average Value
Number
Average Value
Number
Average Value
Number
Average Value
Number
Average Value
Number
Average Value
LOANS ORIGINATED
3
$74,350
48
$73,213
45
$101,452
7
$25,724
10
$82,641
19
$49,271
APPLICATIONS APPROVED, NOT ACCEPTED
0
$0
13
$76,665
10
$66,480
4
$10,255
0
$0
8
$42,976
APPLICATIONS DENIED
0
$0
24
$58,100
53
$74,470
12
$38,243
3
$76,317
34
$52,670
APPLICATIONS WITHDRAWN
0
$0
8
$78,944
19
$102,926
1
$71,460
1
$72,730
4
$49,135
FILES CLOSED FOR INCOMPLETENESS
1
$119,160
5
$94,726
3
$181,403
0
$0
0
$0
2
$73,615
Aggregated Statistics For Year 2004 (Based on 4 partial tracts)
A) FHA, FSA/RHS & VA Home Purchase Loans
B) Conventional Home Purchase Loans
C) Refinancings
D) Home Improvement Loans
F) Non-occupant Loans on < 5 Family Dwellings (A B C & D)
G) Loans On Manufactured Home Dwelling (A B C & D)
Number
Average Value
Number
Average Value
Number
Average Value
Number
Average Value
Number
Average Value
Number
Average Value
LOANS ORIGINATED
3
$59,370
38
$71,378
49
$79,770
18
$29,553
9
$69,229
26
$40,635
APPLICATIONS APPROVED, NOT ACCEPTED
0
$0
10
$94,138
13
$54,818
1
$22,010
2
$60,450
10
$62,823
APPLICATIONS DENIED
0
$0
25
$56,031
60
$70,268
10
$11,988
6
$33,932
29
$49,359
APPLICATIONS WITHDRAWN
1
$80,860
6
$95,412
26
$81,878
0
$0
0
$0
3
$39,207
FILES CLOSED FOR INCOMPLETENESS
0
$0
4
$90,248
4
$98,972
0
$0
0
$0
0
$0
Aggregated Statistics For Year 2003 (Based on 4 partial tracts)
A) FHA, FSA/RHS & VA Home Purchase Loans
B) Conventional Home Purchase Loans
C) Refinancings
D) Home Improvement Loans
F) Non-occupant Loans on < 5 Family Dwellings (A B C & D)
Number
Average Value
Number
Average Value
Number
Average Value
Number
Average Value
Number
Average Value
LOANS ORIGINATED
0
$0
43
$81,948
78
$79,464
17
$21,116
8
$67,328
APPLICATIONS APPROVED, NOT ACCEPTED
0
$0
19
$44,338
20
$78,078
1
$20,730
0
$0
APPLICATIONS DENIED
2
$45,470
43
$40,665
72
$69,912
11
$18,509
3
$35,933
APPLICATIONS WITHDRAWN
0
$0
6
$89,047
27
$65,149
1
$70,180
0
$0
FILES CLOSED FOR INCOMPLETENESS
0
$0
0
$0
3
$109,817
0
$0
0
$0
Aggregated Statistics For Year 2002 (Based on 4 partial tracts)
A) FHA, FSA/RHS & VA Home Purchase Loans
B) Conventional Home Purchase Loans
C) Refinancings
D) Home Improvement Loans
F) Non-occupant Loans on < 5 Family Dwellings (A B C & D)
Number
Average Value
Number
Average Value
Number
Average Value
Number
Average Value
Number
Average Value
LOANS ORIGINATED
2
$86,135
26
$65,280
72
$81,257
5
$21,694
3
$76,973
APPLICATIONS APPROVED, NOT ACCEPTED
0
$0
9
$45,684
13
$88,601
3
$5,673
0
$0
APPLICATIONS DENIED
0
$0
27
$49,287
62
$93,589
10
$14,893
1
$47,530
APPLICATIONS WITHDRAWN
0
$0
3
$68,917
40
$85,604
3
$7,270
2
$69,720
FILES CLOSED FOR INCOMPLETENESS
0
$0
1
$107,810
3
$69,337
1
$9,930
0
$0
Aggregated Statistics For Year 2001 (Based on 4 partial tracts)
A) FHA, FSA/RHS & VA Home Purchase Loans
B) Conventional Home Purchase Loans
C) Refinancings
D) Home Improvement Loans
F) Non-occupant Loans on < 5 Family Dwellings (A B C & D)
Number
Average Value
Number
Average Value
Number
Average Value
Number
Average Value
Number
Average Value
LOANS ORIGINATED
2
$119,725
31
$65,325
65
$66,794
10
$14,183
6
$37,758
APPLICATIONS APPROVED, NOT ACCEPTED
0
$0
15
$43,961
23
$60,783
1
$14,190
0
$0
APPLICATIONS DENIED
1
$58,700
41
$42,664
57
$67,643
12
$13,576
3
$58,210
APPLICATIONS WITHDRAWN
0
$0
4
$51,418
31
$59,754
6
$21,963
0
$0
FILES CLOSED FOR INCOMPLETENESS
0
$0
0
$0
5
$81,894
0
$0
0
$0
Aggregated Statistics For Year 2000 (Based on 4 partial tracts)
A) FHA, FSA/RHS & VA Home Purchase Loans
B) Conventional Home Purchase Loans
C) Refinancings
D) Home Improvement Loans
F) Non-occupant Loans on < 5 Family Dwellings (A B C & D)
Number
Average Value
Number
Average Value
Number
Average Value
Number
Average Value
Number
Average Value
LOANS ORIGINATED
2
$55,345
38
$72,537
41
$60,435
10
$16,183
3
$290,850
APPLICATIONS APPROVED, NOT ACCEPTED
1
$41,150
27
$41,185
20
$71,837
3
$8,167
0
$0
APPLICATIONS DENIED
3
$51,553
78
$45,044
71
$58,346
17
$28,444
2
$57,960
APPLICATIONS WITHDRAWN
0
$0
10
$38,125
21
$68,154
5
$17,268
0
$0
FILES CLOSED FOR INCOMPLETENESS
0
$0
1
$33,810
4
$62,255
0
$0
0
$0
Aggregated Statistics For Year 1999 (Based on 2 partial tracts)
A) FHA, FSA/RHS & VA Home Purchase Loans
B) Conventional Home Purchase Loans
C) Refinancings
D) Home Improvement Loans
F) Non-occupant Loans on < 5 Family Dwellings (A B C & D)
Detailed PMIC statistics for the following Tracts:0217.00
, 0218.00
2002 - 2018 National Fire Incident Reporting System (NFIRS) incidents
Based on the data from the years 2002 - 2018 the average number of fire incidents per year is 26. The highest number of reported fires - 48 took place in 2010, and the least - 4 in 2003. The data has a growing trend.
When looking into fire subcategories, the most reports belonged to: Structure Fires (43.4%), and Outside Fires (40.7%).
Fire incident types reported to NFIRS in Zip Code 29137


 Nearest zip codes: 29146, 29164, 29123, 29107, 29826, 29853.


 Based on the data from the years 2002 - 2018 the average number of fire incidents per year is 26. The highest number of reported fires - 48 took place in 2010, and the least - 4 in 2003. The data has a growing trend.
 When looking into fire subcategories, the most reports belonged to: Structure Fires (43.4%), and Outside Fires (40.7%).