Estimated zip code population in 2022: 6,168 Zip code population in 2010: 6,230 Zip code population in 2000: 6,245
Houses and condos: 4,001 Renter-occupied apartments: 592
% of renters here:
24%
State:
28%
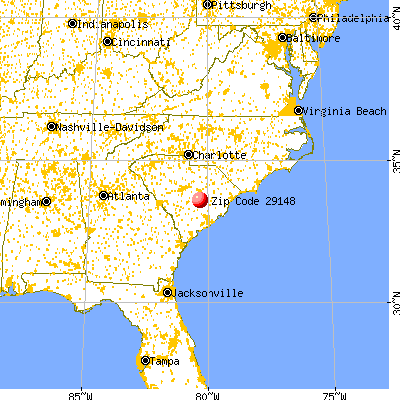
March 2022 cost of living index in zip code 29148: 79.7 (low, U.S. average is 100)
Land area: 104.0 sq. mi. Water area: 72.8 sq. mi.
Population density: 59 people per square mile
(very low).
OSM Map
General Map
Google Map
MSN Map
OSM Map
General Map
Google Map
MSN Map
OSM Map
General Map
Google Map
MSN Map
OSM Map
General Map
Google Map
MSN Map
Please wait while loading the map...
Real estate property taxes paid for housing units in 2022:
This zip code:
0.5% ($768)
South Carolina:
0.5% ($1,185)
Median real estate property taxes paid for housing units with mortgages in 2022: $834 (0.4%) Median real estate property taxes paid for housing units with no mortgage in 2022: $668 (0.5%)
Estimated median house/condo value in 2022: $158,507
29148:
$158,507
South Carolina:
$254,600
According to our research of South Carolina and other state lists, there were 2 registered sex offenders living in 29148 zip code as of May 28, 2024. The ratio of all residents to sex offenders in zip code 29148 is 3,654 to 1. The ratio of registered sex offenders to all residents in this zip code is much lower than the state average.
Median resident age:
This zip code:
53.9 years
South Carolina median age:
40.5 years
Average household size:
This zip code:
2.5 people
South Carolina:
2.4 people
Averages for the 2020 tax year for zip code 29148, filed in 2021:
Average Adjusted Gross Income (AGI) in 2020: $45,289 (Individual Income Tax Returns)
Here:
$45,289
State:
$65,754
Salary/wage: $37,177 (reported on 74.7% of returns)
Here:
$37,177
State:
$52,566
(% of AGI for various income ranges: 1290.0% for AGIs below $25k, 3761.5% for AGIs $25k-50k, 6458.0% for AGIs $50k-75k, 8852.2% for AGIs $75k-100k, 18117.0% for AGIs $100k-200k)
Taxable interest for individuals: $1,262 (reported on 23.1% of returns)
This zip code:
$1,262
South Carolina:
$1,749
(% of AGI for various income ranges: 18.6% for AGIs below $25k, 24.0% for AGIs $25k-50k, 65.5% for AGIs $50k-75k, 115.6% for AGIs $75k-100k, 199.0% for AGIs $100k-200k)
Ordinary dividends: $3,863 (reported on 12.8% of returns)
Here:
$3,863
State:
$8,783
(% of AGI for various income ranges: 18.6% for AGIs below $25k, 22.5% for AGIs $25k-50k, 72.0% for AGIs $50k-75k, 227.8% for AGIs $75k-100k, 563.0% for AGIs $100k-200k)
Net capital gain/loss in AGI: +$9,990 (reported on 10.6% of returns)
Here:
+$9,990
State:
+$24,194
(% of AGI for various income ranges: 4.2% for AGIs below $25k, 29.4% for AGIs $25k-50k, 70.5% for AGIs $50k-75k, 158.9% for AGIs $75k-100k, 939.0% for AGIs $100k-200k)
Profit/loss from business: +$9,464 (reported on 16.1% of returns)
Here:
+$9,464
State:
+$11,253
(% of AGI for various income ranges: 103.7% for AGIs below $25k, 111.2% for AGIs $25k-50k, 88.5% for AGIs $50k-75k, 170.0% for AGIs $75k-100k, 2439.0% for AGIs $100k-200k)
Taxable individual retirement arrangement distribution: $19,165 (reported on 8.4% of returns)
29148:
$19,165
South Carolina:
$21,604
(% of AGI for various income ranges: 43.5% for AGIs below $25k, 108.5% for AGIs $25k-50k, 390.0% for AGIs $50k-75k, 798.9% for AGIs $75k-100k, 2027.0% for AGIs $100k-200k)
Total itemized deductions: $31,492 (reported on 4.8% of returns)
Here:
$31,492
State:
$35,199
(% of AGI for various income ranges: 78.7% for AGIs below $25k, 399.0% for AGIs $50k-75k, 1387.0% for AGIs $100k-200k)
Charity contributions: $12,790 (reported on 3.7% of returns)
Here:
$12,790
State:
$14,319
(% of AGI for various income ranges: 121.0% for AGIs $50k-75k, 580.0% for AGIs $100k-200k)
Taxes paid: $7,246 (reported on 4.8% of returns)
29148:
$7,246
State:
$7,486
(% of AGI for various income ranges: 11.4% for AGIs below $25k, 94.0% for AGIs $50k-75k, 400.0% for AGIs $100k-200k)
Earned income credit: $2,463 (reported on 26.0% of returns)
Here:
$2,463
State:
$2,397
(% of AGI for various income ranges: 159.9% for AGIs below $25k, 87.9% for AGIs $25k-50k)
Percentage of individuals using paid preparers for their 2020 taxes: 92.3%
Here:
92%
State:
93%
(% for various income ranges: 92.7% for AGIs below $25k, 91.7% for AGIs $25k-50k, 90.9% for AGIs $50k-75k, 94.1% for AGIs $75k-100k, 91.3% for AGIs $100k-200k, 100.0% for AGIs over 200k)
Averages for the 2012 tax year for zip code 29148, filed in 2013:
Average Adjusted Gross Income (AGI) in 2012: $35,609 (Individual Income Tax Returns)
Here:
$35,609
State:
$51,133
Salary/wage: $28,211 (reported on 76.0% of returns)
Here:
$28,211
State:
$42,173
(% of AGI for various income ranges: 69.5% for AGIs below $25k, 69.3% for AGIs $25k-50k, 54.5% for AGIs $50k-75k, 68.9% for AGIs $75k-100k, 56.6% for AGIs $100k-200k, 31.8% for AGIs over 200k)
Taxable interest for individuals: $982 (reported on 25.2% of returns)
This zip code:
$982
South Carolina:
$1,468
(% of AGI for various income ranges: 0.8% for AGIs below $25k, 0.5% for AGIs $25k-50k, 0.8% for AGIs $50k-75k, 0.2% for AGIs $75k-100k, 0.9% for AGIs $100k-200k, 1.1% for AGIs over 200k)
Ordinary dividends: $3,133 (reported on 13.4% of returns)
Here:
$3,133
State:
$6,511
(% of AGI for various income ranges: 0.9% for AGIs below $25k, 0.7% for AGIs $25k-50k, 1.3% for AGIs $50k-75k, 0.8% for AGIs $75k-100k, 3.4% for AGIs $100k-200k)
Net capital gain/loss in AGI: +$6,423 (reported on 10.6% of returns)
Here:
+$6,423
State:
+$13,061
(% of AGI for various income ranges: 0.3% for AGIs $50k-75k, 1.1% for AGIs $75k-100k, 2.6% for AGIs $100k-200k, 11.1% for AGIs over 200k)
Profit/loss from business: +$7,453 (reported on 14.6% of returns)
Here:
+$7,453
State:
+$10,167
(% of AGI for various income ranges: 8.0% for AGIs below $25k, 1.2% for AGIs $25k-50k, 1.4% for AGIs $50k-75k, 1.8% for AGIs $75k-100k, 4.5% for AGIs $100k-200k)
Taxable individual retirement arrangement distribution: $12,912 (reported on 9.8% of returns)
29148:
$12,912
South Carolina:
$17,019
(% of AGI for various income ranges: 1.8% for AGIs below $25k, 3.7% for AGIs $25k-50k, 7.3% for AGIs $50k-75k, 7.2% for AGIs $100k-200k)
Total itemized deductions: $20,986 (28% of AGI, reported on 22.8% of returns)
Here:
$20,986
State:
$22,890
Here:
28.1% of AGI
State:
21.4% of AGI
(% of AGI for various income ranges: 8.5% for AGIs below $25k, 13.3% for AGIs $25k-50k, 15.3% for AGIs $50k-75k, 16.0% for AGIs $75k-100k, 16.1% for AGIs $100k-200k, 13.3% for AGIs over 200k)
Charity contributions: $4,661 (reported on 19.9% of returns)
Here:
$4,661
State:
$5,169
(% of AGI for various income ranges: 1.2% for AGIs below $25k, 2.4% for AGIs $25k-50k, 3.2% for AGIs $50k-75k, 2.6% for AGIs $75k-100k, 4.1% for AGIs $100k-200k, 2.9% for AGIs over 200k)
Taxes paid: $5,832 (reported on 22.8% of returns)
29148:
$5,832
State:
$7,644
(% of AGI for various income ranges: 1.3% for AGIs below $25k, 2.4% for AGIs $25k-50k, 3.5% for AGIs $50k-75k, 4.9% for AGIs $75k-100k, 6.6% for AGIs $100k-200k, 5.9% for AGIs over 200k)
Earned income credit: $2,483 (reported on 35.4% of returns)
Here:
$2,483
State:
$2,418
(% of AGI for various income ranges: 10.5% for AGIs below $25k, 1.3% for AGIs $25k-50k)
Percentage of individuals using paid preparers for their 2012 taxes: 71.1%
Here:
71%
State:
57%
(% for various income ranges: 71.4% for AGIs below $25k, 67.9% for AGIs $25k-50k, 70.8% for AGIs $50k-75k, 75.0% for AGIs $75k-100k, 72.7% for AGIs $100k-200k, 100.0% for AGIs over 200k)
Averages for the 2004 tax year for zip code 29148, filed in 2005:
Average Adjusted Gross Income (AGI) in 2004: $28,301 (Individual Income Tax Returns)
Here:
$28,301
State:
$41,965
Salary/wage: $24,316 (reported on 80.7% of returns)
Here:
$24,316
State:
$35,695
(% of AGI for various income ranges: 103.6% for AGIs below $10k, 76.7% for AGIs $10k-25k, 73.8% for AGIs $25k-50k, 62.0% for AGIs $50k-75k, 67.9% for AGIs $75k-100k, 52.9% for AGIs over 100k)
Taxable interest for individuals: $1,577 (reported on 31.0% of returns)
This zip code:
$1,577
South Carolina:
$1,623
(% of AGI for various income ranges: 3.5% for AGIs below $10k, 2.5% for AGIs $10k-25k, 1.6% for AGIs $25k-50k, 1.2% for AGIs $50k-75k, 0.8% for AGIs $75k-100k, 1.8% for AGIs over 100k)
Taxable dividends: $2,650 (reported on 15.7% of returns)
Here:
$2,650
State:
$3,999
(% of AGI for various income ranges: 2.7% for AGIs below $10k, 0.8% for AGIs $10k-25k, 0.9% for AGIs $25k-50k, 1.3% for AGIs $50k-75k, 1.1% for AGIs $75k-100k, 3.6% for AGIs over 100k)
Net capital gain/loss: +$5,557 (reported on 12.2% of returns)
Here:
+$5,557
State:
+$13,100
(% of AGI for various income ranges: -0.4% for AGIs below $10k, 0.1% for AGIs $10k-25k, 0.8% for AGIs $25k-50k, 0.5% for AGIs $50k-75k, 1.5% for AGIs $75k-100k, 11.9% for AGIs over 100k)
Profit/loss from business: +$7,062 (reported on 12.8% of returns)
Here:
+$7,062
State:
+$9,144
(% of AGI for various income ranges: 6.0% for AGIs below $10k, 3.7% for AGIs $10k-25k, 2.2% for AGIs $25k-50k, 3.9% for AGIs $50k-75k, 4.9% for AGIs $75k-100k, 1.7% for AGIs over 100k)
Profit/loss from farming: +$1,842 (reported on 1.5% of returns)
Here:
+$1,842
State:
-$4,882
IRA payment deduction: $3,080 (reported on 2.0% of returns)
29148:
$3,080
South Carolina:
$2,972
Total itemized deductions: $16,470 (29% of AGI, reported on 23.5% of returns)
Here:
$16,470
State:
$19,039
Here:
29.2% of AGI
State:
22.8% of AGI
(% of AGI for various income ranges: 11.5% for AGIs below $10k, 6.9% for AGIs $10k-25k, 15.0% for AGIs $25k-50k, 16.6% for AGIs $50k-75k, 18.4% for AGIs $75k-100k, 14.4% for AGIs over 100k)
Charity contributions deductions: $3,980 (7% of AGI, reported on 21.5% of returns)
Here:
$3,980
State:
$4,305
Here:
6.9% of AGI
State:
5.0% of AGI
(% of AGI for various income ranges: 1.5% for AGIs below $10k, 1.4% for AGIs $10k-25k, 2.9% for AGIs $25k-50k, 3.8% for AGIs $50k-75k, 4.2% for AGIs $75k-100k, 4.1% for AGIs over 100k)
Total tax: $3,911 (reported on 57.9% of returns)
29148:
$3,911
State:
$6,497
(% of AGI for various income ranges: 2.7% for AGIs below $10k, 2.6% for AGIs $10k-25k, 5.5% for AGIs $25k-50k, 9.2% for AGIs $50k-75k, 10.8% for AGIs $75k-100k, 17.8% for AGIs over 100k)
Earned income credit: $1,987 (reported on 36.6% of returns)
Here:
$1,987
State:
$1,882
Percentage of individuals using paid preparers for their 2004 taxes: 74.8%
Here:
75%
State:
66%
(% for various income ranges: 72.9% for AGIs below $10k, 77.0% for AGIs $10k-25k, 75.4% for AGIs $25k-50k, 70.8% for AGIs $50k-75k, 64.9% for AGIs $75k-100k, 84.1% for AGIs over 100k)
Likely homosexual households (counted as self-reported same-sex unmarried-partner households)
Lesbian couples: 0.4% of all households
Gay men: 0.0% of all households
Household received Food Stamps/SNAP in the past 12 months: 449 Household did not receive Food Stamps/SNAP in the past 12 months: 2,034
Women who had a birth in the past 12 months: 13 (3 now married, 9 unmarried) Women who did not have a birth in the past 12 months: 1,193 (228 now married, 954 unmarried)
Housing units in zip code 29148 with a mortgage: 809 (44 second mortgage, 11 both second mortgage and home equity loan) Median monthly owner costs for units with a mortgage: $1,078 Median monthly owner costs for units without a mortgage: $340
Residents with income below the poverty level in 2022:
This zip code:
15.7%
Whole state:
14.0%
Residents with income below 50% of the poverty level in 2022:
This zip code:
4.5%
Whole state:
7.3%
Median number of rooms in houses and condos:
Here:
6.0
State:
6.4
Median number of rooms in apartments:
Here:
5.0
State:
4.5
Notable locations in this zip code not listed on our city pages
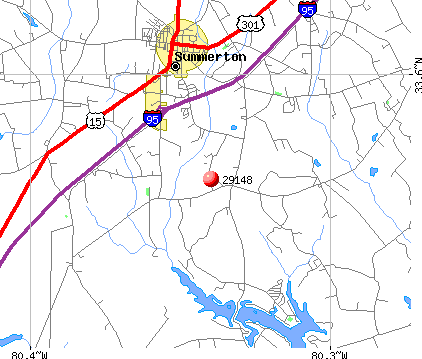
Notable locations in zip code 29148: Camp Cooper (A), Camp Robinson (B), Goat Island Landing (C), Potato Creek Landing (D), Foxboro Golf Club (E), Sean's Poultry Farm (F), Clarendon County Rural Fire Department Summerton (G), Clarendon County Rural Fire Department Santee (H), Clarendon County Rural Fire Department Taw Caw (I), Summerton Police Department (J). Display/hide their locations on the map
Churches in zip code 29148 include: Saint James Church (A), Springhill Church (B), Mount Zion Church (C), Bethlehem Church (D), Church of God (E), Gumspring Church (F), Briggs Chapel (G), Holiness Church (H), Saint Marks African Methodist Episcopal Church (I). Display/hide their locations on the map
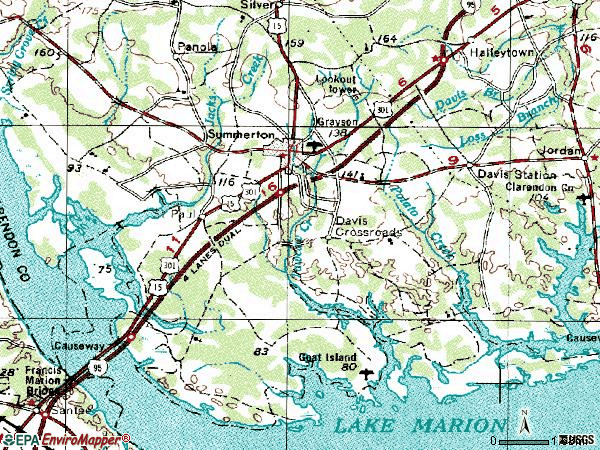
Lakes, reservoirs, and swamps: Goshing Pond (A), Colclough Pond (B), Polly Cantey Pond (C), Stukes Pond (D), Summerton Waste Treatment Pond (E), Dingle Pond (F), Doctor Bay (G), Monkey Bay (H). Display/hide their locations on the map
Streams, rivers, and creeks: Wildcat Branch (A), Tancaw Creek (B), Sullivans Branch (C), Scott Branch (D), Potato Creek (E), Savanna Branch (F), Lizzies Branch (G), White Oak Creek (H), Jacks Creek (I). Display/hide their locations on the map
In group quarters: 103 (-1 institutionalized population)
Size of family households: 932 2-persons, 301 3-persons, 244 4-persons, 75 5-persons, 3 6-persons, 38 7-or-more-persons
Size of nonfamily households: 724 1-person, 167 2-persons
381 married couples with children.
110 single-parent households (36 men, 74 women).
99.3% of residents of 29148 zip code speak English at home.
0.6% of residents speak Spanish at home (76% very well, 21% not well, 3% not at all).
0.3% of residents speak other Indo-European language at home (22% very well, 22% well, 56% not well).
0.1% of residents speak Asian or Pacific Island language at home (100% well).
Foreign born population: 44 (0.7%) (29.7% of them are naturalized citizens)
This zip code:
0.7%
Whole state:
5.2%
20%Sweden
20%Netherlands
20%Honduras
9%United Kingdom, excluding England and Scotland
9%Taiwan
7%Guyana
7%American
5%English
5%German
3%Irish
1%French
1%Scotch-Irish
1%European
Year of entry for the foreign-born population
102010 or later
112000 to 2009
121990 to 1999
24Before 1990
Facilities with environmental interests located in this zip code:
FEDERAL MOGUL CORPORATION (US HWY. 301 N. in SUMMERTON, SC)
AIR MAJOR (AIRS/AFS) - ICIS-04-2006-1752, ENFORCEMENT/COMPLIANCE ACTIVITY CRITERIA AND HAZARDOUS AIR POLLUTANT INVENTORY (Inventory of air pollution sources) National Pollutant Discharge Elimination System NON-MAJOR (Tracking pollutant discharge elimination systems) - permit HAZARDOUS WASTE BIENNIAL REPORTER (Resource Conservation and Recovery Act (tracking hazardous waste)) Large Quantity Generators, more that 1000 kg of hazardous waste/month (Resource Conservation and Recovery Act (tracking hazardous waste)) - notification STATE MASTER (South Carolina database) - AIR MAJOR, AIR PROGRAM, HAZARDOUS WASTE PROGRAM, TRI REPORTER, National Pollutant Discharge Elimination System Permit, AIR PROGRAM TRI REPORTER (Tracking of toxic chemicals releasing facilities) Business SIC classification: GASKETS, PACKING, AND SEALING DEVICES Business NAICS classification: GASKET, PACKING, AND SEALING DEVICE MANUFACTURING.; GASKET, PACKING, AND SEALING DEVICE MANUFACTURING. Alternative names: FEDERAL-MOGUL CORP.
CLARENDON COUNTY SCHOOL DISTRICT #1 (LARRY KING HIGHWAY in SUMMERTON, SC)
COMPLIANCE ACTIVITY (Tracking inspections of insecticide, fungicide, and rodenticide, and toxic substances) Alternative names: CLARENDON SCHOOL DISTRICT #1
DETWILER CONST CO (POB 760 in SUMTER, SC)
AIR MINOR (AIRS/AFS) Business SIC classification: NONCLASSIFIABLE ESTABLISHMENTS
Housing units lacking complete plumbing facilities: 1.7% Housing units lacking complete kitchen facilities: 4.8%
84.0%Electricity
9.7%Bottled, tank, or LP gas
3.5%Utility gas
1.8%Fuel oil, kerosene, etc.
0.5%Wood
Population in 1990: 5,946. Population change in the 1990s: +299 (+5.0%).
Place of birth for U.S.-born residents:
This state: 4,064
Northeast: 1,032
Midwest: 233
South: 638
West: 105
68% of the 29148 zip code residents lived in the same house 5 years ago. Out of people who lived in different houses, 47% lived in this county. Out of people who lived in different counties, 50% lived in South Carolina.
94% of the 29148 zip code residents lived in the same house 1 year ago. Out of people who lived in different houses, 20% moved from this county. Out of people who lived in different houses, 37% moved from different county within same state. Out of people who lived in different houses, 44% moved from different state. Out of people who lived in different houses, 3% moved from abroad.
Private vs. public school enrollment:
Students in private schools in grades 1 to 8 (elementary and middle school): 101
Here:
28.9%
South Carolina:
14.4%
Students in private schools in grades 9 to 12 (high school): 25
Here:
12.4%
South Carolina:
11.1%
Students in private undergraduate colleges:
Here:
0.0%
South Carolina:
21.9%
Occupation by median earnings in the past 12 months ($)
79,407Transportation occupations
72,245Construction and extraction occupations
64,515Business and financial operations occupations
56,502Management occupations
50,361Life, physical, and social science occupations
48,137Law enforcement workers including supervisors
Companies with federal contracts located in this zip code:
A-A HOME BUILDERS & A-A HOME I (1233 CRESCENT STREET in SUMMERTON, SC; small business) : $87,469 in 3 contractsfrom 2000 to 2001
$50,000 with Air Force for Maintenance, Repair or Alteration of Real Property -- Miscellaneous Buildings. Signed on 2001-06-30. Completion date: 2001-09-28.
$34,472 with Air Force for Photographic Equipment and Accessories. Signed on 2000-09-30. Completion date: 2000-09-30.
$2,997 with Air Force for Maintenance, Repair or Alteration of Real Property -- Other Non-Building Facilities. Signed on 2001-04-30. Completion date: 2001-03-21.
Top industries in this zip code by the number of employees in 2005:
Accommodation and Food Services: Limited-Service Restaurants (20-49: 1, 5-9: 1)
Administrative and Support and Waste Management and Remediation Services: Professional Employer Organizations (20-49: 1)
Educational Services: Elementary and Secondary Schools (20-49: 1)
Accommodation and Food Services: Hotels (except Casino Hotels) and Motels (10-19: 1, 5-9: 1, 1-4: 4)
People in group quarters in 2010:
80 people in nursing facilities/skilled-nursing facilities
12 people in other noninstitutional facilities
People in group quarters in 2000:
89 people in nursing homes
4 people in homes for the mentally retarded
Fatal accident statistics in 2014:
Fatal accident count: 2
Vehicles involved in fatal accidents: 2
Fatal accidents caused by drunken drivers: 0
Fatalities: 3
Persons involved in fatal accidents: 5
Pedestrians involved in fatal accidents: 0
Fatal accident statistics in 2013:
Fatal accident count: 4
Vehicles involved in fatal accidents: 5
Fatal accidents caused by drunken drivers: 2
Fatalities: 4
Persons involved in fatal accidents: 9
Pedestrians involved in fatal accidents: 0
2002 - 2018 National Fire Incident Reporting System (NFIRS) incidents
According to the data from the years 2002 - 2018 the average number of fires per year is 75. The highest number of reported fire incidents - 119 took place in 2010, and the least - 0 in 2008. The data has a rising trend.
When looking into fire subcategories, the most incidents belonged to: Outside Fires (57.2%), and Structure Fires (21.6%).
Fire incident types reported to NFIRS in Zip Code 29148


+$1,842
-$4,882
 Nearest zip codes: 29163, 29048, 29102, 29142, 29125, 29059.


 According to the data from the years 2002 - 2018 the average number of fires per year is 75. The highest number of reported fire incidents - 119 took place in 2010, and the least - 0 in 2008. The data has a rising trend.
 When looking into fire subcategories, the most incidents belonged to: Outside Fires (57.2%), and Structure Fires (21.6%).