Estimated zip code population in 2022: 12,340 Zip code population in 2010: 14,267 Zip code population in 2000: 14,535
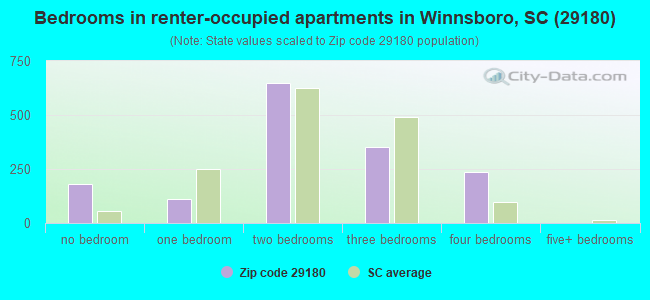
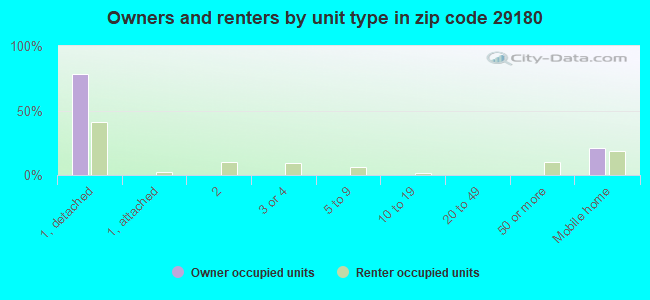
Houses and condos: 6,682 Renter-occupied apartments: 1,538
% of renters here:
29%
State:
28%
March 2022 cost of living index in zip code 29180: 80.8 (low, U.S. average is 100)
Land area: 305.0 sq. mi. Water area: 4.5 sq. mi.
Population density: 40 people per square mile
(very low).
OSM Map
General Map
Google Map
MSN Map
OSM Map
General Map
Google Map
MSN Map
OSM Map
General Map
Google Map
MSN Map
OSM Map
General Map
Google Map
MSN Map
Please wait while loading the map...
Real estate property taxes paid for housing units in 2022:
This zip code:
0.5% ($638)
South Carolina:
0.5% ($1,185)
Median real estate property taxes paid for housing units with mortgages in 2022: $932 (0.5%) Median real estate property taxes paid for housing units with no mortgage in 2022: $557 (0.5%)
Estimated median house/condo value in 2022: $131,304
29180:
$131,304
South Carolina:
$254,600
According to our research of South Carolina and other state lists, there were 10 registered sex offenders living in 29180 zip code as of May 28, 2024. The ratio of all residents to sex offenders in zip code 29180 is 1,428 to 1. The ratio of registered sex offenders to all residents in this zip code is near the state average.
Median resident age:
This zip code:
44.9 years
South Carolina median age:
40.5 years
Average household size:
This zip code:
2.3 people
South Carolina:
2.4 people
Averages for the 2020 tax year for zip code 29180, filed in 2021:
Average Adjusted Gross Income (AGI) in 2020: $43,054 (Individual Income Tax Returns)
Here:
$43,054
State:
$65,754
Salary/wage: $36,379 (reported on 85.2% of returns)
Here:
$36,379
State:
$52,566
(% of AGI for various income ranges: 1432.5% for AGIs below $25k, 3985.3% for AGIs $25k-50k, 8046.8% for AGIs $50k-75k, 11620.0% for AGIs $75k-100k, 16655.0% for AGIs $100k-200k)
Taxable interest for individuals: $1,248 (reported on 15.3% of returns)
This zip code:
$1,248
South Carolina:
$1,749
(% of AGI for various income ranges: 5.0% for AGIs below $25k, 12.4% for AGIs $25k-50k, 33.8% for AGIs $50k-75k, 45.0% for AGIs $75k-100k, 197.5% for AGIs $100k-200k)
Ordinary dividends: $4,287 (reported on 8.5% of returns)
Here:
$4,287
State:
$8,783
(% of AGI for various income ranges: 7.6% for AGIs below $25k, 19.4% for AGIs $25k-50k, 89.2% for AGIs $50k-75k, 103.3% for AGIs $75k-100k, 401.0% for AGIs $100k-200k)
Net capital gain/loss in AGI: +$10,755 (reported on 7.9% of returns)
Here:
+$10,755
State:
+$24,194
(% of AGI for various income ranges: 24.1% for AGIs $25k-50k, 109.2% for AGIs $50k-75k, 190.6% for AGIs $75k-100k, 992.5% for AGIs $100k-200k)
Profit/loss from business: +$1,839 (reported on 16.6% of returns)
Here:
+$1,839
State:
+$11,253
(% of AGI for various income ranges: 196.2% for AGIs $50k-75k, 138.3% for AGIs $75k-100k, 750.5% for AGIs $100k-200k)
Taxable individual retirement arrangement distribution: $15,900 (reported on 6.4% of returns)
29180:
$15,900
South Carolina:
$21,604
(% of AGI for various income ranges: 25.1% for AGIs below $25k, 65.1% for AGIs $25k-50k, 215.2% for AGIs $50k-75k, 555.0% for AGIs $75k-100k, 1516.0% for AGIs $100k-200k)
Total itemized deductions: $34,223 (reported on 4.2% of returns)
Here:
$34,223
State:
$35,199
(% of AGI for various income ranges: 20.1% for AGIs below $25k, 97.2% for AGIs $25k-50k, 328.2% for AGIs $50k-75k, 569.4% for AGIs $75k-100k, 1074.5% for AGIs $100k-200k)
Charity contributions: $12,400 (reported on 3.9% of returns)
Here:
$12,400
State:
$14,319
(% of AGI for various income ranges: 26.0% for AGIs $25k-50k, 89.8% for AGIs $50k-75k, 187.8% for AGIs $75k-100k, 399.0% for AGIs $100k-200k)
Taxes paid: $6,542 (reported on 4.2% of returns)
29180:
$6,542
State:
$7,486
(% of AGI for various income ranges: 2.6% for AGIs below $25k, 13.1% for AGIs $25k-50k, 69.2% for AGIs $50k-75k, 140.0% for AGIs $75k-100k, 285.0% for AGIs $100k-200k)
Earned income credit: $2,407 (reported on 30.2% of returns)
Here:
$2,407
State:
$2,397
(% of AGI for various income ranges: 147.5% for AGIs below $25k, 101.8% for AGIs $25k-50k)
Percentage of individuals using paid preparers for their 2020 taxes: 93.2%
Here:
93%
State:
93%
(% for various income ranges: 92.3% for AGIs below $25k, 94.9% for AGIs $25k-50k, 93.1% for AGIs $50k-75k, 91.7% for AGIs $75k-100k, 92.5% for AGIs $100k-200k, 100.0% for AGIs over 200k)
Averages for the 2012 tax year for zip code 29180, filed in 2013:
Average Adjusted Gross Income (AGI) in 2012: $36,186 (Individual Income Tax Returns)
Here:
$36,186
State:
$51,133
Salary/wage: $31,107 (reported on 85.2% of returns)
Here:
$31,107
State:
$42,173
(% of AGI for various income ranges: 76.7% for AGIs below $25k, 84.9% for AGIs $25k-50k, 74.5% for AGIs $50k-75k, 67.9% for AGIs $75k-100k, 65.3% for AGIs $100k-200k, 51.1% for AGIs over 200k)
Taxable interest for individuals: $979 (reported on 18.4% of returns)
This zip code:
$979
South Carolina:
$1,468
(% of AGI for various income ranges: 0.4% for AGIs below $25k, 0.3% for AGIs $25k-50k, 0.7% for AGIs $50k-75k, 0.6% for AGIs $75k-100k, 0.6% for AGIs $100k-200k, 0.4% for AGIs over 200k)
Ordinary dividends: $3,743 (reported on 9.7% of returns)
Here:
$3,743
State:
$6,511
(% of AGI for various income ranges: 0.7% for AGIs below $25k, 0.4% for AGIs $25k-50k, 1.2% for AGIs $50k-75k, 1.3% for AGIs $75k-100k, 1.5% for AGIs $100k-200k, 1.7% for AGIs over 200k)
Net capital gain/loss in AGI: +$6,436 (reported on 7.6% of returns)
Here:
+$6,436
State:
+$13,061
(% of AGI for various income ranges: 0.2% for AGIs below $25k, 0.1% for AGIs $25k-50k, 0.6% for AGIs $50k-75k, 1.7% for AGIs $75k-100k, 2.0% for AGIs $100k-200k, 7.0% for AGIs over 200k)
Profit/loss from business: +$4,109 (reported on 16.2% of returns)
Here:
+$4,109
State:
+$10,167
(% of AGI for various income ranges: 7.7% for AGIs below $25k, 0.4% for AGIs $50k-75k, 0.2% for AGIs $75k-100k, 2.0% for AGIs $100k-200k)
Taxable individual retirement arrangement distribution: $14,338 (reported on 7.2% of returns)
29180:
$14,338
South Carolina:
$17,019
(% of AGI for various income ranges: 1.8% for AGIs below $25k, 1.8% for AGIs $25k-50k, 3.1% for AGIs $50k-75k, 4.0% for AGIs $75k-100k, 6.3% for AGIs $100k-200k)
Total itemized deductions: $19,102 (25% of AGI, reported on 21.9% of returns)
Here:
$19,102
State:
$22,890
Here:
24.6% of AGI
State:
21.4% of AGI
(% of AGI for various income ranges: 4.8% for AGIs below $25k, 9.6% for AGIs $25k-50k, 14.1% for AGIs $50k-75k, 14.9% for AGIs $75k-100k, 15.8% for AGIs $100k-200k, 14.5% for AGIs over 200k)
Charity contributions: $5,232 (reported on 19.1% of returns)
Here:
$5,232
State:
$5,169
(% of AGI for various income ranges: 0.8% for AGIs below $25k, 2.3% for AGIs $25k-50k, 3.6% for AGIs $50k-75k, 3.4% for AGIs $75k-100k, 3.7% for AGIs $100k-200k, 4.1% for AGIs over 200k)
Taxes paid: $5,769 (reported on 21.9% of returns)
29180:
$5,769
State:
$7,644
(% of AGI for various income ranges: 0.8% for AGIs below $25k, 1.9% for AGIs $25k-50k, 3.7% for AGIs $50k-75k, 4.9% for AGIs $75k-100k, 6.3% for AGIs $100k-200k, 6.5% for AGIs over 200k)
Earned income credit: $2,599 (reported on 37.1% of returns)
Here:
$2,599
State:
$2,418
(% of AGI for various income ranges: 11.6% for AGIs below $25k, 1.7% for AGIs $25k-50k)
Percentage of individuals using paid preparers for their 2012 taxes: 68.1%
Here:
68%
State:
57%
(% for various income ranges: 69.4% for AGIs below $25k, 65.4% for AGIs $25k-50k, 67.2% for AGIs $50k-75k, 68.8% for AGIs $75k-100k, 68.0% for AGIs $100k-200k, 80.0% for AGIs over 200k)
Averages for the 2004 tax year for zip code 29180, filed in 2005:
Average Adjusted Gross Income (AGI) in 2004: $29,840 (Individual Income Tax Returns)
Here:
$29,840
State:
$41,965
Salary/wage: $27,174 (reported on 88.5% of returns)
Here:
$27,174
State:
$35,695
(% of AGI for various income ranges: 100.1% for AGIs below $10k, 85.2% for AGIs $10k-25k, 86.2% for AGIs $25k-50k, 78.5% for AGIs $50k-75k, 76.4% for AGIs $75k-100k, 65.2% for AGIs over 100k)
Taxable interest for individuals: $1,454 (reported on 23.6% of returns)
This zip code:
$1,454
South Carolina:
$1,623
(% of AGI for various income ranges: 2.0% for AGIs below $10k, 0.8% for AGIs $10k-25k, 0.9% for AGIs $25k-50k, 1.5% for AGIs $50k-75k, 1.1% for AGIs $75k-100k, 1.6% for AGIs over 100k)
Taxable dividends: $3,339 (reported on 11.9% of returns)
Here:
$3,339
State:
$3,999
(% of AGI for various income ranges: 1.6% for AGIs below $10k, 0.6% for AGIs $10k-25k, 0.8% for AGIs $25k-50k, 1.3% for AGIs $50k-75k, 1.7% for AGIs $75k-100k, 3.1% for AGIs over 100k)
Net capital gain/loss: +$8,044 (reported on 9.3% of returns)
Here:
+$8,044
State:
+$13,100
(% of AGI for various income ranges: -0.4% for AGIs below $10k, 0.3% for AGIs $10k-25k, 0.8% for AGIs $25k-50k, 1.6% for AGIs $50k-75k, 2.4% for AGIs $75k-100k, 10.1% for AGIs over 100k)
Profit/loss from business: +$5,135 (reported on 12.6% of returns)
Here:
+$5,135
State:
+$9,144
(% of AGI for various income ranges: 2.6% for AGIs below $10k, 2.6% for AGIs $10k-25k, 0.7% for AGIs $25k-50k, 2.4% for AGIs $50k-75k, 2.4% for AGIs $75k-100k, 4.0% for AGIs over 100k)
IRA payment deduction: $2,725 (reported on 2.3% of returns)
29180:
$2,725
South Carolina:
$2,972
(% of AGI for various income ranges: 0.3% for AGIs $10k-25k, 0.2% for AGIs $25k-50k, 0.3% for AGIs $50k-75k, 0.3% for AGIs $75k-100k)
Total itemized deductions: $15,760 (26% of AGI, reported on 23.3% of returns)
Here:
$15,760
State:
$19,039
Here:
26.1% of AGI
State:
22.8% of AGI
(% of AGI for various income ranges: 7.8% for AGIs below $10k, 5.5% for AGIs $10k-25k, 12.3% for AGIs $25k-50k, 15.3% for AGIs $50k-75k, 16.8% for AGIs $75k-100k, 15.1% for AGIs over 100k)
Charity contributions deductions: $4,161 (7% of AGI, reported on 21.0% of returns)
Here:
$4,161
State:
$4,305
Here:
6.7% of AGI
State:
5.0% of AGI
(% of AGI for various income ranges: 0.7% for AGIs below $10k, 1.0% for AGIs $10k-25k, 2.9% for AGIs $25k-50k, 4.2% for AGIs $50k-75k, 4.2% for AGIs $75k-100k, 3.6% for AGIs over 100k)
Total tax: $3,785 (reported on 60.1% of returns)
29180:
$3,785
State:
$6,497
(% of AGI for various income ranges: 2.0% for AGIs below $10k, 2.7% for AGIs $10k-25k, 5.5% for AGIs $25k-50k, 8.6% for AGIs $50k-75k, 10.0% for AGIs $75k-100k, 16.2% for AGIs over 100k)
Earned income credit: $1,932 (reported on 36.1% of returns)
Here:
$1,932
State:
$1,882
Percentage of individuals using paid preparers for their 2004 taxes: 66.0%
Here:
66%
State:
66%
(% for various income ranges: 62.9% for AGIs below $10k, 67.2% for AGIs $10k-25k, 65.5% for AGIs $25k-50k, 67.7% for AGIs $50k-75k, 66.8% for AGIs $75k-100k, 74.6% for AGIs over 100k)
Household received Food Stamps/SNAP in the past 12 months: 1,326 Household did not receive Food Stamps/SNAP in the past 12 months: 4,059
Women who had a birth in the past 12 months: 226 (36 now married, 173 unmarried) Women who did not have a birth in the past 12 months: 2,272 (589 now married, 1,668 unmarried)
Housing units in zip code 29180 with a mortgage: 1,463 (168 second mortgage, 134 both second mortgage and home equity loan) Houses without a mortgage: 63
Median monthly owner costs for units with a mortgage: $1,170 Median monthly owner costs for units without a mortgage: $331
Residents with income below the poverty level in 2022:
This zip code:
24.7%
Whole state:
14.0%
Residents with income below 50% of the poverty level in 2022:
This zip code:
14.9%
Whole state:
7.3%
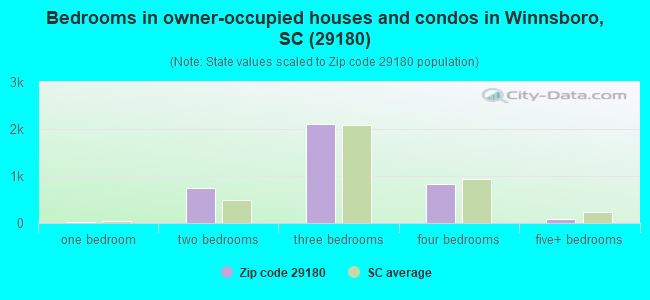
Median number of rooms in houses and condos:
Here:
6.6
State:
6.4
Median number of rooms in apartments:
Here:
5.1
State:
4.5
Notable locations in this zip code not listed on our city pages
Notable locations in zip code 29180: White Oak Conference Center (A), Camp Welfare (B), Winnsboro Fire Department (C), Fairfield County Fire Department Greenbrier Bethel (D), Fairfield County Fire Department Dutchman Creek (E), Fairfield County Fire Department Lebanon (F), Fairfield County Fire Department Community Substation (G), Fairfield County Jail (H), Fairfield County Library (I), Fairfield County Fire Department Community (J). Display/hide their locations on the map
Churches in zip code 29180 include: Rock Hill Church (A), Rockton Church (B), Saint Johns Church (C), Saint Matthews Church (D), Saint Theresa Church (E), Shady Grove Church (F), Shiloh Church (G), Mount Zion Church (H), White Oak Church (I). Display/hide their locations on the map
Cemeteries: Winnsboro Mills Cemetery (1), Wirick Cemetery (2), Robinson Cemetery (3), Saint Johns Cemetery (4), Old Stone Church Cemetery (5), Gibson Cemetery (6), Mann Cemetery (7). Display/hide their locations on the map
Reservoirs: White Oak Conference Center Lake (A), Jackson Mill Creek Watershed Structure Number One (B), Winnsboro Reservoir (C), Jackson Mill Creek Watershed Structure Number Two (D), Wateree Creek Watershed Structure Number Four (E). Display/hide their locations on the map
Streams, rivers, and creeks: Catawba River (A), Willow Swamp Branch (B), White Oak Branch (C), Stitt Branch (D), Shavers Creek (E), Scabbler Branch (F), Home Branch (G), Russell Creek (H), Robinson Branch (I). Display/hide their locations on the map
In group quarters: 131 (-1 institutionalized population)
Size of family households: 1,937 2-persons, 844 3-persons, 622 4-persons, 146 5-persons, 48 6-persons, 93 7-or-more-persons
Size of nonfamily households: 1,608 1-person, 65 2-persons
697 married couples with children.
1,068 single-parent households (108 men, 960 women).
96.0% of residents of 29180 zip code speak English at home.
3.2% of residents speak Spanish at home (50% very well, 37% well, 13% not well, 1% not at all).
0.4% of residents speak other Indo-European language at home (58% very well, 42% not well).
0.3% of residents speak Asian or Pacific Island language at home (73% very well, 27% well).
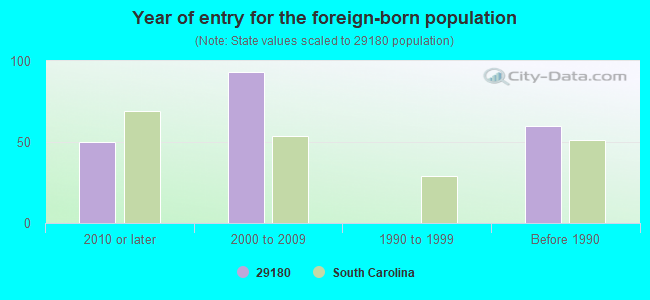
Foreign born population: 93 (0.8%) (73.8% of them are naturalized citizens)
This zip code:
0.8%
Whole state:
5.2%
29%France
27%Honduras
24%El Salvador
12%Japan
3%Barbados
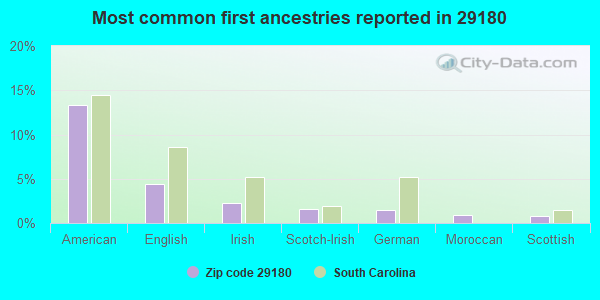
13%American
4%English
2%Irish
2%Scotch-Irish
2%German
1%Moroccan
1%Scottish
Year of entry for the foreign-born population
502010 or later
932000 to 2009
01990 to 1999
60Before 1990
Facilities with environmental interests located in this zip code:
FAST FARE SC 632 (215 NORTH CONGRESS STREET in WINNSBORO, SC)
(Resource Conservation and Recovery Act (tracking hazardous waste)) STATE MASTER (South Carolina database) - HAZARDOUS WASTE PROGRAM STATE MASTER (South Carolina database) - UNDERGROUND STORAGE TANK PROGRAM Organizations: CROWN CENTRAL PETROLEUM CORP (CONTACT/OWNER)
Alternative names: FAST FARE SC 632 DEACTIVATED, SC632
FAIRFIELD MEMORIAL HOSPITAL (US HIGHWAY 321 BY PASS in WINNSBORO, SC)
AIR MINOR (AIRS/AFS) STATE MASTER (South Carolina database) - X-RAY EQUIPMENT, RADIOACTIVE MATERIALS, AIR PROGRAM STATE MASTER (South Carolina database) - RADIOACTIVE WASTE Business SIC classification: GENERAL MEDICAL AND SURGICAL HOSPITALS Alternative names: FAIRFIELD HOSPITAL
FAIRFIELD MIDDLE SCHOOL (728 US HWY 321 BYPASS S in WINNSBORO, SC)
(National Center for Education Statistics) - STATE ID-2001001 STATE MASTER (South Carolina database) - National Pollutant Discharge Elimination System Permit Organizations: FAIRFIELD COUNTY SCHOOL DISTRCT (SCHOOL DISTRICT)
Alternative names: FAIRFIELD JR HI, FAIRFIELD JR HI/F CNTY SCHOOLS
FAIRFIELD CAREER & TEC CTR. (1451 US HWY 321 NO. in WINNSBORO, SC)
(National Center for Education Statistics) - STATE ID-2001995 Organizations: FAIRFIELD COUNTY SCHOOL DISTRCT (SCHOOL DISTRICT)
FAIRFIELD CENTRAL HIGH SCHOOL (836 US HWY 321 BY PASS SO. in WINNSBORO, SC)
(National Center for Education Statistics) - STATE ID-2001013 Organizations: FAIRFIELD COUNTY SCHOOL DISTRCT (SCHOOL DISTRICT)
FAIRFIELD COUNTY SCHOOLS (104 OLD CAMDEN ROAD in WINNSBORO, SC)
COMPLIANCE ACTIVITY (Tracking inspections of insecticide, fungicide, and rodenticide, and toxic substances) STATE MASTER (South Carolina database) - UNDERGROUND STORAGE TANK PROGRAM Alternative names: FAIRFIELD COUNTY SCHOOL DISTRICT
FAIRFIELD INTERMEDIATE (1647 US HWY 321 BY PASS NO. in WINNSBORO, SC)
(National Center for Education Statistics) - STATE ID-2001015 Organizations: FAIRFIELD COUNTY SCHOOL DISTRCT (SCHOOL DISTRICT)
FAIRFIELD PRIMARY SCHOOL (175 MEDLEY ROAD in WINNSBORO, SC)
(National Center for Education Statistics) - STATE ID-2001014 Organizations: FAIRFIELD COUNTY SCHOOL DISTRCT (SCHOOL DISTRICT)
FAIRFIELD CTY PW/CATHCART PIT (1324 RUNWAY ROAD in WINNSBORO, SC)
National Pollutant Discharge Elimination System NON-MAJOR (Tracking pollutant discharge elimination systems) - permit Business SIC classification: MISCELLANEOUS NONMETALLIC MINERALS, EXCEPT FUELS
DOOLITTLE, RAY C. (PO BOX 551 in WINNSBORO, SC)
AIR MINOR (AIRS/AFS) Business SIC classification: NONCLASSIFIABLE ESTABLISHMENTS
FAIRFIELD COUNTY SCHOOL DISTRICT (108 OLD CAMDEN ROAD in WINNSBORO, SC)
COMPLIANCE ACTIVITY (Tracking inspections of insecticide, fungicide, and rodenticide, and toxic substances)
Housing units lacking complete plumbing facilities: 4.6% Housing units lacking complete kitchen facilities: 2.9%
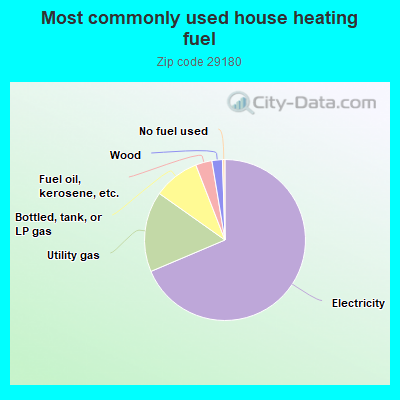
68.7%Electricity
16.2%Utility gas
9.3%Bottled, tank, or LP gas
3.3%Fuel oil, kerosene, etc.
2.1%Wood
0.5%No fuel used
Population in 1990: 16,188.
Place of birth for U.S.-born residents:
This state: 9,440
Northeast: 767
Midwest: 187
South: 1,354
West: 212
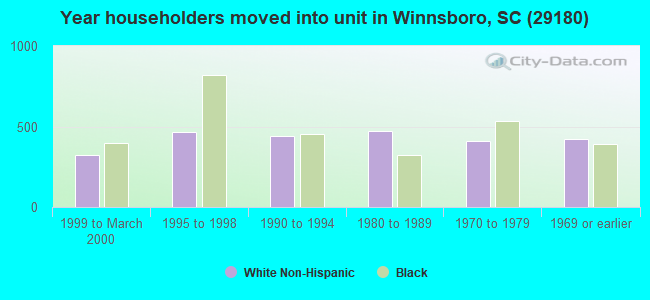
70% of the 29180 zip code residents lived in the same house 5 years ago. Out of people who lived in different houses, 64% lived in this county. Out of people who lived in different counties, 50% lived in South Carolina.
92% of the 29180 zip code residents lived in the same house 1 year ago. Out of people who lived in different houses, 59% moved from this county. Out of people who lived in different houses, 19% moved from different county within same state. Out of people who lived in different houses, 15% moved from different state.
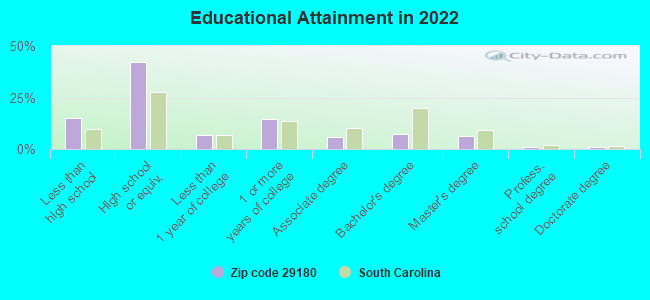
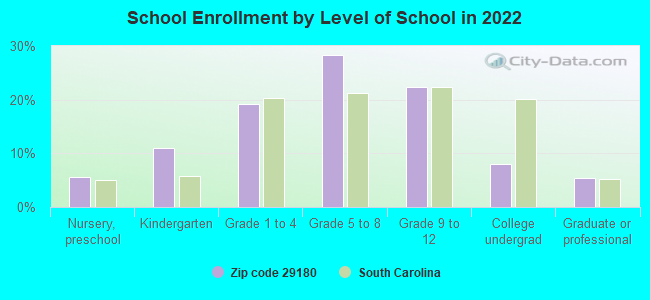
Private vs. public school enrollment:
Students in private schools in grades 1 to 8 (elementary and middle school): 229
Here:
17.5%
South Carolina:
14.4%
Students in private schools in grades 9 to 12 (high school): 102
Here:
16.6%
South Carolina:
11.1%
Students in private undergraduate colleges: 119
Here:
53.5%
South Carolina:
21.9%
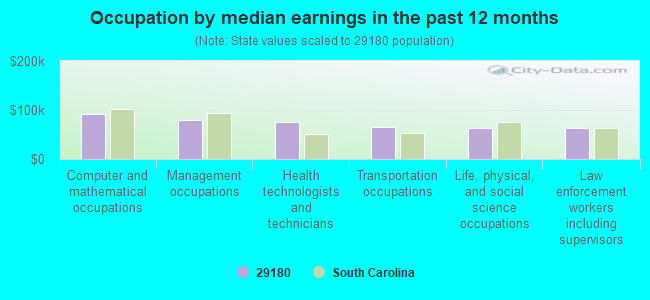
Occupation by median earnings in the past 12 months ($)
92,816Computer and mathematical occupations
78,816Management occupations
75,582Health technologists and technicians
65,388Transportation occupations
63,438Life, physical, and social science occupations
62,271Law enforcement workers including supervisors
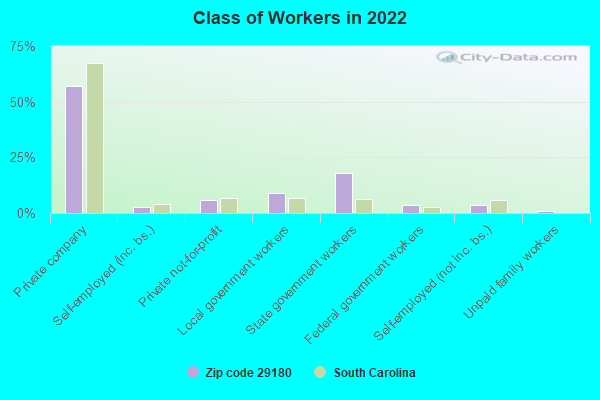
Top industries in this zip code by the number of employees in 2005:
Management of Companies and Enterprises: Corporate, Subsidiary, and Regional Managing Offices (100-249 employees: 1 establishment)
Health Care and Social Assistance: General Medical and Surgical Hospitals (100-249: 1)
Health Care and Social Assistance: Other Individual and Family Services (10-19: 3, 5-9: 9, 1-4: 2)
Accommodation and Food Services: Limited-Service Restaurants (20-49: 3, 1-4: 1)
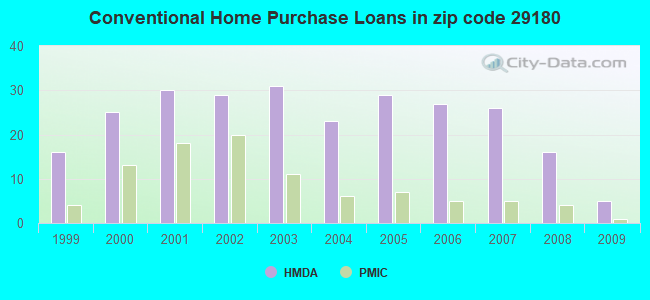
Detailed PMIC statistics for the following Tracts:0102.00
2002 - 2018 National Fire Incident Reporting System (NFIRS) incidents
According to the data from the years 2002 - 2018 the average number of fires per year is 97. The highest number of reported fire incidents - 182 took place in 2013, and the least - 15 in 2003. The data has an increasing trend.
When looking into fire subcategories, the most incidents belonged to: Structure Fires (40.2%), and Outside Fires (35.6%).
Fire incident types reported to NFIRS in Zip Code 29180

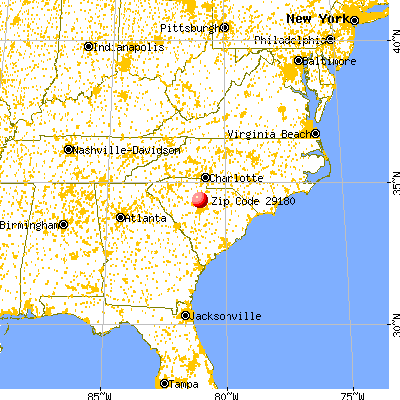


 Nearest zip codes: 29014, 29016, 29130, 29065, 29015, 29063.


 According to the data from the years 2002 - 2018 the average number of fires per year is 97. The highest number of reported fire incidents - 182 took place in 2013, and the least - 15 in 2003. The data has an increasing trend.
 When looking into fire subcategories, the most incidents belonged to: Structure Fires (40.2%), and Outside Fires (35.6%).