Estimated zip code population in 2022: 15,432 Zip code population in 2010: 14,446 Zip code population in 2000: 13,491
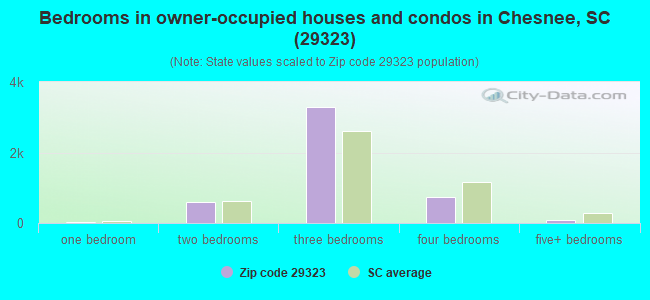
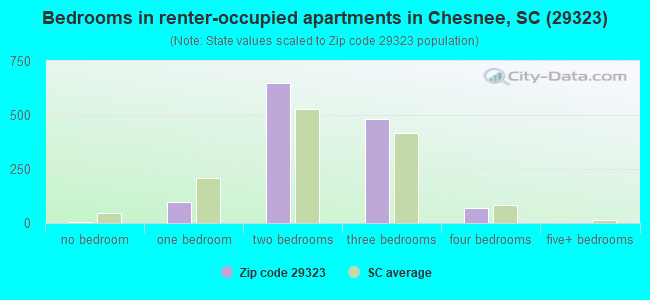
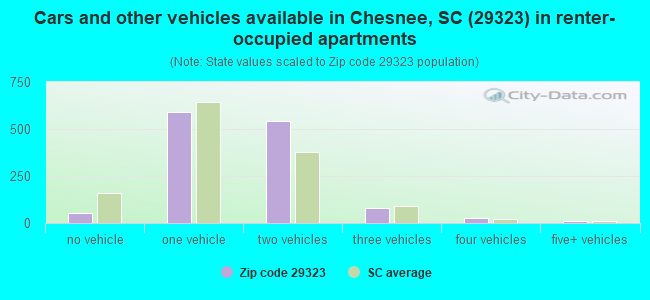
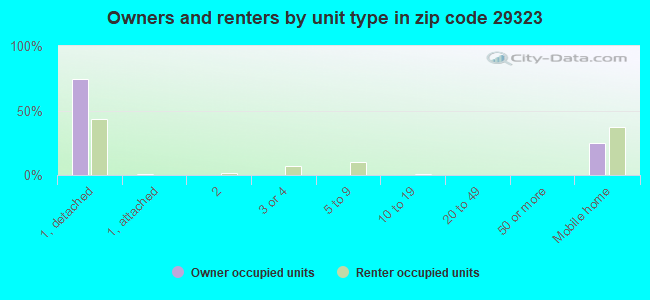
Houses and condos: 6,544 Renter-occupied apartments: 1,302
% of renters here:
21%
State:
28%
March 2022 cost of living index in zip code 29323: 80.8 (low, U.S. average is 100)
Land area: 70.3 sq. mi. Water area: 1.3 sq. mi.
Population density: 220 people per square mile
(very low).
OSM Map
General Map
Google Map
MSN Map
OSM Map
General Map
Google Map
MSN Map
OSM Map
General Map
Google Map
MSN Map
OSM Map
General Map
Google Map
MSN Map
Please wait while loading the map...
Real estate property taxes paid for housing units in 2022:
This zip code:
0.4% ($894)
South Carolina:
0.5% ($1,185)
Median real estate property taxes paid for housing units with mortgages in 2022: $1,019 (0.4%) Median real estate property taxes paid for housing units with no mortgage in 2022: $672 (0.5%)
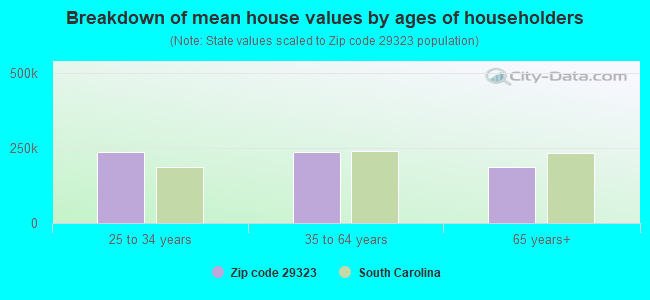
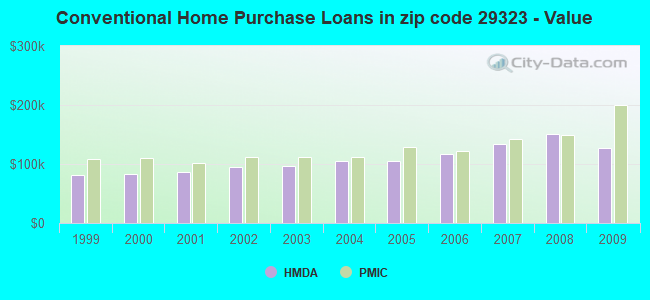
Estimated median house/condo value in 2022: $199,252
29323:
$199,252
South Carolina:
$254,600
According to our research of South Carolina and other state lists, there were 6 registered sex offenders living in 29323 zip code as of May 28, 2024. The ratio of all residents to sex offenders in zip code 29323 is 2,193 to 1. The ratio of registered sex offenders to all residents in this zip code is lower than the state average.
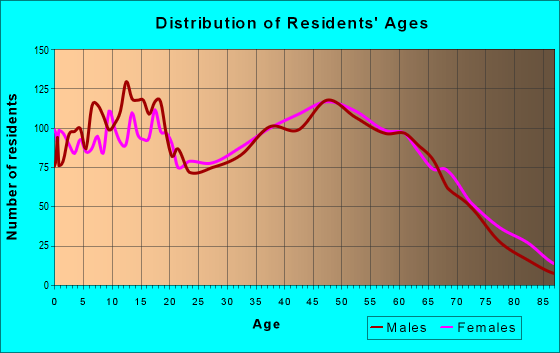
Median resident age:
This zip code:
39.2 years
South Carolina median age:
40.5 years
Average household size:
This zip code:
2.6 people
South Carolina:
2.4 people
Averages for the 2020 tax year for zip code 29323, filed in 2021:
Average Adjusted Gross Income (AGI) in 2020: $54,094 (Individual Income Tax Returns)
Here:
$54,094
State:
$65,754
Salary/wage: $48,298 (reported on 84.5% of returns)
Here:
$48,298
State:
$52,566
(% of AGI for various income ranges: 1179.4% for AGIs below $25k, 3748.5% for AGIs $25k-50k, 7228.9% for AGIs $50k-75k, 9947.0% for AGIs $75k-100k, 18194.5% for AGIs $100k-200k, 63366.0% for AGIs over 200k)
Taxable interest for individuals: $1,169 (reported on 18.8% of returns)
This zip code:
$1,169
South Carolina:
$1,749
(% of AGI for various income ranges: 11.1% for AGIs below $25k, 9.6% for AGIs $25k-50k, 38.0% for AGIs $50k-75k, 77.7% for AGIs $75k-100k, 70.6% for AGIs $100k-200k, 550.0% for AGIs over 200k)
Ordinary dividends: $4,260 (reported on 10.7% of returns)
Here:
$4,260
State:
$8,783
(% of AGI for various income ranges: 11.3% for AGIs below $25k, 28.7% for AGIs $25k-50k, 53.2% for AGIs $50k-75k, 48.6% for AGIs $75k-100k, 180.0% for AGIs $100k-200k, 2386.0% for AGIs over 200k)
Net capital gain/loss in AGI: +$8,323 (reported on 10.3% of returns)
Here:
+$8,323
State:
+$24,194
(% of AGI for various income ranges: 1.7% for AGIs below $25k, 29.7% for AGIs $25k-50k, 54.9% for AGIs $50k-75k, 95.0% for AGIs $75k-100k, 369.8% for AGIs $100k-200k, 6346.0% for AGIs over 200k)
Profit/loss from business: +$10,007 (reported on 16.3% of returns)
Here:
+$10,007
State:
+$11,253
(% of AGI for various income ranges: 120.9% for AGIs below $25k, 172.7% for AGIs $25k-50k, 231.6% for AGIs $50k-75k, 345.5% for AGIs $75k-100k, 549.4% for AGIs $100k-200k, 2002.0% for AGIs over 200k)
Taxable individual retirement arrangement distribution: $17,323 (reported on 7.8% of returns)
29323:
$17,323
South Carolina:
$21,604
(% of AGI for various income ranges: 47.8% for AGIs below $25k, 83.2% for AGIs $25k-50k, 202.3% for AGIs $50k-75k, 346.8% for AGIs $75k-100k, 542.1% for AGIs $100k-200k, 4090.0% for AGIs over 200k)
Total itemized deductions: $30,500 (reported on 5.4% of returns)
Here:
$30,500
State:
$35,199
(% of AGI for various income ranges: 78.3% for AGIs $25k-50k, 171.3% for AGIs $50k-75k, 339.5% for AGIs $75k-100k, 1004.9% for AGIs $100k-200k, 6326.0% for AGIs over 200k)
Charity contributions: $14,691 (reported on 4.4% of returns)
Here:
$14,691
State:
$14,319
(% of AGI for various income ranges: 12.9% for AGIs $25k-50k, 59.1% for AGIs $50k-75k, 91.1% for AGIs $75k-100k, 394.7% for AGIs $100k-200k, 3598.0% for AGIs over 200k)
Taxes paid: $7,259 (reported on 5.4% of returns)
29323:
$7,259
State:
$7,486
(% of AGI for various income ranges: 14.0% for AGIs $25k-50k, 38.0% for AGIs $50k-75k, 86.8% for AGIs $75k-100k, 279.1% for AGIs $100k-200k, 1264.0% for AGIs over 200k)
Earned income credit: $2,422 (reported on 20.3% of returns)
Here:
$2,422
State:
$2,397
(% of AGI for various income ranges: 114.0% for AGIs below $25k, 85.4% for AGIs $25k-50k, 2.8% for AGIs $50k-75k)
Percentage of individuals using paid preparers for their 2020 taxes: 95.2%
Here:
95%
State:
93%
(% for various income ranges: 94.5% for AGIs below $25k, 96.0% for AGIs $25k-50k, 95.5% for AGIs $50k-75k, 95.4% for AGIs $75k-100k, 95.2% for AGIs $100k-200k, 93.8% for AGIs over 200k)
Averages for the 2012 tax year for zip code 29323, filed in 2013:
Average Adjusted Gross Income (AGI) in 2012: $41,564 (Individual Income Tax Returns)
Here:
$41,564
State:
$51,133
Salary/wage: $37,615 (reported on 86.9% of returns)
Here:
$37,615
State:
$42,173
(% of AGI for various income ranges: 76.9% for AGIs below $25k, 84.4% for AGIs $25k-50k, 82.3% for AGIs $50k-75k, 81.3% for AGIs $75k-100k, 78.5% for AGIs $100k-200k, 41.8% for AGIs over 200k)
Taxable interest for individuals: $1,049 (reported on 20.2% of returns)
This zip code:
$1,049
South Carolina:
$1,468
(% of AGI for various income ranges: 0.8% for AGIs below $25k, 0.4% for AGIs $25k-50k, 0.3% for AGIs $50k-75k, 0.5% for AGIs $75k-100k, 0.7% for AGIs $100k-200k, 0.6% for AGIs over 200k)
Ordinary dividends: $2,389 (reported on 10.6% of returns)
Here:
$2,389
State:
$6,511
(% of AGI for various income ranges: 0.5% for AGIs below $25k, 0.5% for AGIs $25k-50k, 0.4% for AGIs $50k-75k, 0.4% for AGIs $75k-100k, 1.0% for AGIs $100k-200k, 1.2% for AGIs over 200k)
Net capital gain/loss in AGI: +$2,791 (reported on 7.7% of returns)
Here:
+$2,791
State:
+$13,061
(% of AGI for various income ranges: 0.1% for AGIs $25k-50k, 0.3% for AGIs $50k-75k, 0.7% for AGIs $75k-100k, 0.7% for AGIs $100k-200k, 3.3% for AGIs over 200k)
Profit/loss from business: +$9,788 (reported on 15.0% of returns)
Here:
+$9,788
State:
+$10,167
(% of AGI for various income ranges: 8.1% for AGIs below $25k, 3.0% for AGIs $25k-50k, 2.9% for AGIs $50k-75k, 2.1% for AGIs $75k-100k, 3.9% for AGIs $100k-200k)
Taxable individual retirement arrangement distribution: $12,466 (reported on 7.4% of returns)
29323:
$12,466
South Carolina:
$17,019
(% of AGI for various income ranges: 2.1% for AGIs below $25k, 1.9% for AGIs $25k-50k, 1.7% for AGIs $50k-75k, 2.3% for AGIs $75k-100k, 3.8% for AGIs $100k-200k)
Total itemized deductions: $18,980 (24% of AGI, reported on 24.2% of returns)
Here:
$18,980
State:
$22,890
Here:
23.7% of AGI
State:
21.4% of AGI
(% of AGI for various income ranges: 6.6% for AGIs below $25k, 7.7% for AGIs $25k-50k, 11.0% for AGIs $50k-75k, 13.7% for AGIs $75k-100k, 15.6% for AGIs $100k-200k, 12.0% for AGIs over 200k)
Charity contributions: $4,810 (reported on 20.4% of returns)
Here:
$4,810
State:
$5,169
(% of AGI for various income ranges: 0.9% for AGIs below $25k, 1.3% for AGIs $25k-50k, 2.4% for AGIs $50k-75k, 3.2% for AGIs $75k-100k, 3.6% for AGIs $100k-200k, 2.9% for AGIs over 200k)
Taxes paid: $5,853 (reported on 24.1% of returns)
29323:
$5,853
State:
$7,644
(% of AGI for various income ranges: 0.8% for AGIs below $25k, 1.7% for AGIs $25k-50k, 2.9% for AGIs $50k-75k, 4.4% for AGIs $75k-100k, 6.0% for AGIs $100k-200k, 5.9% for AGIs over 200k)
Earned income credit: $2,440 (reported on 25.4% of returns)
Here:
$2,440
State:
$2,418
(% of AGI for various income ranges: 8.5% for AGIs below $25k, 1.6% for AGIs $25k-50k)
Percentage of individuals using paid preparers for their 2012 taxes: 61.3%
Here:
61%
State:
57%
(% for various income ranges: 58.0% for AGIs below $25k, 62.6% for AGIs $25k-50k, 64.0% for AGIs $50k-75k, 65.3% for AGIs $75k-100k, 63.2% for AGIs $100k-200k, 100.0% for AGIs over 200k)
Averages for the 2004 tax year for zip code 29323, filed in 2005:
Average Adjusted Gross Income (AGI) in 2004: $34,526 (Individual Income Tax Returns)
Here:
$34,526
State:
$41,965
Salary/wage: $32,728 (reported on 88.8% of returns)
Here:
$32,728
State:
$35,695
(% of AGI for various income ranges: 107.4% for AGIs below $10k, 83.2% for AGIs $10k-25k, 87.7% for AGIs $25k-50k, 86.9% for AGIs $50k-75k, 87.6% for AGIs $75k-100k, 66.6% for AGIs over 100k)
Taxable interest for individuals: $1,177 (reported on 27.0% of returns)
This zip code:
$1,177
South Carolina:
$1,623
(% of AGI for various income ranges: 2.9% for AGIs below $10k, 1.4% for AGIs $10k-25k, 0.7% for AGIs $25k-50k, 0.6% for AGIs $50k-75k, 0.4% for AGIs $75k-100k, 1.6% for AGIs over 100k)
Taxable dividends: $1,379 (reported on 11.5% of returns)
Here:
$1,379
State:
$3,999
(% of AGI for various income ranges: 1.6% for AGIs below $10k, 0.5% for AGIs $10k-25k, 0.4% for AGIs $25k-50k, 0.2% for AGIs $50k-75k, 0.2% for AGIs $75k-100k, 1.1% for AGIs over 100k)
Net capital gain/loss: +$5,456 (reported on 8.2% of returns)
Here:
+$5,456
State:
+$13,100
(% of AGI for various income ranges: -2.1% for AGIs below $10k, 0.3% for AGIs $10k-25k, 0.4% for AGIs $25k-50k, 0.8% for AGIs $50k-75k, 0.6% for AGIs $75k-100k, 6.0% for AGIs over 100k)
Profit/loss from business: +$7,043 (reported on 13.6% of returns)
Here:
+$7,043
State:
+$9,144
(% of AGI for various income ranges: -17.2% for AGIs below $10k, 5.0% for AGIs $10k-25k, 2.8% for AGIs $25k-50k, 2.6% for AGIs $50k-75k, 2.9% for AGIs $75k-100k, 3.4% for AGIs over 100k)
IRA payment deduction: $3,345 (reported on 1.5% of returns)
29323:
$3,345
South Carolina:
$2,972
(% of AGI for various income ranges: 0.1% for AGIs $10k-25k, 0.2% for AGIs $25k-50k, 0.2% for AGIs $50k-75k, 0.2% for AGIs over 100k)
Total itemized deductions: $15,826 (25% of AGI, reported on 29.4% of returns)
Here:
$15,826
State:
$19,039
Here:
25.2% of AGI
State:
22.8% of AGI
(% of AGI for various income ranges: 10.3% for AGIs below $10k, 7.0% for AGIs $10k-25k, 11.2% for AGIs $25k-50k, 16.4% for AGIs $50k-75k, 17.2% for AGIs $75k-100k, 15.9% for AGIs over 100k)
Charity contributions deductions: $3,761 (6% of AGI, reported on 24.9% of returns)
Here:
$3,761
State:
$4,305
Here:
5.7% of AGI
State:
5.0% of AGI
(% of AGI for various income ranges: 0.9% for AGIs below $10k, 1.3% for AGIs $10k-25k, 2.0% for AGIs $25k-50k, 3.1% for AGIs $50k-75k, 3.6% for AGIs $75k-100k, 4.2% for AGIs over 100k)
Total tax: $4,088 (reported on 69.4% of returns)
29323:
$4,088
State:
$6,497
(% of AGI for various income ranges: 3.6% for AGIs below $10k, 3.6% for AGIs $10k-25k, 6.1% for AGIs $25k-50k, 7.9% for AGIs $50k-75k, 9.9% for AGIs $75k-100k, 16.4% for AGIs over 100k)
Earned income credit: $1,825 (reported on 23.2% of returns)
Here:
$1,825
State:
$1,882
Percentage of individuals using paid preparers for their 2004 taxes: 68.8%
Here:
69%
State:
66%
(% for various income ranges: 62.1% for AGIs below $10k, 71.3% for AGIs $10k-25k, 71.1% for AGIs $25k-50k, 69.1% for AGIs $50k-75k, 67.4% for AGIs $75k-100k, 69.0% for AGIs over 100k)
Likely homosexual households (counted as self-reported same-sex unmarried-partner households)
Lesbian couples: 0.2% of all households
Gay men: 0.0% of all households
Household received Food Stamps/SNAP in the past 12 months: 592 Household did not receive Food Stamps/SNAP in the past 12 months: 5,457
Women who had a birth in the past 12 months: 60 (18 now married, 39 unmarried) Women who did not have a birth in the past 12 months: 3,428 (1,848 now married, 1,595 unmarried)
Housing units in zip code 29323 with a mortgage: 2,321 (138 second mortgage, 22 home equity loan, 60 both second mortgage and home equity loan) Houses without a mortgage: 115
Median monthly owner costs for units with a mortgage: $1,186 Median monthly owner costs for units without a mortgage: $341
Residents with income below the poverty level in 2022:
This zip code:
11.8%
Whole state:
14.0%
Residents with income below 50% of the poverty level in 2022:
This zip code:
7.0%
Whole state:
7.3%
Median number of rooms in houses and condos:
Here:
6.0
State:
6.4
Median number of rooms in apartments:
Here:
4.6
State:
4.5
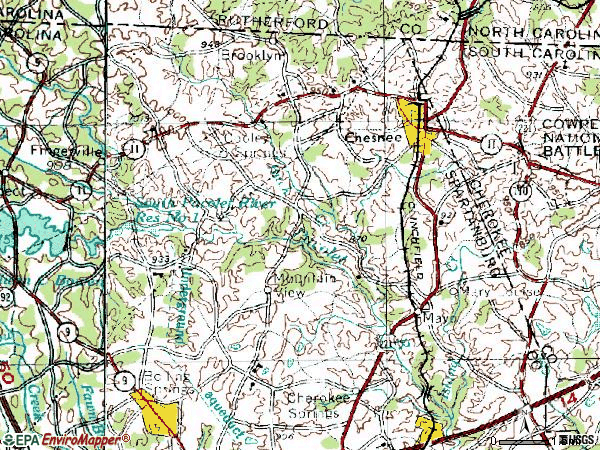
Notable locations in this zip code not listed on our city pages
Notable locations in zip code 29323: Cherokee Creek Volunteer Fire Department Station 2 (A), Cooley Springs Fire Department (B), Unknown (C), Mayo Fire Department Substation (D), Chesnee Community Fire Department (E), Cherokee Springs Fire Department (F), Cherokee Creek Volunteer Fire Department (G), Chesnee City Fire Department (H), Arrowood Branch Fire Department (I), Chesnee Community Fire Department (J). Display/hide their locations on the map
Churches in zip code 29323 include: Providence Church (A), Piedmont Baptist Church (B), Rainbow Church (C), Fosters Grove Baptist Church (D), Cooley Springs Baptist Church (E), Eden Church (F), Grace Chapel (G), Gaffney Chapel (H), Fairview Church (I). Display/hide their locations on the map
Cemeteries: Byars Cemetery (1), Johnson Cemetery (2), Painter Cemetery (3), Trinity United Methodist Cemetery (4), Robbins Cemetery (5), Piedmont Baptist Church Cemetery (6), Gethsemane Cemetery (7). Display/hide their locations on the map
Streams, rivers, and creeks: Obed Creek (A), Rocky Ford Branch (B), South Pacolet River (C), Thompson Creek (D), Little Horse Creek (E), Cudds Creek (F), Casey Creek (G), Carlisle Branch (H), Ezell Branch (I). Display/hide their locations on the map
In group quarters: 24 (-1 institutionalized population)
Size of family households: 1,962 2-persons, 1,185 3-persons, 734 4-persons, 315 5-persons, 73 6-persons, 76 7-or-more-persons
Size of nonfamily households: 1,312 1-person, 370 2-persons, 16 4-persons
2,177 married couples with children.
939 single-parent households (160 men, 779 women).
92.2% of residents of 29323 zip code speak English at home.
4.5% of residents speak Spanish at home (87% very well, 12% well, 1% not at all).
1.4% of residents speak other Indo-European language at home (88% very well, 12% not at all).
1.7% of residents speak Asian or Pacific Island language at home (37% very well, 39% well, 17% not well, 8% not at all).
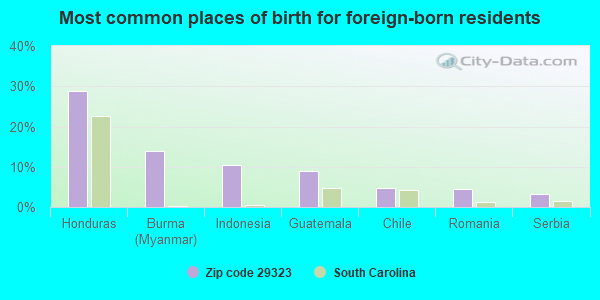
Foreign born population: 755 (4.9%) (52.3% of them are naturalized citizens)
This zip code:
4.9%
Whole state:
5.2%
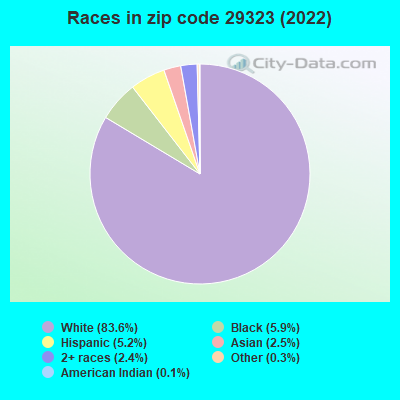
29%Honduras
14%Burma (Myanmar)
10%Indonesia
9%Guatemala
5%Chile
5%Romania
3%Serbia
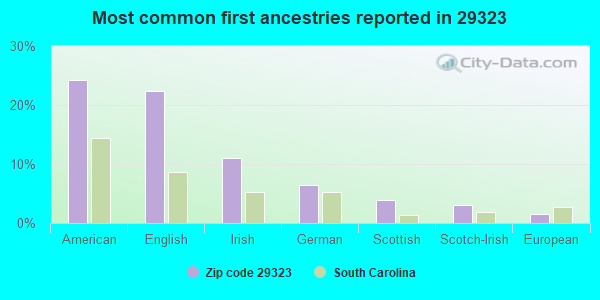
24%American
22%English
11%Irish
6%German
4%Scottish
3%Scotch-Irish
2%European
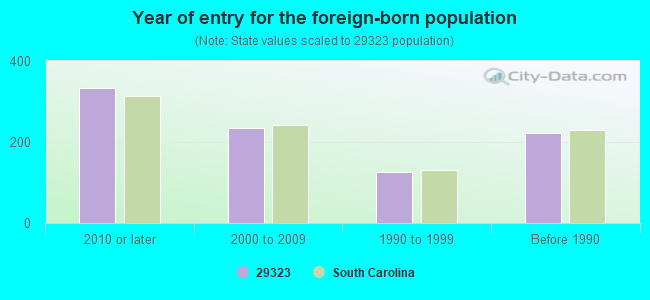
Year of entry for the foreign-born population
3342010 or later
2342000 to 2009
1271990 to 1999
223Before 1990
Facilities with environmental interests located in this zip code:
CHESNEE WASTE WATER TREATMENT FACILITY (201 WEST CHEROKEE STREET in CHESNEE, SC)
CRITERIA AND HAZARDOUS AIR POLLUTANT INVENTORY (Inventory of air pollution sources) National Pollutant Discharge Elimination System NON-MAJOR (Tracking pollutant discharge elimination systems) - permit STATE MASTER (South Carolina database) - LABORATORY CERTIFICATION, National Pollutant Discharge Elimination System Permit Business SIC classification: SEWERAGE SYSTEMS Organizations: CHESNEE WWTF (CONTACT/OWNER)
Alternative names: CHESNEE WASTE TREATMENT PLANT, CHESNEE WWTF
CSX TRANSPORTATION (312 WEST CHEROKEE ST. in CHESNEE, SC)
(Resource Conservation and Recovery Act (tracking hazardous waste)) STATE MASTER (South Carolina database) - UNDERGROUND STORAGE TANK PROGRAM Organizations: OPERNAME (CONTACT/OPERATOR)
, CSX TRANSPORTATION INC. (CONTACT/OWNER)
CHESNEE ELEMENTARY SCHOOL (212 N ALABAMA AVE in CHESNEE, SC)
(Geographic Names Information System) (National Center for Education Statistics) - STATE ID-4202018 Organizations: SPARTANBURG COUNTY SCHOOL DISTRICT 02 (SCHOOL DISTRICT)
CHESNEE HIGH SCHOOL (795 S ALABAMA AVE in CHESNEE, SC)
(Geographic Names Information System) (National Center for Education Statistics) - STATE ID-4202013 Organizations: SPARTANBURG COUNTY SCHOOL DISTRICT 02 (SCHOOL DISTRICT)
CHESNEE MIDDLE (805 S ALABAMA AVENUE in CHESNEE, SC)
(National Center for Education Statistics) - STATE ID-4202086 Organizations: SPARTANBURG COUNTY SCHOOL DISTRICT 02 (SCHOOL DISTRICT)
COOLEY SPGS-FINGERVILLE (140 COOLEY SPRINGS SCHOOL RD in CHESNEE, SC)
(National Center for Education Statistics) - STATE ID-4202019 Organizations: SPARTANBURG COUNTY SCHOOL DISTRICT 02 (SCHOOL DISTRICT)
B&B CLEANERS (219 ALABAMA ST in CHESNEE, SC)
(Resource Conservation and Recovery Act (tracking hazardous waste)) Alternative names: B & B DRY CLEANER , B & B DRY CLEANER DEACT
DEB'S MINI MART (3695 CHESNEE HIGHWAY in CHESNEE, SC)
National Pollutant Discharge Elimination System NON-MAJOR (Tracking pollutant discharge elimination systems) - permit Business SIC classification: CARWASHES
CHEROKEE TEXTILES (630 WOFFORD ST in CHESNEE, SC)
AIR MINOR (AIRS/AFS) Business SIC classification: BROADWOVEN FABRIC MILLS, MANMADE FIBER AND SILK
COMMUNITY CASH # 7 (GENERAL DELIVERY in CHESNEE, SC)
AIR MINOR (AIRS/AFS) Business SIC classification: GROCERY STORES
EGGERS FUNERAL HOME (815 S. ALABAMA AVE. in CHESNEE, SC)
AIR MINOR (AIRS/AFS) Business SIC classification: FUNERAL SERVICE AND CREMATORIES
FOOTHILLS FORD OF CHESNEE (5710 CHESNEE HWY in CHESNEE, SC)
Conditionally Exempt Small Quantity Generators, less than 100 kg/month of hazardous waste (Resource Conservation and Recovery Act (tracking hazardous waste)) - notification Organizations: OPERNAME (CONTACT/OPERATOR)
, FOOTHILLS FORD INC (CONTACT/OWNER)
Alternative names: BURNS RONNIE FORD INC, RONNIE BURNS FORD INC
Housing units lacking complete plumbing facilities: 3.8% Housing units lacking complete kitchen facilities: 1.1%
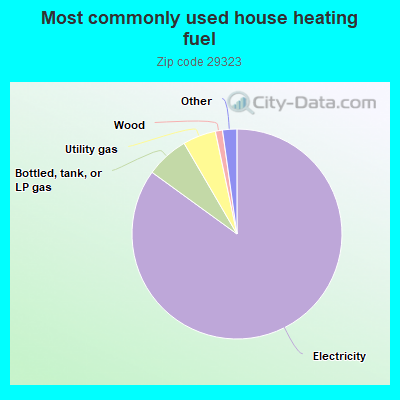
85.0%Electricity
6.6%Bottled, tank, or LP gas
5.1%Utility gas
1.1%Wood
0.9%Fuel oil, kerosene, etc.
0.8%No fuel used
Population in 1990: 14,714.
Place of birth for U.S.-born residents:
This state: 10,189
Northeast: 652
Midwest: 319
South: 2,785
West: 410
63% of the 29323 zip code residents lived in the same house 5 years ago. Out of people who lived in different houses, 63% lived in this county. Out of people who lived in different counties, 50% lived in South Carolina.
95% of the 29323 zip code residents lived in the same house 1 year ago. Out of people who lived in different houses, 51% moved from this county. Out of people who lived in different houses, 11% moved from different county within same state. Out of people who lived in different houses, 32% moved from different state. Out of people who lived in different houses, 3% moved from abroad.
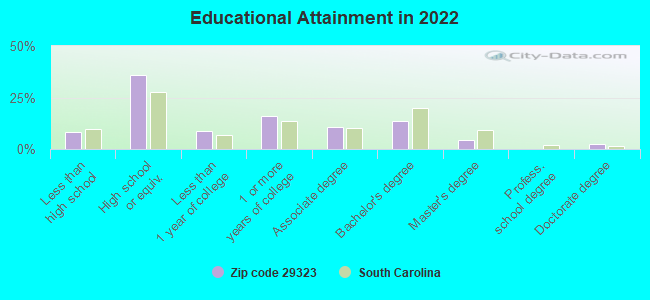
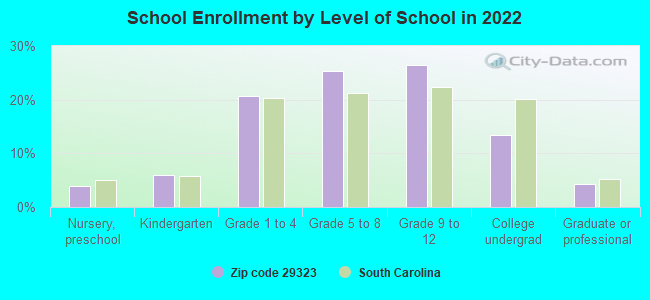
Private vs. public school enrollment:
Students in private schools in grades 1 to 8 (elementary and middle school): 182
Here:
11.5%
South Carolina:
14.4%
Students in private schools in grades 9 to 12 (high school): 21
Here:
2.4%
South Carolina:
11.1%
Students in private undergraduate colleges: 87
Here:
18.9%
South Carolina:
21.9%
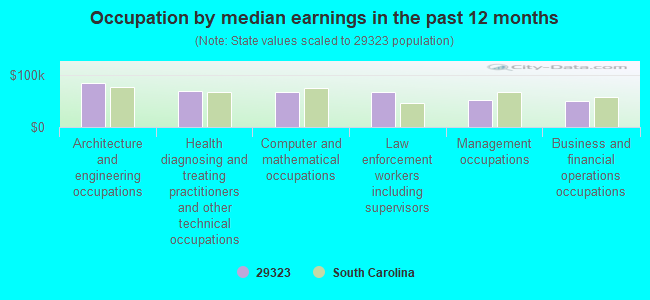
Occupation by median earnings in the past 12 months ($)
85,086Architecture and engineering occupations
69,696Health diagnosing and treating practitioners and other technical occupations
68,190Computer and mathematical occupations
66,924Law enforcement workers including supervisors
51,670Management occupations
50,863Business and financial operations occupations
Top industries in this zip code by the number of employees in 2005:
2002 - 2018 National Fire Incident Reporting System (NFIRS) incidents
According to the data from the years 2002 - 2018 the average number of fire incidents per year is 123. The highest number of fire incidents - 219 took place in 2016, and the least - 28 in 2002. The data has an increasing trend.
When looking into fire subcategories, the most reports belonged to: Outside Fires (43.4%), and Structure Fires (42.0%).
Fire incident types reported to NFIRS in Zip Code 29323


 Nearest zip codes: 29368, 29338, 29316, 29330, 29303, 29329.


 According to the data from the years 2002 - 2018 the average number of fire incidents per year is 123. The highest number of fire incidents - 219 took place in 2016, and the least - 28 in 2002. The data has an increasing trend.
 When looking into fire subcategories, the most reports belonged to: Outside Fires (43.4%), and Structure Fires (42.0%).