Estimated zip code population in 2022: 15,387 Zip code population in 2010: 13,044 Zip code population in 2000: 9,037
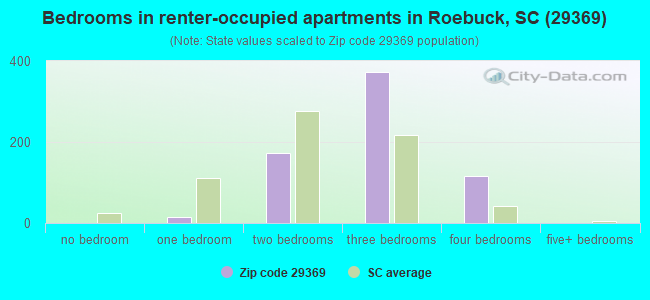
Houses and condos: 6,606 Renter-occupied apartments: 687
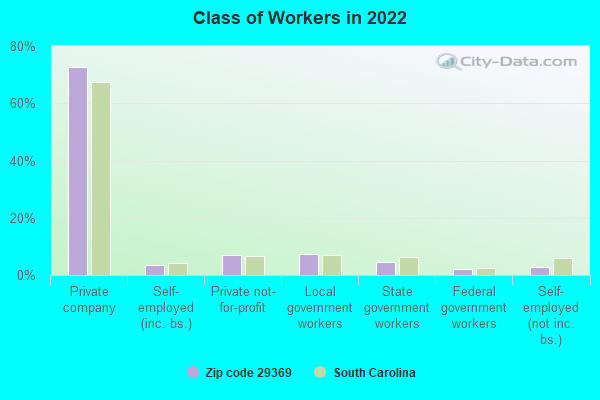
% of renters here:
11%
State:
28%
March 2022 cost of living index in zip code 29369: 84.1 (less than average, U.S. average is 100)
Land area: 28.5 sq. mi. Water area: 0.4 sq. mi.
Population density: 540 people per square mile
(low).
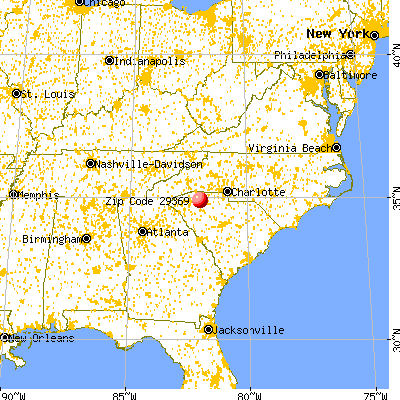
OSM Map
General Map
Google Map
MSN Map
OSM Map
General Map
Google Map
MSN Map
OSM Map
General Map
Google Map
MSN Map
OSM Map
General Map
Google Map
MSN Map
Please wait while loading the map...
Real estate property taxes paid for housing units in 2022:
This zip code:
0.5% ($1,265)
South Carolina:
0.5% ($1,185)
Median real estate property taxes paid for housing units with mortgages in 2022: $1,352 (0.5%) Median real estate property taxes paid for housing units with no mortgage in 2022: $1,094 (0.4%)
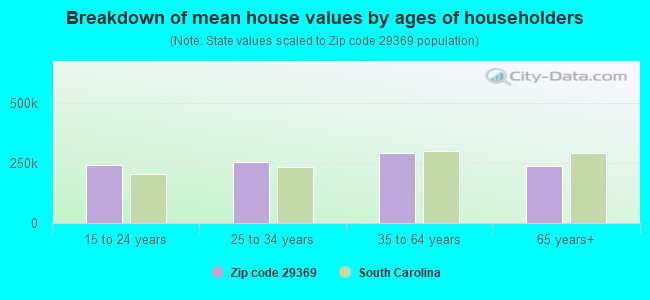
Estimated median house/condo value in 2022: $253,893
29369:
$253,893
South Carolina:
$254,600
According to our research of South Carolina and other state lists, there were 2 registered sex offenders living in 29369 zip code as of May 19, 2024. The ratio of all residents to sex offenders in zip code 29369 is 6,503 to 1. The ratio of registered sex offenders to all residents in this zip code is much lower than the state average.
Median resident age:
This zip code:
42.6 years
South Carolina median age:
40.5 years
Average household size:
This zip code:
2.4 people
South Carolina:
2.4 people
Averages for the 2020 tax year for zip code 29369, filed in 2021:
Average Adjusted Gross Income (AGI) in 2020: $67,984 (Individual Income Tax Returns)
Here:
$67,984
State:
$65,754
Salary/wage: $57,334 (reported on 84.5% of returns)
Here:
$57,334
State:
$52,566
(% of AGI for various income ranges: 1162.6% for AGIs below $25k, 3997.1% for AGIs $25k-50k, 6990.6% for AGIs $50k-75k, 10195.8% for AGIs $75k-100k, 19047.4% for AGIs $100k-200k, 74471.1% for AGIs over 200k)
Taxable interest for individuals: $1,155 (reported on 24.0% of returns)
This zip code:
$1,155
South Carolina:
$1,749
(% of AGI for various income ranges: 17.2% for AGIs below $25k, 13.1% for AGIs $25k-50k, 36.0% for AGIs $50k-75k, 69.2% for AGIs $75k-100k, 81.8% for AGIs $100k-200k, 557.8% for AGIs over 200k)
Ordinary dividends: $4,820 (reported on 17.3% of returns)
Here:
$4,820
State:
$8,783
(% of AGI for various income ranges: 28.3% for AGIs below $25k, 21.4% for AGIs $25k-50k, 63.5% for AGIs $50k-75k, 126.6% for AGIs $75k-100k, 302.4% for AGIs $100k-200k, 2896.7% for AGIs over 200k)
Net capital gain/loss in AGI: +$10,001 (reported on 16.0% of returns)
Here:
+$10,001
State:
+$24,194
(% of AGI for various income ranges: 2.4% for AGIs below $25k, 20.3% for AGIs $25k-50k, 67.6% for AGIs $50k-75k, 192.6% for AGIs $75k-100k, 588.8% for AGIs $100k-200k, 7540.0% for AGIs over 200k)
Profit/loss from business: +$9,092 (reported on 17.1% of returns)
Here:
+$9,092
State:
+$11,253
(% of AGI for various income ranges: 85.2% for AGIs below $25k, 104.1% for AGIs $25k-50k, 194.8% for AGIs $50k-75k, 292.3% for AGIs $75k-100k, 410.0% for AGIs $100k-200k, 3840.0% for AGIs over 200k)
Taxable individual retirement arrangement distribution: $17,393 (reported on 10.3% of returns)
29369:
$17,393
South Carolina:
$21,604
(% of AGI for various income ranges: 73.3% for AGIs below $25k, 116.7% for AGIs $25k-50k, 253.0% for AGIs $50k-75k, 415.5% for AGIs $75k-100k, 674.1% for AGIs $100k-200k, 2721.1% for AGIs over 200k)
Self-employed (Keogh) retirement plans: $20,200 (reported on 0.3% of returns)
29369:
$20,200
South Carolina:
$25,038
(% of AGI for various income ranges: 59.4% for AGIs $100k-200k)
Total itemized deductions: $32,886 (reported on 8.8% of returns)
Here:
$32,886
State:
$35,199
(% of AGI for various income ranges: 33.7% for AGIs below $25k, 97.4% for AGIs $25k-50k, 349.6% for AGIs $50k-75k, 488.5% for AGIs $75k-100k, 1123.2% for AGIs $100k-200k, 8815.6% for AGIs over 200k)
Charity contributions: $15,270 (reported on 7.7% of returns)
Here:
$15,270
State:
$14,319
(% of AGI for various income ranges: 26.7% for AGIs $25k-50k, 80.9% for AGIs $50k-75k, 122.6% for AGIs $75k-100k, 402.9% for AGIs $100k-200k, 5416.7% for AGIs over 200k)
Taxes paid: $7,387 (reported on 8.8% of returns)
29369:
$7,387
State:
$7,486
(% of AGI for various income ranges: 6.9% for AGIs below $25k, 13.8% for AGIs $25k-50k, 77.7% for AGIs $50k-75k, 118.7% for AGIs $75k-100k, 305.0% for AGIs $100k-200k, 1681.1% for AGIs over 200k)
Earned income credit: $2,171 (reported on 15.1% of returns)
Here:
$2,171
State:
$2,397
(% of AGI for various income ranges: 82.7% for AGIs below $25k, 80.4% for AGIs $25k-50k, 2.1% for AGIs $50k-75k)
Percentage of individuals using paid preparers for their 2020 taxes: 93.3%
Here:
93%
State:
93%
(% for various income ranges: 92.4% for AGIs below $25k, 93.3% for AGIs $25k-50k, 93.3% for AGIs $50k-75k, 94.1% for AGIs $75k-100k, 94.5% for AGIs $100k-200k, 93.8% for AGIs over 200k)
Averages for the 2012 tax year for zip code 29369, filed in 2013:
Average Adjusted Gross Income (AGI) in 2012: $59,372 (Individual Income Tax Returns)
Here:
$59,372
State:
$51,133
Salary/wage: $53,122 (reported on 87.7% of returns)
Here:
$53,122
State:
$42,173
(% of AGI for various income ranges: 75.0% for AGIs below $25k, 82.9% for AGIs $25k-50k, 79.4% for AGIs $50k-75k, 79.8% for AGIs $75k-100k, 81.7% for AGIs $100k-200k, 67.9% for AGIs over 200k)
Taxable interest for individuals: $1,071 (reported on 31.2% of returns)
This zip code:
$1,071
South Carolina:
$1,468
(% of AGI for various income ranges: 1.0% for AGIs below $25k, 0.6% for AGIs $25k-50k, 0.5% for AGIs $50k-75k, 0.3% for AGIs $75k-100k, 0.5% for AGIs $100k-200k, 0.8% for AGIs over 200k)
Ordinary dividends: $3,199 (reported on 20.1% of returns)
Here:
$3,199
State:
$6,511
(% of AGI for various income ranges: 1.8% for AGIs below $25k, 0.8% for AGIs $25k-50k, 0.7% for AGIs $50k-75k, 0.9% for AGIs $75k-100k, 1.1% for AGIs $100k-200k, 1.5% for AGIs over 200k)
Net capital gain/loss in AGI: +$4,745 (reported on 15.0% of returns)
Here:
+$4,745
State:
+$13,061
(% of AGI for various income ranges: 0.1% for AGIs $25k-50k, 0.6% for AGIs $50k-75k, 0.5% for AGIs $75k-100k, 0.8% for AGIs $100k-200k, 4.7% for AGIs over 200k)
Profit/loss from business: +$10,355 (reported on 15.0% of returns)
Here:
+$10,355
State:
+$10,167
(% of AGI for various income ranges: 6.3% for AGIs below $25k, 2.1% for AGIs $25k-50k, 2.0% for AGIs $50k-75k, 2.0% for AGIs $75k-100k, 2.1% for AGIs $100k-200k, 3.7% for AGIs over 200k)
Taxable individual retirement arrangement distribution: $14,944 (reported on 10.2% of returns)
29369:
$14,944
South Carolina:
$17,019
(% of AGI for various income ranges: 3.3% for AGIs below $25k, 2.6% for AGIs $25k-50k, 2.3% for AGIs $50k-75k, 2.8% for AGIs $75k-100k, 2.9% for AGIs $100k-200k, 1.7% for AGIs over 200k)
Self-employment retirement plans: $16,150 (reported on 0.3% of returns)
29369:
$16,150
South Carolina:
$21,023
Total itemized deductions: $20,826 (21% of AGI, reported on 41.7% of returns)
Here:
$20,826
State:
$22,890
Here:
20.8% of AGI
State:
21.4% of AGI
(% of AGI for various income ranges: 9.6% for AGIs below $25k, 12.6% for AGIs $25k-50k, 15.8% for AGIs $50k-75k, 15.2% for AGIs $75k-100k, 16.6% for AGIs $100k-200k, 13.0% for AGIs over 200k)
Charity contributions: $4,931 (reported on 36.8% of returns)
Here:
$4,931
State:
$5,169
(% of AGI for various income ranges: 1.2% for AGIs below $25k, 2.2% for AGIs $25k-50k, 3.0% for AGIs $50k-75k, 3.1% for AGIs $75k-100k, 3.9% for AGIs $100k-200k, 3.0% for AGIs over 200k)
Taxes paid: $7,066 (reported on 41.6% of returns)
29369:
$7,066
State:
$7,644
(% of AGI for various income ranges: 1.3% for AGIs below $25k, 2.7% for AGIs $25k-50k, 4.1% for AGIs $50k-75k, 4.8% for AGIs $75k-100k, 6.5% for AGIs $100k-200k, 6.4% for AGIs over 200k)
Earned income credit: $2,421 (reported on 17.0% of returns)
Here:
$2,421
State:
$2,418
(% of AGI for various income ranges: 7.4% for AGIs below $25k, 1.3% for AGIs $25k-50k)
Percentage of individuals using paid preparers for their 2012 taxes: 54.3%
Here:
54%
State:
57%
(% for various income ranges: 50.9% for AGIs below $25k, 54.3% for AGIs $25k-50k, 58.2% for AGIs $50k-75k, 54.7% for AGIs $75k-100k, 54.5% for AGIs $100k-200k, 72.2% for AGIs over 200k)
Averages for the 2004 tax year for zip code 29369, filed in 2005:
Average Adjusted Gross Income (AGI) in 2004: $50,744 (Individual Income Tax Returns)
Here:
$50,744
State:
$41,965
Salary/wage: $46,811 (reported on 89.2% of returns)
Here:
$46,811
State:
$35,695
(% of AGI for various income ranges: 104.1% for AGIs below $10k, 80.3% for AGIs $10k-25k, 84.4% for AGIs $25k-50k, 83.5% for AGIs $50k-75k, 87.9% for AGIs $75k-100k, 77.0% for AGIs over 100k)
Taxable interest for individuals: $1,318 (reported on 41.6% of returns)
This zip code:
$1,318
South Carolina:
$1,623
(% of AGI for various income ranges: 3.9% for AGIs below $10k, 1.7% for AGIs $10k-25k, 0.9% for AGIs $25k-50k, 0.9% for AGIs $50k-75k, 0.9% for AGIs $75k-100k, 1.1% for AGIs over 100k)
Taxable dividends: $1,874 (reported on 23.8% of returns)
Here:
$1,874
State:
$3,999
(% of AGI for various income ranges: 2.4% for AGIs below $10k, 1.1% for AGIs $10k-25k, 0.9% for AGIs $25k-50k, 0.7% for AGIs $50k-75k, 0.4% for AGIs $75k-100k, 1.1% for AGIs over 100k)
Net capital gain/loss: +$7,732 (reported on 18.0% of returns)
Here:
+$7,732
State:
+$13,100
(% of AGI for various income ranges: 2.7% for AGIs below $10k, 0.4% for AGIs $10k-25k, 0.1% for AGIs $25k-50k, 0.9% for AGIs $50k-75k, 0.4% for AGIs $75k-100k, 6.7% for AGIs over 100k)
Profit/loss from business: +$7,004 (reported on 14.1% of returns)
Here:
+$7,004
State:
+$9,144
(% of AGI for various income ranges: -6.0% for AGIs below $10k, 2.2% for AGIs $10k-25k, 1.7% for AGIs $25k-50k, 2.9% for AGIs $50k-75k, 1.2% for AGIs $75k-100k, 2.2% for AGIs over 100k)
IRA payment deduction: $3,094 (reported on 2.6% of returns)
29369:
$3,094
South Carolina:
$2,972
(% of AGI for various income ranges: 0.2% for AGIs $10k-25k, 0.2% for AGIs $25k-50k, 0.1% for AGIs $50k-75k, 0.2% for AGIs $75k-100k, 0.1% for AGIs over 100k)
Self-employed pension: $7,500 (reported on 0.4% of returns)
Here:
$7,500
South Carolina:
$15,117
Total itemized deductions: $18,750 (24% of AGI, reported on 49.5% of returns)
Here:
$18,750
State:
$19,039
Here:
23.8% of AGI
State:
22.8% of AGI
(% of AGI for various income ranges: 12.8% for AGIs below $10k, 13.0% for AGIs $10k-25k, 18.7% for AGIs $25k-50k, 20.7% for AGIs $50k-75k, 19.8% for AGIs $75k-100k, 17.1% for AGIs over 100k)
Charity contributions deductions: $4,027 (5% of AGI, reported on 44.3% of returns)
Here:
$4,027
State:
$4,305
Here:
5.0% of AGI
State:
5.0% of AGI
(% of AGI for various income ranges: 1.2% for AGIs below $10k, 1.8% for AGIs $10k-25k, 2.8% for AGIs $25k-50k, 3.5% for AGIs $50k-75k, 3.8% for AGIs $75k-100k, 4.1% for AGIs over 100k)
Total tax: $6,858 (reported on 77.1% of returns)
29369:
$6,858
State:
$6,497
(% of AGI for various income ranges: 2.7% for AGIs below $10k, 3.6% for AGIs $10k-25k, 6.6% for AGIs $25k-50k, 8.0% for AGIs $50k-75k, 9.6% for AGIs $75k-100k, 15.6% for AGIs over 100k)
Earned income credit: $1,759 (reported on 13.2% of returns)
Here:
$1,759
State:
$1,882
Percentage of individuals using paid preparers for their 2004 taxes: 60.1%
Here:
60%
State:
66%
(% for various income ranges: 47.9% for AGIs below $10k, 68.3% for AGIs $10k-25k, 64.5% for AGIs $25k-50k, 63.1% for AGIs $50k-75k, 54.3% for AGIs $75k-100k, 58.8% for AGIs over 100k)
Household received Food Stamps/SNAP in the past 12 months: 552 Household did not receive Food Stamps/SNAP in the past 12 months: 5,841
Women who had a birth in the past 12 months: 162 (135 now married, 32 unmarried) Women who did not have a birth in the past 12 months: 3,115 (1,361 now married, 1,755 unmarried)
Housing units in zip code 29369 with a mortgage: 3,710 (228 second mortgage, 188 both second mortgage and home equity loan) Houses without a mortgage: 63
Median monthly owner costs for units with a mortgage: $1,257 Median monthly owner costs for units without a mortgage: $380
Residents with income below the poverty level in 2022:
This zip code:
6.3%
Whole state:
14.0%
Residents with income below 50% of the poverty level in 2022:
This zip code:
4.5%
Whole state:
7.3%
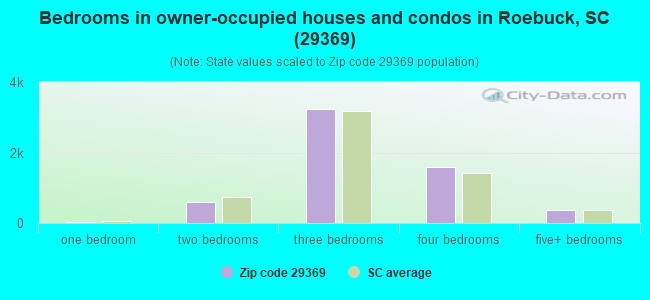
Median number of rooms in houses and condos:
Here:
6.7
State:
6.4
Median number of rooms in apartments:
Here:
5.2
State:
4.5
Notable locations in this zip code not listed on our city pages
Notable locations in zip code 29369: Poplar Springs Fire Department Station 1 (A), Poplar Springs Fire Department Station 3 (B). Display/hide their locations on the map
Churches in zip code 29369 include: Nazareth Presbyterian Church (A), Bethany Church (B), Poplar Springs Baptist Church (C), Fairmont Church (D), Community Bibleway Church (E), Blackstock Church (F), Bethlehem Church (G), Switzer Church (H), Moore Church (I). Display/hide their locations on the map
1,973 married couples with children.
1,294 single-parent households (57 men, 1,237 women).
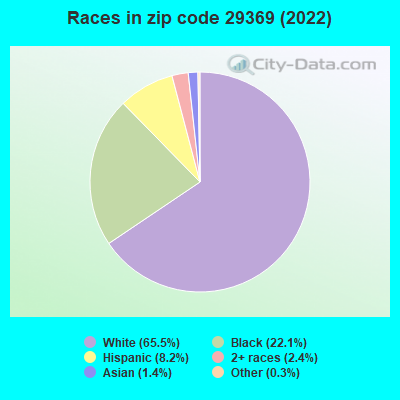
87.5% of residents of 29369 zip code speak English at home.
9.2% of residents speak Spanish at home (69% very well, 11% well, 13% not well, 7% not at all).
3.0% of residents speak other Indo-European language at home (61% very well, 33% well, 5% not well).
0.9% of residents speak Asian or Pacific Island language at home (70% very well, 30% well).
0.1% of residents speak other language at home (100% very well).
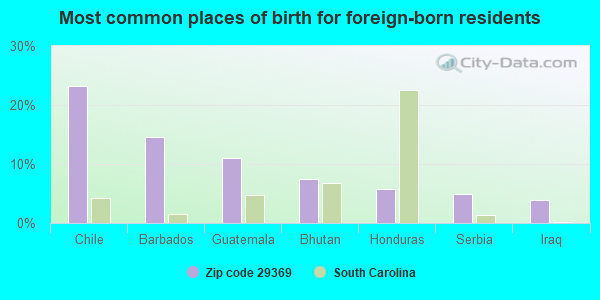
Foreign born population: 1,339 (8.7%) (68.0% of them are naturalized citizens)
This zip code:
8.7%
Whole state:
5.2%
23%Chile
15%Barbados
11%Guatemala
8%Bhutan
6%Honduras
5%Serbia
4%Iraq
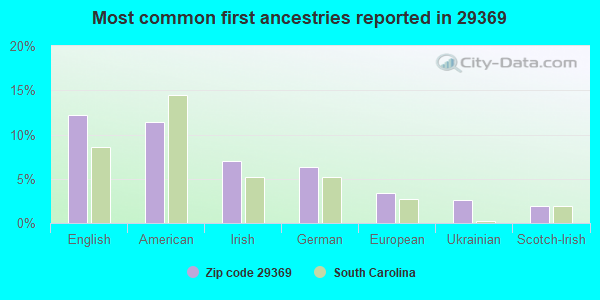
12%English
11%American
7%Irish
6%German
3%European
3%Ukrainian
2%Scotch-Irish
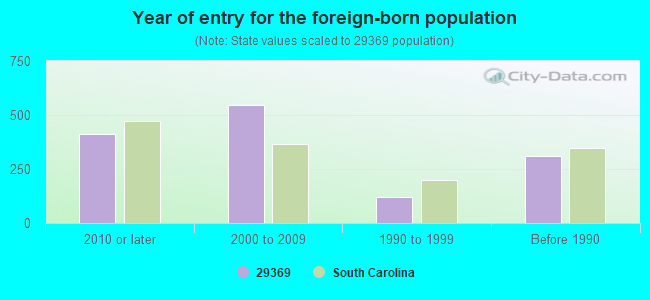
Year of entry for the foreign-born population
4122010 or later
5462000 to 2009
1211990 to 1999
308Before 1990
Public high school in in zip code 29369 not listed on the city page:
Facilities with environmental interests located in this zip code:
CHAPMAN CONCRETE PRODUCTS - MOORE (6950 HWY 221 in MOORE, SC)
AIR MINOR (AIRS/AFS) ENFORCEMENT/COMPLIANCE ACTIVITY (Integrated Compliance Information System) FORMAL ENFORCEMENT ACTION (Integrated Compliance Information System) CRITERIA AND HAZARDOUS AIR POLLUTANT INVENTORY (Inventory of air pollution sources) STATE MASTER (South Carolina database) - AIR PROGRAM, UNDERGROUND STORAGE TANK PROGRAM Business SIC classification: ASPHALT PAVING MIXTURES AND BLOCKS; READY-MIXED CONCRETE
ANDERSON MILL ELEMENTARY (1845 OLD ANDERSON MILL RD. in MOORE, SC)
(National Center for Education Statistics) - STATE ID-4206088 Organizations: SPARTANBURG COUNTY SCHOOL DISTRICT 06 (SCHOOL DISTRICT)
E S WAGNER CO/MB KAHN PIT (EAST OF 221 BETW SC 290 & I-26 in MOORE, SC)
National Pollutant Discharge Elimination System NON-MAJOR (Tracking pollutant discharge elimination systems) - permit Business SIC classification: MISCELLANEOUS NONMETALLIC MINERALS, EXCEPT FUELS
Housing units lacking complete plumbing facilities: 1.2% Housing units lacking complete kitchen facilities: 0.5%
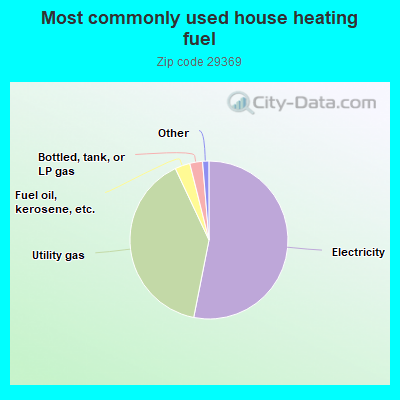
53.1%Electricity
39.9%Utility gas
3.1%Fuel oil, kerosene, etc.
2.6%Bottled, tank, or LP gas
0.8%Wood
0.6%No fuel used
Population in 1990: 6,791. Population change in the 1990s: +2,246 (+33.1%).
Place of birth for U.S.-born residents:
This state: 7,538
Northeast: 1,425
Midwest: 1,506
South: 3,250
West: 299
53% of the 29369 zip code residents lived in the same house 5 years ago. Out of people who lived in different houses, 70% lived in this county. Out of people who lived in different counties, 50% lived in South Carolina.
89% of the 29369 zip code residents lived in the same house 1 year ago. Out of people who lived in different houses, 47% moved from this county. Out of people who lived in different houses, 16% moved from different county within same state. Out of people who lived in different houses, 34% moved from different state. Out of people who lived in different houses, 0% moved from abroad.
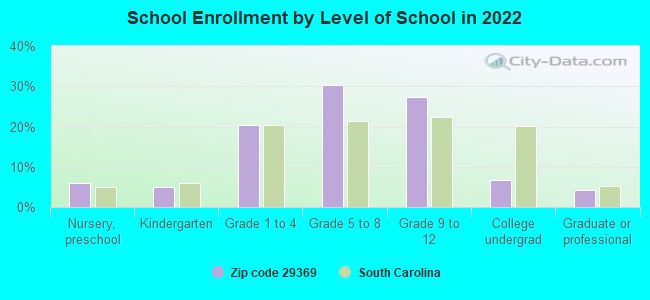
Private vs. public school enrollment:
Students in private schools in grades 1 to 8 (elementary and middle school): 315
Here:
17.2%
South Carolina:
14.4%
Students in private schools in grades 9 to 12 (high school): 92
Here:
9.5%
South Carolina:
11.1%
Students in private undergraduate colleges: 22
Here:
9.5%
South Carolina:
21.9%
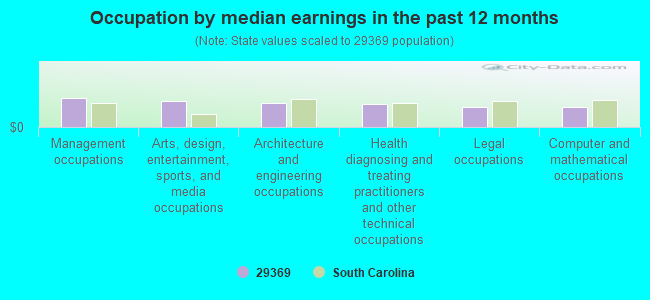
Occupation by median earnings in the past 12 months ($)
102,864Management occupations
89,711Arts, design, entertainment, sports, and media occupations
85,397Architecture and engineering occupations
81,821Health diagnosing and treating practitioners and other technical occupations
70,813Legal occupations
70,767Computer and mathematical occupations
Top industries in this zip code by the number of employees in 2005:
Other Services (except Public Administration): Religious Organizations (20-49 employees: 1 establishment, 5-9 employees: 5 establishments, 1-4 employees: 4 establishments)
Health Care and Social Assistance: Homes for the Elderly (20-49: 1, 10-19: 1)
Health Care and Social Assistance: Child Day Care Services (10-19: 2, 5-9: 1, 1-4: 1)
Administrative and Support and Waste Management and Remediation Services: Janitorial Services (20-49: 1, 1-4: 2)
Construction: Site Preparation Contractors (20-49: 1, 1-4: 1)
Construction: New Single-Family Housing Construction (except Operative Builders) (5-9: 3, 1-4: 4)
People in group quarters in 2000:
85 people in other noninstitutional group quarters
Fatal accident statistics in 2014:
Fatal accident count: 1
Vehicles involved in fatal accidents: 3
Fatal accidents caused by drunken drivers: 0
Fatalities: 1
Persons involved in fatal accidents: 4
Pedestrians involved in fatal accidents: 0
Fatal accident statistics in 2013:
Fatal accident count: 1
Vehicles involved in fatal accidents: 2
Fatal accidents caused by drunken drivers: 0
Fatalities: 1
Persons involved in fatal accidents: 2
Pedestrians involved in fatal accidents: 0
Home Mortgage Disclosure Act Aggregated Statistics For Year 2009 (Based on 4 partial tracts)
A) FHA, FSA/RHS & VA Home Purchase Loans
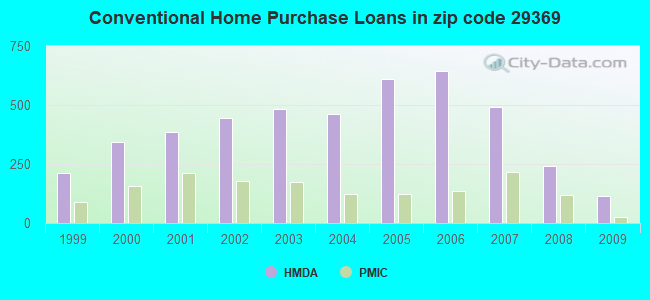
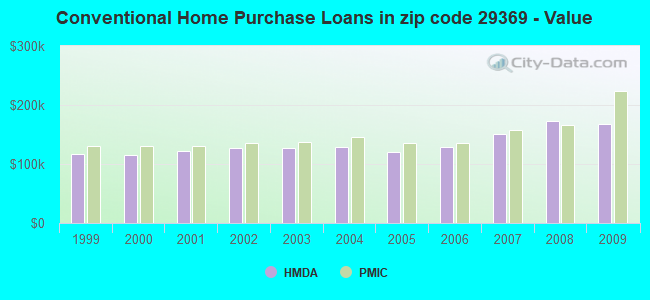
B) Conventional Home Purchase Loans
C) Refinancings
D) Home Improvement Loans
F) Non-occupant Loans on < 5 Family Dwellings (A B C & D)
G) Loans On Manufactured Home Dwelling (A B C & D)
Number
Average Value
Number
Average Value
Number
Average Value
Number
Average Value
Number
Average Value
Number
Average Value
LOANS ORIGINATED
181
$136,869
114
$167,838
538
$170,793
15
$95,043
33
$151,328
7
$66,867
APPLICATIONS APPROVED, NOT ACCEPTED
8
$129,462
3
$142,657
38
$150,908
3
$84,383
1
$146,620
1
$104,640
APPLICATIONS DENIED
34
$131,915
22
$138,348
209
$160,200
15
$41,601
9
$98,868
7
$61,810
APPLICATIONS WITHDRAWN
18
$132,390
13
$219,938
145
$176,493
4
$51,602
3
$160,620
1
$139,990
FILES CLOSED FOR INCOMPLETENESS
11
$140,640
8
$188,820
35
$153,311
3
$155,840
3
$53,873
1
$48,870
Aggregated Statistics For Year 2008 (Based on 4 partial tracts)
A) FHA, FSA/RHS & VA Home Purchase Loans
B) Conventional Home Purchase Loans
C) Refinancings
D) Home Improvement Loans
E) Loans on Dwellings For 5+ Families
F) Non-occupant Loans on < 5 Family Dwellings (A B C & D)
G) Loans On Manufactured Home Dwelling (A B C & D)
Number
Average Value
Number
Average Value
Number
Average Value
Number
Average Value
Number
Average Value
Number
Average Value
Number
Average Value
LOANS ORIGINATED
107
$142,588
242
$173,151
320
$149,679
24
$65,827
1
$270,990
60
$135,669
10
$96,379
APPLICATIONS APPROVED, NOT ACCEPTED
5
$169,548
19
$167,058
63
$135,025
3
$14,623
0
$0
8
$98,904
1
$83,960
APPLICATIONS DENIED
34
$132,166
34
$147,890
230
$133,258
34
$52,880
0
$0
17
$121,248
14
$55,638
APPLICATIONS WITHDRAWN
13
$132,460
30
$165,181
109
$165,464
8
$48,646
0
$0
8
$99,852
5
$85,172
FILES CLOSED FOR INCOMPLETENESS
5
$119,344
10
$114,844
20
$160,132
1
$6,890
0
$0
3
$111,543
0
$0
Aggregated Statistics For Year 2007 (Based on 4 partial tracts)
A) FHA, FSA/RHS & VA Home Purchase Loans
B) Conventional Home Purchase Loans
C) Refinancings
D) Home Improvement Loans
F) Non-occupant Loans on < 5 Family Dwellings (A B C & D)
G) Loans On Manufactured Home Dwelling (A B C & D)
Number
Average Value
Number
Average Value
Number
Average Value
Number
Average Value
Number
Average Value
Number
Average Value
LOANS ORIGINATED
44
$153,530
490
$150,794
318
$141,892
37
$45,642
105
$123,385
16
$53,956
APPLICATIONS APPROVED, NOT ACCEPTED
1
$234,160
50
$152,953
82
$122,614
12
$45,133
10
$113,382
4
$58,150
APPLICATIONS DENIED
7
$133,811
86
$130,810
339
$123,075
50
$59,802
27
$122,624
20
$55,296
APPLICATIONS WITHDRAWN
5
$158,064
42
$152,821
125
$142,870
6
$79,113
6
$118,515
3
$55,560
FILES CLOSED FOR INCOMPLETENESS
0
$0
17
$135,575
37
$133,172
2
$58,270
3
$177,820
0
$0
Aggregated Statistics For Year 2006 (Based on 4 partial tracts)
A) FHA, FSA/RHS & VA Home Purchase Loans
B) Conventional Home Purchase Loans
C) Refinancings
D) Home Improvement Loans
F) Non-occupant Loans on < 5 Family Dwellings (A B C & D)
G) Loans On Manufactured Home Dwelling (A B C & D)
Number
Average Value
Number
Average Value
Number
Average Value
Number
Average Value
Number
Average Value
Number
Average Value
LOANS ORIGINATED
26
$128,871
646
$129,081
400
$117,725
50
$34,013
125
$100,611
13
$46,496
APPLICATIONS APPROVED, NOT ACCEPTED
1
$85,410
64
$126,332
84
$115,192
8
$38,740
11
$128,579
8
$72,959
APPLICATIONS DENIED
7
$138,603
109
$101,834
335
$111,490
48
$36,874
26
$87,093
32
$49,198
APPLICATIONS WITHDRAWN
3
$121,770
69
$115,274
151
$122,631
8
$83,721
15
$81,027
3
$74,950
FILES CLOSED FOR INCOMPLETENESS
0
$0
18
$127,557
60
$133,302
1
$85,840
4
$63,192
0
$0
Aggregated Statistics For Year 2005 (Based on 4 partial tracts)
A) FHA, FSA/RHS & VA Home Purchase Loans
B) Conventional Home Purchase Loans
C) Refinancings
D) Home Improvement Loans
E) Loans on Dwellings For 5+ Families
F) Non-occupant Loans on < 5 Family Dwellings (A B C & D)
G) Loans On Manufactured Home Dwelling (A B C & D)
Number
Average Value
Number
Average Value
Number
Average Value
Number
Average Value
Number
Average Value
Number
Average Value
Number
Average Value
LOANS ORIGINATED
37
$139,644
609
$119,959
412
$127,802
33
$51,984
1
$187,980
106
$94,592
23
$54,067
APPLICATIONS APPROVED, NOT ACCEPTED
1
$134,090
50
$109,893
81
$103,188
10
$21,224
0
$0
8
$74,558
9
$63,443
APPLICATIONS DENIED
8
$106,758
98
$102,321
318
$115,159
54
$37,176
0
$0
22
$88,730
51
$56,585
APPLICATIONS WITHDRAWN
4
$101,040
48
$132,380
192
$131,977
15
$99,895
0
$0
13
$89,812
3
$53,317
FILES CLOSED FOR INCOMPLETENESS
1
$147,500
19
$97,617
79
$145,783
4
$60,468
0
$0
2
$86,515
1
$48,250
Aggregated Statistics For Year 2004 (Based on 4 partial tracts)
A) FHA, FSA/RHS & VA Home Purchase Loans
B) Conventional Home Purchase Loans
C) Refinancings
D) Home Improvement Loans
E) Loans on Dwellings For 5+ Families
F) Non-occupant Loans on < 5 Family Dwellings (A B C & D)
G) Loans On Manufactured Home Dwelling (A B C & D)
Number
Average Value
Number
Average Value
Number
Average Value
Number
Average Value
Number
Average Value
Number
Average Value
Number
Average Value
LOANS ORIGINATED
49
$119,094
462
$128,083
474
$122,099
42
$43,520
1
$156,650
84
$98,795
30
$49,282
APPLICATIONS APPROVED, NOT ACCEPTED
1
$95,870
43
$102,010
69
$107,369
8
$53,390
0
$0
3
$82,363
11
$49,074
APPLICATIONS DENIED
10
$90,956
87
$101,034
268
$115,130
44
$24,214
0
$0
12
$92,829
35
$60,318
APPLICATIONS WITHDRAWN
5
$123,304
41
$138,803
144
$115,113
11
$59,438
0
$0
9
$274,128
3
$56,603
FILES CLOSED FOR INCOMPLETENESS
1
$73,310
13
$94,478
43
$112,508
3
$76,447
0
$0
1
$60,660
1
$48,690
Aggregated Statistics For Year 2003 (Based on 4 partial tracts)
A) FHA, FSA/RHS & VA Home Purchase Loans
B) Conventional Home Purchase Loans
C) Refinancings
D) Home Improvement Loans
F) Non-occupant Loans on < 5 Family Dwellings (A B C & D)
Number
Average Value
Number
Average Value
Number
Average Value
Number
Average Value
Number
Average Value
LOANS ORIGINATED
58
$120,342
482
$127,112
1,032
$126,621
27
$45,485
68
$86,559
APPLICATIONS APPROVED, NOT ACCEPTED
5
$77,906
47
$99,482
127
$113,041
5
$19,302
6
$76,360
APPLICATIONS DENIED
12
$110,187
82
$92,664
284
$111,003
33
$22,063
12
$106,896
APPLICATIONS WITHDRAWN
5
$100,950
48
$117,639
182
$115,795
3
$31,407
6
$75,553
FILES CLOSED FOR INCOMPLETENESS
0
$0
13
$127,734
32
$130,027
0
$0
2
$123,435
Aggregated Statistics For Year 2002 (Based on 4 partial tracts)
A) FHA, FSA/RHS & VA Home Purchase Loans
B) Conventional Home Purchase Loans
C) Refinancings
D) Home Improvement Loans
E) Loans on Dwellings For 5+ Families
F) Non-occupant Loans on < 5 Family Dwellings (A B C & D)
Number
Average Value
Number
Average Value
Number
Average Value
Number
Average Value
Number
Average Value
Number
Average Value
LOANS ORIGINATED
37
$111,782
443
$127,382
688
$124,369
28
$26,233
1
$886,000
54
$89,259
APPLICATIONS APPROVED, NOT ACCEPTED
3
$105,780
30
$88,885
86
$104,728
8
$35,040
0
$0
2
$90,195
APPLICATIONS DENIED
9
$95,943
84
$91,957
259
$101,287
25
$20,146
0
$0
9
$92,138
APPLICATIONS WITHDRAWN
6
$104,860
32
$119,856
127
$115,559
2
$26,650
0
$0
4
$263,042
FILES CLOSED FOR INCOMPLETENESS
1
$159,780
9
$139,813
36
$114,769
1
$21,300
0
$0
1
$58,900
Aggregated Statistics For Year 2001 (Based on 4 partial tracts)
A) FHA, FSA/RHS & VA Home Purchase Loans
B) Conventional Home Purchase Loans
C) Refinancings
D) Home Improvement Loans
E) Loans on Dwellings For 5+ Families
F) Non-occupant Loans on < 5 Family Dwellings (A B C & D)
Number
Average Value
Number
Average Value
Number
Average Value
Number
Average Value
Number
Average Value
Number
Average Value
LOANS ORIGINATED
43
$113,677
384
$122,046
550
$115,520
38
$22,907
2
$886,000
48
$77,514
APPLICATIONS APPROVED, NOT ACCEPTED
2
$119,640
33
$117,783
57
$100,511
9
$24,802
0
$0
4
$105,652
APPLICATIONS DENIED
7
$80,037
85
$80,340
230
$83,152
19
$12,185
0
$0
7
$112,764
APPLICATIONS WITHDRAWN
2
$95,105
27
$114,674
112
$104,554
8
$10,694
0
$0
2
$99,315
FILES CLOSED FOR INCOMPLETENESS
0
$0
6
$102,380
20
$126,273
1
$11,970
0
$0
1
$56,390
Aggregated Statistics For Year 2000 (Based on 4 partial tracts)
A) FHA, FSA/RHS & VA Home Purchase Loans
B) Conventional Home Purchase Loans
C) Refinancings
D) Home Improvement Loans
F) Non-occupant Loans on < 5 Family Dwellings (A B C & D)
Number
Average Value
Number
Average Value
Number
Average Value
Number
Average Value
Number
Average Value
LOANS ORIGINATED
42
$99,996
342
$114,666
174
$87,709
37
$20,260
38
$86,323
APPLICATIONS APPROVED, NOT ACCEPTED
9
$43,280
42
$76,664
66
$83,425
10
$28,891
6
$73,382
APPLICATIONS DENIED
10
$69,587
105
$64,901
219
$73,442
40
$24,666
14
$72,929
APPLICATIONS WITHDRAWN
7
$93,360
27
$108,459
80
$65,724
4
$26,228
1
$62,660
FILES CLOSED FOR INCOMPLETENESS
1
$58,270
7
$94,871
36
$83,766
0
$0
5
$118,752
Aggregated Statistics For Year 1999 (Based on 2 partial tracts)
A) FHA, FSA/RHS & VA Home Purchase Loans
B) Conventional Home Purchase Loans
C) Refinancings
D) Home Improvement Loans
F) Non-occupant Loans on < 5 Family Dwellings (A B C & D)
Detailed PMIC statistics for the following Tracts:0220.01
, 0234.00
2002 - 2018 National Fire Incident Reporting System (NFIRS) incidents
According to the data from the years 2002 - 2018 the average number of fires per year is 41. The highest number of reported fire incidents - 72 took place in 2017, and the least - 10 in 2002. The data has a growing trend.
When looking into fire subcategories, the most incidents belonged to: Structure Fires (42.8%), and Outside Fires (40.2%).
Fire incident types reported to NFIRS in Zip Code 29369


 Nearest zip codes: 29301, 29376, 29375, 29320, 29377, 29306.


 (Students: 2,060, Location: 1151 CENTER POINT DRIVE, Grades: 9-12)


 According to the data from the years 2002 - 2018 the average number of fires per year is 41. The highest number of reported fire incidents - 72 took place in 2017, and the least - 10 in 2002. The data has a growing trend.
 When looking into fire subcategories, the most incidents belonged to: Structure Fires (42.8%), and Outside Fires (40.2%).