Estimated zip code population in 2022: 3,900 Zip code population in 2010: 4,507 Zip code population in 2000: 5,185
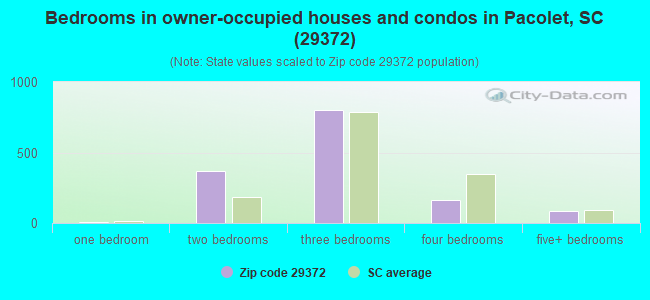
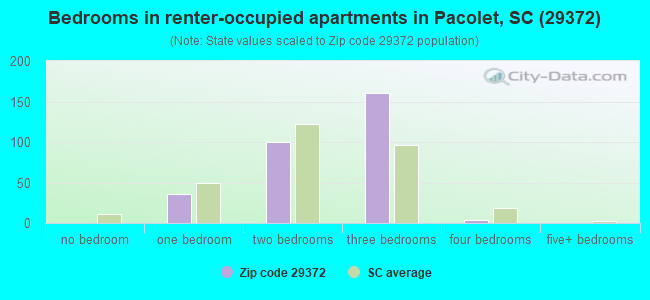
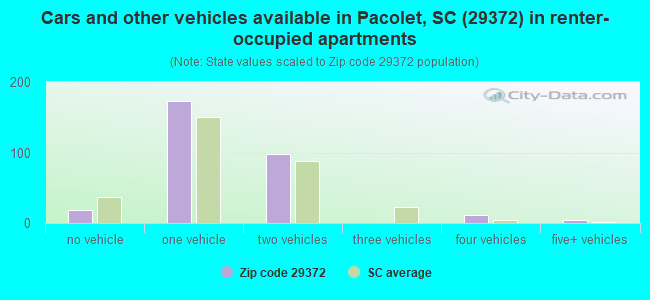
Houses and condos: 2,246 Renter-occupied apartments: 302
% of renters here:
17%
State:
28%
March 2022 cost of living index in zip code 29372: 79.3 (low, U.S. average is 100)
Land area: 42.4 sq. mi. Water area: 0.3 sq. mi.
Population density: 92 people per square mile
(very low).
OSM Map
General Map
Google Map
MSN Map
OSM Map
General Map
Google Map
MSN Map
OSM Map
General Map
Google Map
MSN Map
OSM Map
General Map
Google Map
MSN Map
Please wait while loading the map...
Real estate property taxes paid for housing units in 2022:
This zip code:
0.7% ($782)
South Carolina:
0.5% ($1,185)
Median real estate property taxes paid for housing units with mortgages in 2022: $919 (0.6%) Median real estate property taxes paid for housing units with no mortgage in 2022: $619 (0.6%)
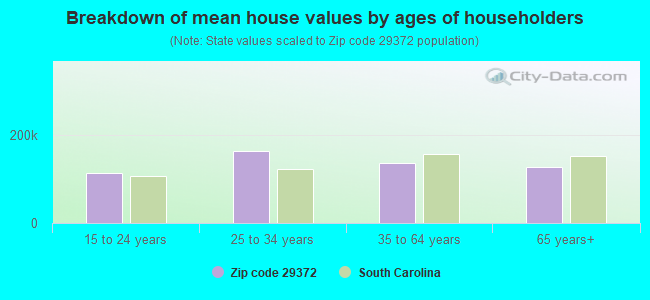
Estimated median house/condo value in 2022: $113,522
29372:
$113,522
South Carolina:
$254,600
According to our research of South Carolina and other state lists, there were 2 registered sex offenders living in 29372 zip code as of May 28, 2024. The ratio of all residents to sex offenders in zip code 29372 is 1,959 to 1. The ratio of registered sex offenders to all residents in this zip code is lower than the state average.
Median resident age:
This zip code:
45.5 years
South Carolina median age:
40.5 years
Average household size:
This zip code:
2.2 people
South Carolina:
2.4 people
Averages for the 2020 tax year for zip code 29372, filed in 2021:
Average Adjusted Gross Income (AGI) in 2020: $44,022 (Individual Income Tax Returns)
Here:
$44,022
State:
$65,754
Salary/wage: $37,964 (reported on 86.4% of returns)
Here:
$37,964
State:
$52,566
(% of AGI for various income ranges: 1229.6% for AGIs below $25k, 3758.0% for AGIs $25k-50k, 6827.1% for AGIs $50k-75k, 9515.8% for AGIs $75k-100k, 16517.8% for AGIs $100k-200k)
Taxable interest for individuals: $573 (reported on 13.1% of returns)
This zip code:
$573
South Carolina:
$1,749
(% of AGI for various income ranges: 6.0% for AGIs below $25k, 9.1% for AGIs $25k-50k, 2.4% for AGIs $50k-75k, 11.7% for AGIs $75k-100k, 60.0% for AGIs $100k-200k)
Ordinary dividends: $2,646 (reported on 6.6% of returns)
Here:
$2,646
State:
$8,783
(% of AGI for various income ranges: 6.8% for AGIs below $25k, 21.5% for AGIs $25k-50k, 49.2% for AGIs $75k-100k, 163.3% for AGIs $100k-200k)
Net capital gain/loss in AGI: +$10,467 (reported on 6.1% of returns)
Here:
+$10,467
State:
+$24,194
(% of AGI for various income ranges: 11.1% for AGIs $25k-50k, 24.8% for AGIs $50k-75k, 1284.4% for AGIs $100k-200k)
Profit/loss from business: +$6,325 (reported on 12.1% of returns)
Here:
+$6,325
State:
+$11,253
(% of AGI for various income ranges: 84.0% for AGIs below $25k, 91.5% for AGIs $25k-50k, 119.5% for AGIs $50k-75k, 250.0% for AGIs $75k-100k, 74.4% for AGIs $100k-200k)
Taxable individual retirement arrangement distribution: $19,725 (reported on 8.1% of returns)
29372:
$19,725
South Carolina:
$21,604
(% of AGI for various income ranges: 56.3% for AGIs below $25k, 106.7% for AGIs $25k-50k, 181.9% for AGIs $50k-75k, 287.5% for AGIs $75k-100k, 1796.7% for AGIs $100k-200k)
Total itemized deductions: $25,383 (reported on 3.0% of returns)
Here:
$25,383
State:
$35,199
(% of AGI for various income ranges: 145.0% for AGIs $25k-50k, 951.1% for AGIs $100k-200k)
Charity contributions: $16,225 (reported on 2.0% of returns)
Here:
$16,225
State:
$14,319
(% of AGI for various income ranges: 28.9% for AGIs below $25k, 537.8% for AGIs $100k-200k)
Taxes paid: $5,233 (reported on 3.0% of returns)
29372:
$5,233
State:
$7,486
(% of AGI for various income ranges: 19.8% for AGIs $25k-50k, 247.8% for AGIs $100k-200k)
Earned income credit: $2,457 (reported on 23.2% of returns)
Here:
$2,457
State:
$2,397
(% of AGI for various income ranges: 117.9% for AGIs below $25k, 99.6% for AGIs $25k-50k)
Percentage of individuals using paid preparers for their 2020 taxes: 93.9%
Here:
94%
State:
93%
(% for various income ranges: 92.1% for AGIs below $25k, 95.0% for AGIs $25k-50k, 96.6% for AGIs $50k-75k, 94.1% for AGIs $75k-100k, 93.8% for AGIs $100k-200k)
Averages for the 2012 tax year for zip code 29372, filed in 2013:
Average Adjusted Gross Income (AGI) in 2012: $36,401 (Individual Income Tax Returns)
Here:
$36,401
State:
$51,133
Salary/wage: $33,493 (reported on 87.0% of returns)
Here:
$33,493
State:
$42,173
(% of AGI for various income ranges: 75.8% for AGIs below $25k, 82.2% for AGIs $25k-50k, 81.6% for AGIs $50k-75k, 79.7% for AGIs $75k-100k, 79.0% for AGIs $100k-200k)
Taxable interest for individuals: $594 (reported on 17.5% of returns)
This zip code:
$594
South Carolina:
$1,468
(% of AGI for various income ranges: 0.5% for AGIs below $25k, 0.2% for AGIs $25k-50k, 0.1% for AGIs $50k-75k, 0.4% for AGIs $75k-100k, 0.3% for AGIs $100k-200k)
Ordinary dividends: $1,113 (reported on 8.5% of returns)
Here:
$1,113
State:
$6,511
(% of AGI for various income ranges: 0.3% for AGIs below $25k, 0.3% for AGIs $25k-50k, 0.1% for AGIs $50k-75k, 0.3% for AGIs $75k-100k, 0.3% for AGIs $100k-200k)
Net capital gain/loss in AGI: +$557 (reported on 4.0% of returns)
Here:
+$557
State:
+$13,061
(% of AGI for various income ranges: 0.4% for AGIs $100k-200k)
Profit/loss from business: +$5,959 (reported on 12.4% of returns)
Here:
+$5,959
State:
+$10,167
(% of AGI for various income ranges: 6.2% for AGIs below $25k, 2.3% for AGIs $25k-50k, 1.2% for AGIs $50k-75k, 0.4% for AGIs $75k-100k)
Taxable individual retirement arrangement distribution: $11,300 (reported on 8.5% of returns)
29372:
$11,300
South Carolina:
$17,019
(% of AGI for various income ranges: 3.0% for AGIs below $25k, 2.8% for AGIs $25k-50k, 2.5% for AGIs $50k-75k, 5.3% for AGIs $75k-100k)
Total itemized deductions: $16,776 (24% of AGI, reported on 19.2% of returns)
Here:
$16,776
State:
$22,890
Here:
23.9% of AGI
State:
21.4% of AGI
(% of AGI for various income ranges: 4.5% for AGIs below $25k, 7.0% for AGIs $25k-50k, 8.5% for AGIs $50k-75k, 13.0% for AGIs $75k-100k, 13.4% for AGIs $100k-200k)
Charity contributions: $5,289 (reported on 15.8% of returns)
Here:
$5,289
State:
$5,169
(% of AGI for various income ranges: 2.3% for AGIs $25k-50k, 1.9% for AGIs $50k-75k, 3.7% for AGIs $75k-100k, 4.0% for AGIs $100k-200k)
Taxes paid: $5,215 (reported on 18.6% of returns)
29372:
$5,215
State:
$7,644
(% of AGI for various income ranges: 0.4% for AGIs below $25k, 1.4% for AGIs $25k-50k, 2.4% for AGIs $50k-75k, 4.6% for AGIs $75k-100k, 5.7% for AGIs $100k-200k)
Earned income credit: $2,435 (reported on 29.4% of returns)
Here:
$2,435
State:
$2,418
(% of AGI for various income ranges: 9.6% for AGIs below $25k, 1.2% for AGIs $25k-50k)
Percentage of individuals using paid preparers for their 2012 taxes: 64.4%
Here:
64%
State:
57%
(% for various income ranges: 62.7% for AGIs below $25k, 60.8% for AGIs $25k-50k, 68.0% for AGIs $50k-75k, 70.0% for AGIs $75k-100k, 87.5% for AGIs $100k-200k)
Averages for the 2004 tax year for zip code 29372, filed in 2005:
Average Adjusted Gross Income (AGI) in 2004: $31,258 (Individual Income Tax Returns)
Here:
$31,258
State:
$41,965
Salary/wage: $30,309 (reported on 88.3% of returns)
Here:
$30,309
State:
$35,695
(% of AGI for various income ranges: 83.9% for AGIs below $10k, 79.9% for AGIs $10k-25k, 87.5% for AGIs $25k-50k, 87.2% for AGIs $50k-75k, 87.7% for AGIs $75k-100k, 81.4% for AGIs over 100k)
Taxable interest for individuals: $845 (reported on 24.0% of returns)
This zip code:
$845
South Carolina:
$1,623
(% of AGI for various income ranges: 1.6% for AGIs below $10k, 1.0% for AGIs $10k-25k, 0.5% for AGIs $25k-50k, 0.7% for AGIs $50k-75k, 0.3% for AGIs $75k-100k, 0.6% for AGIs over 100k)
Taxable dividends: $790 (reported on 9.8% of returns)
Here:
$790
State:
$3,999
(% of AGI for various income ranges: 0.2% for AGIs below $10k, 0.3% for AGIs $10k-25k, 0.3% for AGIs $25k-50k, 0.1% for AGIs $50k-75k, 0.2% for AGIs $75k-100k, 0.4% for AGIs over 100k)
Net capital gain/loss: +$1,359 (reported on 5.0% of returns)
Here:
+$1,359
State:
+$13,100
(% of AGI for various income ranges: 0.2% for AGIs $10k-25k, -0.0% for AGIs $25k-50k, -0.1% for AGIs $50k-75k, 0.2% for AGIs $75k-100k, 2.6% for AGIs over 100k)
Profit/loss from business: +$6,018 (reported on 11.7% of returns)
Here:
+$6,018
State:
+$9,144
(% of AGI for various income ranges: 8.3% for AGIs below $10k, 5.3% for AGIs $10k-25k, 1.7% for AGIs $25k-50k, 1.9% for AGIs $50k-75k, 0.3% for AGIs $75k-100k)
IRA payment deduction: $2,045 (reported on 1.2% of returns)
29372:
$2,045
South Carolina:
$2,972
Total itemized deductions: $14,979 (26% of AGI, reported on 22.7% of returns)
Here:
$14,979
State:
$19,039
Here:
25.8% of AGI
State:
22.8% of AGI
(% of AGI for various income ranges: 5.6% for AGIs below $10k, 4.6% for AGIs $10k-25k, 8.0% for AGIs $25k-50k, 14.8% for AGIs $50k-75k, 15.8% for AGIs $75k-100k, 16.9% for AGIs over 100k)
Charity contributions deductions: $3,866 (6% of AGI, reported on 19.0% of returns)
Here:
$3,866
State:
$4,305
Here:
6.4% of AGI
State:
5.0% of AGI
(% of AGI for various income ranges: 1.1% for AGIs $10k-25k, 1.7% for AGIs $25k-50k, 3.1% for AGIs $50k-75k, 3.1% for AGIs $75k-100k, 5.1% for AGIs over 100k)
Total tax: $3,262 (reported on 68.4% of returns)
29372:
$3,262
State:
$6,497
(% of AGI for various income ranges: 2.0% for AGIs below $10k, 3.5% for AGIs $10k-25k, 6.0% for AGIs $25k-50k, 8.1% for AGIs $50k-75k, 9.9% for AGIs $75k-100k, 14.8% for AGIs over 100k)
Earned income credit: $1,812 (reported on 25.3% of returns)
Here:
$1,812
State:
$1,882
Percentage of individuals using paid preparers for their 2004 taxes: 71.0%
Here:
71%
State:
66%
(% for various income ranges: 66.6% for AGIs below $10k, 75.4% for AGIs $10k-25k, 70.6% for AGIs $25k-50k, 68.5% for AGIs $50k-75k, 78.7% for AGIs $75k-100k, 58.6% for AGIs over 100k)
Likely homosexual households (counted as self-reported same-sex unmarried-partner households)
Lesbian couples: 0.3% of all households
Gay men: 0.0% of all households
Household received Food Stamps/SNAP in the past 12 months: 187 Household did not receive Food Stamps/SNAP in the past 12 months: 1,552
Women who had a birth in the past 12 months: 12 (12 now married, 0 unmarried) Women who did not have a birth in the past 12 months: 722 (326 now married, 396 unmarried)
Housing units in zip code 29372 with a mortgage: 559 (5 second mortgage) Median monthly owner costs for units with a mortgage: $1,065 Median monthly owner costs for units without a mortgage: $323
Residents with income below the poverty level in 2022:
This zip code:
12.0%
Whole state:
14.0%
Residents with income below 50% of the poverty level in 2022:
This zip code:
6.8%
Whole state:
7.3%
Median number of rooms in houses and condos:
Here:
5.9
State:
6.4
Median number of rooms in apartments:
Here:
5.0
State:
4.5
Notable locations in this zip code not listed on our city pages
Churches in zip code 29372 include: New Salem Church (A), Jerusalem Church (B), Knuckles Chapel (C), Asbury Church (D), Mulberry Church (E), Tate Memorial Baptist Church (F), Saint Johns Church (G). Display/hide their locations on the map
Streams, rivers, and creeks: Richland Creek (A), Plum Branch (B), Mill Creek (C), Mill Branch (D), Browns Branch (E), Eison Branch (F). Display/hide their locations on the map
In group quarters: 10 (-1 institutionalized population)
Size of family households: 550 2-persons, 186 3-persons, 146 4-persons, 94 5-persons, 76 6-persons, 9 7-or-more-persons
Size of nonfamily households: 639 1-person, 21 2-persons, 15 3-persons
454 married couples with children.
143 single-parent households (20 men, 123 women).
96.5% of residents of 29372 zip code speak English at home.
3.0% of residents speak Spanish at home (37% very well, 19% well, 44% not at all).
0.4% of residents speak other Indo-European language at home (100% very well).
0.1% of residents speak other language at home (100% very well).
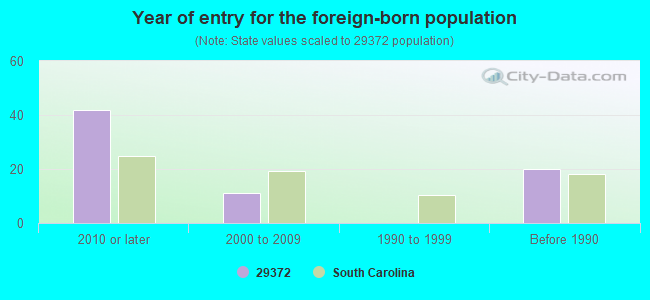
Foreign born population: 57 (1.5%) (60.8% of them are naturalized citizens)
This zip code:
1.5%
Whole state:
5.2%
57%Honduras
41%Barbados
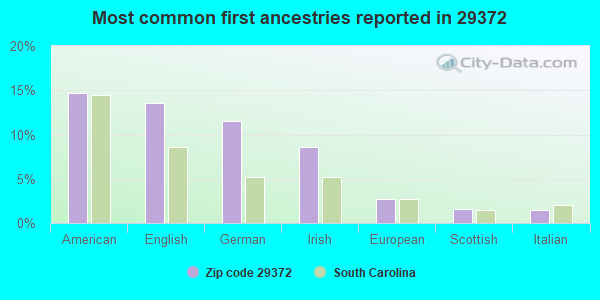
15%American
14%English
12%German
9%Irish
3%European
2%Scottish
2%Italian
Year of entry for the foreign-born population
422010 or later
112000 to 2009
01990 to 1999
20Before 1990
Facilities with environmental interests located in this zip code:
BARON BLAKESLEE (3819 CELANESE RD in ROCKHILL, SC)
AIR MINOR (AIRS/AFS) Business SIC classification: CHEMICALS AND ALLIED PRODUCTS
Housing units lacking complete plumbing facilities: 7.8% Housing units lacking complete kitchen facilities: 6.5%
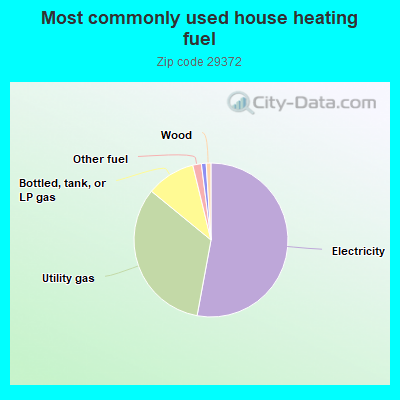
53.0%Electricity
33.1%Utility gas
10.3%Bottled, tank, or LP gas
1.8%Other fuel
1.0%Fuel oil, kerosene, etc.
1.0%Wood
Population in 1990: 4,129. Population change in the 1990s: +1,056 (+25.6%).
Place of birth for U.S.-born residents:
This state: 3,186
Northeast: 132
Midwest: 140
South: 217
West: 90
66% of the 29372 zip code residents lived in the same house 5 years ago. Out of people who lived in different houses, 69% lived in this county. Out of people who lived in different counties, 50% lived in South Carolina.
97% of the 29372 zip code residents lived in the same house 1 year ago. Out of people who lived in different houses, 58% moved from this county. Out of people who lived in different houses, 7% moved from different county within same state. Out of people who lived in different houses, 30% moved from different state.
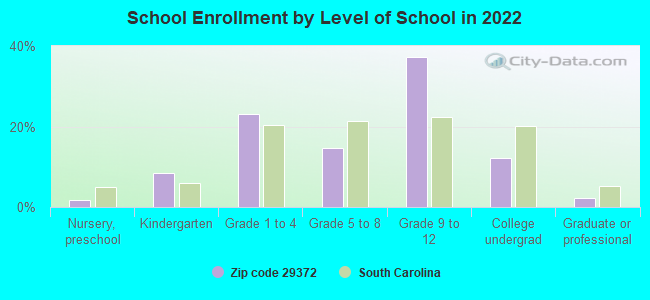
Private vs. public school enrollment:
Students in private schools in grades 1 to 8 (elementary and middle school): 33
Here:
10.4%
South Carolina:
14.4%
Students in private schools in grades 9 to 12 (high school):
Here:
0.0%
South Carolina:
11.1%
Students in private undergraduate colleges:
Here:
0.0%
South Carolina:
21.9%
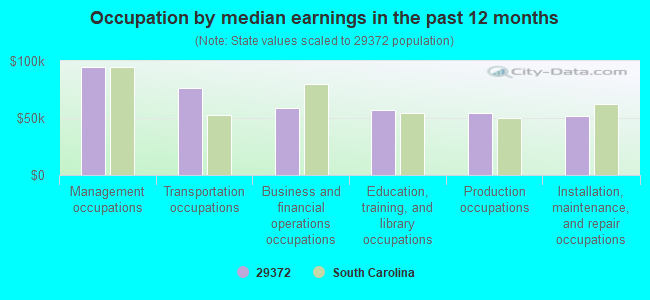
Occupation by median earnings in the past 12 months ($)
94,889Management occupations
76,080Transportation occupations
59,031Business and financial operations occupations
57,058Education, training, and library occupations
54,690Production occupations
51,938Installation, maintenance, and repair occupations
Top industries in this zip code by the number of employees in 2005:
Mining: Crushed and Broken Granite Mining and Quarrying (20-49 employees: 1 establishment)
Accommodation and Food Services: Limited-Service Restaurants (10-19: 1, 5-9: 1)
Other Services (except Public Administration): Religious Organizations (5-9: 2, 1-4: 4)
Finance and Insurance: Savings Institutions (10-19: 1)
Other Services (except Public Administration): Commercial and Industrial Machinery and Equipment (except Automotive and Electronic) Repair and Maintenance (10-19: 1)
People in group quarters in 2010:
8 people in other noninstitutional facilities
People in group quarters in 2000:
116 people in other noninstitutional group quarters
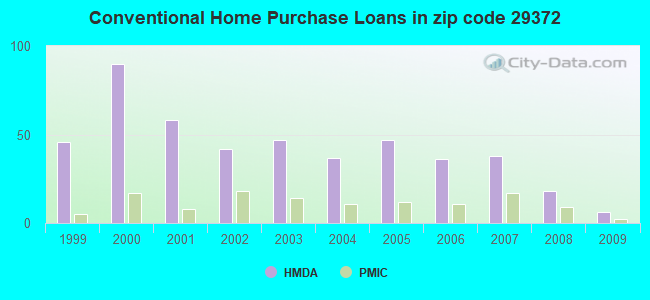
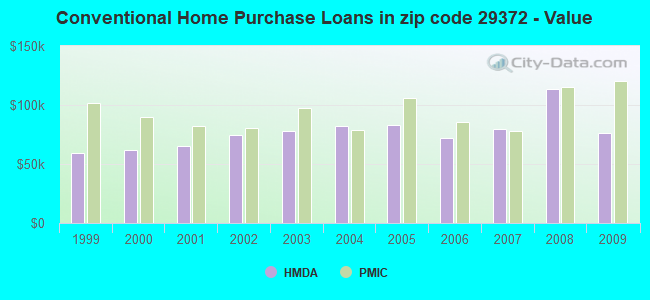
Home Mortgage Disclosure Act Aggregated Statistics For Year 2009 (Based on 2 partial tracts)
A) FHA, FSA/RHS & VA Home Purchase Loans
B) Conventional Home Purchase Loans
C) Refinancings
D) Home Improvement Loans
F) Non-occupant Loans on < 5 Family Dwellings (A B C & D)
G) Loans On Manufactured Home Dwelling (A B C & D)
Number
Average Value
Number
Average Value
Number
Average Value
Number
Average Value
Number
Average Value
Number
Average Value
LOANS ORIGINATED
13
$107,927
6
$76,477
40
$113,672
3
$45,457
3
$179,157
4
$53,748
APPLICATIONS APPROVED, NOT ACCEPTED
0
$0
1
$14,440
2
$147,205
0
$0
0
$0
1
$64,180
APPLICATIONS DENIED
3
$103,217
6
$51,475
18
$98,225
3
$17,113
1
$16,040
2
$68,990
APPLICATIONS WITHDRAWN
1
$48,130
0
$0
13
$123,415
0
$0
0
$0
0
$0
FILES CLOSED FOR INCOMPLETENESS
1
$75,410
0
$0
3
$90,917
0
$0
0
$0
0
$0
Aggregated Statistics For Year 2008 (Based on 2 partial tracts)
A) FHA, FSA/RHS & VA Home Purchase Loans
B) Conventional Home Purchase Loans
C) Refinancings
D) Home Improvement Loans
F) Non-occupant Loans on < 5 Family Dwellings (A B C & D)
G) Loans On Manufactured Home Dwelling (A B C & D)
Number
Average Value
Number
Average Value
Number
Average Value
Number
Average Value
Number
Average Value
Number
Average Value
LOANS ORIGINATED
10
$93,135
18
$113,199
34
$99,496
3
$21,927
5
$111,184
4
$72,800
APPLICATIONS APPROVED, NOT ACCEPTED
0
$0
3
$68,723
5
$62,572
4
$21,058
1
$33,690
1
$12,030
APPLICATIONS DENIED
2
$79,015
7
$95,576
31
$78,098
3
$8,290
3
$74,873
6
$63,373
APPLICATIONS WITHDRAWN
2
$44,120
2
$63,375
6
$106,693
0
$0
1
$17,650
1
$12,840
FILES CLOSED FOR INCOMPLETENESS
0
$0
0
$0
2
$19,255
0
$0
0
$0
0
$0
Aggregated Statistics For Year 2007 (Based on 2 partial tracts)
A) FHA, FSA/RHS & VA Home Purchase Loans
B) Conventional Home Purchase Loans
C) Refinancings
D) Home Improvement Loans
F) Non-occupant Loans on < 5 Family Dwellings (A B C & D)
G) Loans On Manufactured Home Dwelling (A B C & D)
Number
Average Value
Number
Average Value
Number
Average Value
Number
Average Value
Number
Average Value
Number
Average Value
LOANS ORIGINATED
2
$96,665
38
$79,291
46
$73,628
12
$38,907
7
$51,456
6
$50,940
APPLICATIONS APPROVED, NOT ACCEPTED
0
$0
4
$98,070
10
$69,471
0
$0
2
$30,885
2
$21,660
APPLICATIONS DENIED
0
$0
10
$77,252
43
$88,671
15
$22,408
2
$12,435
9
$42,517
APPLICATIONS WITHDRAWN
1
$79,420
6
$75,140
11
$93,930
1
$14,440
1
$22,460
1
$61,770
FILES CLOSED FOR INCOMPLETENESS
0
$0
0
$0
2
$100,675
1
$82,630
0
$0
0
$0
Aggregated Statistics For Year 2006 (Based on 2 partial tracts)
A) FHA, FSA/RHS & VA Home Purchase Loans
B) Conventional Home Purchase Loans
C) Refinancings
D) Home Improvement Loans
F) Non-occupant Loans on < 5 Family Dwellings (A B C & D)
G) Loans On Manufactured Home Dwelling (A B C & D)
Number
Average Value
Number
Average Value
Number
Average Value
Number
Average Value
Number
Average Value
Number
Average Value
LOANS ORIGINATED
6
$131,962
36
$72,020
41
$81,961
10
$21,419
7
$63,603
6
$43,987
APPLICATIONS APPROVED, NOT ACCEPTED
1
$120,330
4
$49,335
10
$64,497
6
$27,810
0
$0
5
$39,148
APPLICATIONS DENIED
2
$53,345
13
$67,200
58
$68,464
14
$34,839
5
$50,218
18
$52,009
APPLICATIONS WITHDRAWN
0
$0
9
$76,298
16
$103,384
0
$0
4
$73,402
2
$70,595
FILES CLOSED FOR INCOMPLETENESS
0
$0
2
$54,150
6
$95,595
0
$0
0
$0
0
$0
Aggregated Statistics For Year 2005 (Based on 2 partial tracts)
A) FHA, FSA/RHS & VA Home Purchase Loans
B) Conventional Home Purchase Loans
C) Refinancings
D) Home Improvement Loans
E) Loans on Dwellings For 5+ Families
F) Non-occupant Loans on < 5 Family Dwellings (A B C & D)
G) Loans On Manufactured Home Dwelling (A B C & D)
Number
Average Value
Number
Average Value
Number
Average Value
Number
Average Value
Number
Average Value
Number
Average Value
Number
Average Value
LOANS ORIGINATED
2
$117,520
47
$83,104
55
$75,159
6
$43,052
0
$0
15
$67,438
7
$46,643
APPLICATIONS APPROVED, NOT ACCEPTED
0
$0
8
$47,029
12
$106,091
4
$19,052
0
$0
2
$57,355
2
$54,150
APPLICATIONS DENIED
0
$0
18
$74,827
57
$86,609
11
$27,056
0
$0
4
$39,910
14
$60,566
APPLICATIONS WITHDRAWN
0
$0
4
$62,572
24
$87,473
2
$224,215
1
$59,360
2
$62,170
2
$34,095
FILES CLOSED FOR INCOMPLETENESS
0
$0
5
$99,794
14
$112,079
2
$115,515
0
$0
0
$0
1
$53,750
Aggregated Statistics For Year 2004 (Based on 2 partial tracts)
A) FHA, FSA/RHS & VA Home Purchase Loans
B) Conventional Home Purchase Loans
C) Refinancings
D) Home Improvement Loans
F) Non-occupant Loans on < 5 Family Dwellings (A B C & D)
G) Loans On Manufactured Home Dwelling (A B C & D)
Number
Average Value
Number
Average Value
Number
Average Value
Number
Average Value
Number
Average Value
Number
Average Value
LOANS ORIGINATED
5
$70,754
37
$82,562
56
$79,432
8
$35,296
13
$66,706
6
$53,882
APPLICATIONS APPROVED, NOT ACCEPTED
0
$0
8
$68,388
7
$72,656
6
$17,382
1
$18,450
5
$47,650
APPLICATIONS DENIED
0
$0
18
$87,395
49
$86,900
16
$31,386
1
$16,040
6
$54,148
APPLICATIONS WITHDRAWN
0
$0
8
$83,830
22
$72,417
4
$29,682
1
$26,470
3
$83,430
FILES CLOSED FOR INCOMPLETENESS
0
$0
1
$15,240
10
$90,488
1
$28,080
0
$0
1
$72,200
Aggregated Statistics For Year 2003 (Based on 4 partial tracts)
A) FHA, FSA/RHS & VA Home Purchase Loans
B) Conventional Home Purchase Loans
C) Refinancings
D) Home Improvement Loans
F) Non-occupant Loans on < 5 Family Dwellings (A B C & D)
Number
Average Value
Number
Average Value
Number
Average Value
Number
Average Value
Number
Average Value
LOANS ORIGINATED
2
$72,235
47
$78,075
142
$89,629
7
$21,774
10
$80,862
APPLICATIONS APPROVED, NOT ACCEPTED
1
$51,860
11
$55,135
21
$70,828
0
$0
1
$35,300
APPLICATIONS DENIED
1
$105,640
26
$54,489
62
$76,619
11
$16,125
1
$109,800
APPLICATIONS WITHDRAWN
1
$32,090
7
$77,441
33
$81,199
1
$31,680
1
$18,450
FILES CLOSED FOR INCOMPLETENESS
0
$0
1
$24,870
4
$82,215
1
$10,580
0
$0
Aggregated Statistics For Year 2002 (Based on 4 partial tracts)
A) FHA, FSA/RHS & VA Home Purchase Loans
B) Conventional Home Purchase Loans
C) Refinancings
D) Home Improvement Loans
F) Non-occupant Loans on < 5 Family Dwellings (A B C & D)
Number
Average Value
Number
Average Value
Number
Average Value
Number
Average Value
Number
Average Value
LOANS ORIGINATED
1
$116,580
42
$74,901
109
$78,898
8
$15,650
11
$47,603
APPLICATIONS APPROVED, NOT ACCEPTED
0
$0
5
$64,832
24
$60,945
1
$27,270
3
$53,313
APPLICATIONS DENIED
3
$71,763
28
$44,907
70
$66,665
5
$9,784
3
$45,587
APPLICATIONS WITHDRAWN
0
$0
5
$93,708
28
$70,151
1
$59,760
1
$105,890
FILES CLOSED FOR INCOMPLETENESS
1
$60,160
2
$59,365
11
$71,656
0
$0
0
$0
Aggregated Statistics For Year 2001 (Based on 4 partial tracts)
A) FHA, FSA/RHS & VA Home Purchase Loans
B) Conventional Home Purchase Loans
C) Refinancings
D) Home Improvement Loans
F) Non-occupant Loans on < 5 Family Dwellings (A B C & D)
Number
Average Value
Number
Average Value
Number
Average Value
Number
Average Value
Number
Average Value
LOANS ORIGINATED
7
$86,650
58
$65,200
95
$76,443
12
$17,581
13
$40,562
APPLICATIONS APPROVED, NOT ACCEPTED
1
$31,290
10
$48,647
20
$50,433
2
$9,225
2
$19,845
APPLICATIONS DENIED
0
$0
47
$50,808
71
$65,312
13
$18,075
7
$44,906
APPLICATIONS WITHDRAWN
2
$102,260
4
$55,610
32
$61,770
5
$20,708
2
$47,730
FILES CLOSED FOR INCOMPLETENESS
0
$0
0
$0
3
$81,757
1
$24,870
0
$0
Aggregated Statistics For Year 2000 (Based on 4 partial tracts)
A) FHA, FSA/RHS & VA Home Purchase Loans
B) Conventional Home Purchase Loans
C) Refinancings
D) Home Improvement Loans
F) Non-occupant Loans on < 5 Family Dwellings (A B C & D)
Number
Average Value
Number
Average Value
Number
Average Value
Number
Average Value
Number
Average Value
LOANS ORIGINATED
10
$72,498
90
$61,838
63
$49,712
15
$15,388
11
$36,102
APPLICATIONS APPROVED, NOT ACCEPTED
5
$43,468
18
$42,462
20
$63,278
2
$30,485
1
$39,690
APPLICATIONS DENIED
6
$42,200
92
$45,942
91
$50,331
13
$13,008
5
$28,946
APPLICATIONS WITHDRAWN
3
$59,497
9
$49,576
29
$61,979
5
$18,980
1
$24,070
FILES CLOSED FOR INCOMPLETENESS
0
$0
1
$12,030
7
$79,466
0
$0
0
$0
Aggregated Statistics For Year 1999 (Based on 2 partial tracts)
A) FHA, FSA/RHS & VA Home Purchase Loans
B) Conventional Home Purchase Loans
C) Refinancings
D) Home Improvement Loans
F) Non-occupant Loans on < 5 Family Dwellings (A B C & D)
Detailed PMIC statistics for the following Tracts:0239.00
, 9707.00
2002 - 2018 National Fire Incident Reporting System (NFIRS) incidents
According to the data from the years 2002 - 2018 the average number of fire incidents per year is 11. The highest number of fires - 39 took place in 2016, and the least - 0 in 2003. The data has an increasing trend.
When looking into fire subcategories, the most reports belonged to: Structure Fires (54.7%), and Outside Fires (30.4%).
Fire incident types reported to NFIRS in Zip Code 29372

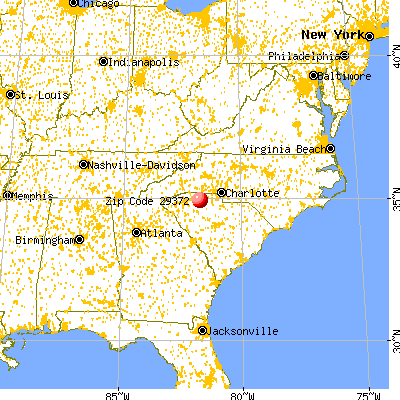


 Nearest zip codes: 29373, 29353, 29346, 29302, 29324, 29340.


 According to the data from the years 2002 - 2018 the average number of fire incidents per year is 11. The highest number of fires - 39 took place in 2016, and the least - 0 in 2003. The data has an increasing trend.
 When looking into fire subcategories, the most reports belonged to: Structure Fires (54.7%), and Outside Fires (30.4%).