Estimated median house/condo value in 2022: $112,227
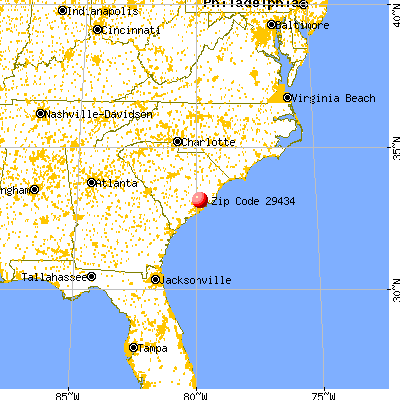
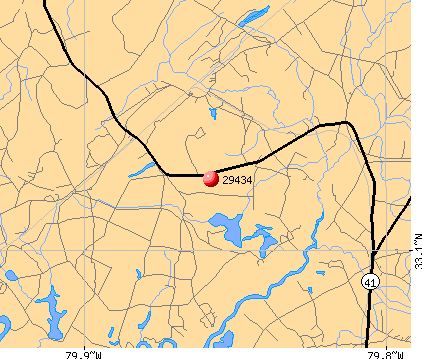
29434:
$112,227
South Carolina:
$254,600
According to our research of South Carolina and other state lists, there were 5 registered sex offenders living in 29434 zip code as of May 28, 2024. The ratio of all residents to sex offenders in zip code 29434 is 122 to 1.
Median resident age:
This zip code:
48.0 years
South Carolina median age:
40.5 years
Average household size:
This zip code:
2.0 people
South Carolina:
2.4 people
Averages for the 2020 tax year for zip code 29434, filed in 2021:
Average Adjusted Gross Income (AGI) in 2020: $48,169 (Individual Income Tax Returns)
Here:
$48,169
State:
$65,754
Salary/wage: $48,719 (reported on 80.8% of returns)
Here:
$48,719
State:
$52,566
(% of AGI for various income ranges: 1287.5% for AGIs below $25k, 4572.5% for AGIs $25k-50k, 6543.3% for AGIs $50k-75k, 8206.7% for AGIs $75k-100k)
Taxable interest for individuals: $225 (reported on 15.4% of returns)
This zip code:
$225
South Carolina:
$1,749
(% of AGI for various income ranges: 30.0% for AGIs $50k-75k)
Earned income credit: $2,525 (reported on 15.4% of returns)
Here:
$2,525
State:
$2,397
(% of AGI for various income ranges: 126.2% for AGIs below $25k)
Percentage of individuals using paid preparers for their 2020 taxes: 88.5%
Here:
88%
State:
93%
(% for various income ranges: 90.0% for AGIs below $25k, 83.3% for AGIs $25k-50k, 100.0% for AGIs $50k-75k, 100.0% for AGIs $75k-100k, 66.7% for AGIs $100k-200k)
Averages for the 2012 tax year for zip code 29434, filed in 2013:
Average Adjusted Gross Income (AGI) in 2012: $33,826 (Individual Income Tax Returns)
Here:
$33,826
State:
$51,133
Salary/wage: $34,489 (reported on 82.6% of returns)
Here:
$34,489
State:
$42,173
(% of AGI for various income ranges: 73.7% for AGIs below $25k, 87.7% for AGIs $25k-50k, 86.1% for AGIs $50k-75k)
Taxable interest for individuals: $167 (reported on 13.0% of returns)
This zip code:
$167
South Carolina:
$1,468
Profit/loss from business: +$3,500 (reported on 13.0% of returns)
Here:
+$3,500
State:
+$10,167
Total itemized deductions: $16,975 (29% of AGI, reported on 17.4% of returns)
Here:
$16,975
State:
$22,890
Here:
28.6% of AGI
State:
21.4% of AGI
Charity contributions: $3,475 (reported on 17.4% of returns)
Here:
$3,475
State:
$5,169
Taxes paid: $4,250 (reported on 17.4% of returns)
29434:
$4,250
State:
$7,644
Earned income credit: $2,514 (reported on 30.4% of returns)
Here:
$2,514
State:
$2,418
(% of AGI for various income ranges: 11.9% for AGIs below $25k)
Percentage of individuals using paid preparers for their 2012 taxes: 69.6%
Here:
70%
State:
57%
(% for various income ranges: 72.7% for AGIs below $25k, 57.1% for AGIs $25k-50k, 80.0% for AGIs $50k-75k)
Averages for the 2004 tax year for zip code 29434, filed in 2005:
Average Adjusted Gross Income (AGI) in 2004: $26,491 (Individual Income Tax Returns)
Here:
$26,491
State:
$41,965
Salary/wage: $26,016 (reported on 83.5% of returns)
Here:
$26,016
State:
$35,695
(% of AGI for various income ranges: 90.0% for AGIs below $10k, 65.6% for AGIs $10k-25k, 87.2% for AGIs $25k-50k, 85.7% for AGIs $50k-75k)
Taxable interest for individuals: $364 (reported on 14.3% of returns)
This zip code:
$364
South Carolina:
$1,623
Profit/loss from business: +$3,903 (reported on 13.5% of returns)
Here:
+$3,903
State:
+$9,144
Total itemized deductions: $14,651 (32% of AGI, reported on 18.7% of returns)
Here:
$14,651
State:
$19,039
Here:
31.6% of AGI
State:
22.8% of AGI
Charity contributions deductions: $2,622 (6% of AGI, reported on 16.1% of returns)
Here:
$2,622
State:
$4,305
Here:
5.7% of AGI
State:
5.0% of AGI
Total tax: $2,333 (reported on 65.2% of returns)
29434:
$2,333
State:
$6,497
(% of AGI for various income ranges: 1.9% for AGIs below $10k, 3.7% for AGIs $10k-25k, 5.3% for AGIs $25k-50k, 8.0% for AGIs $50k-75k)
Earned income credit: $1,662 (reported on 30.9% of returns)
Here:
$1,662
State:
$1,882
Percentage of individuals using paid preparers for their 2004 taxes: 74.3%
Here:
74%
State:
66%
(% for various income ranges: 58.5% for AGIs below $10k, 80.0% for AGIs $10k-25k, 76.6% for AGIs $25k-50k, 81.8% for AGIs $50k-75k)
Household received Food Stamps/SNAP in the past 12 months: 108 Household did not receive Food Stamps/SNAP in the past 12 months: 195
Women who did not have a birth in the past 12 months: 160 (75 now married, 85 unmarried)
Housing units in zip code 29434 with a mortgage: 41 Median monthly owner costs for units with a mortgage: $1,563 Median monthly owner costs for units without a mortgage: $286
Residents with income below the poverty level in 2022:
This zip code:
22.1%
Whole state:
14.0%
Residents with income below 50% of the poverty level in 2022:
This zip code:
22.1%
Whole state:
7.3%
Median number of rooms in houses and condos:
Here:
3.9
State:
6.4
Notable locations in this zip code not listed on our city pages
Notable locations in zip code 29434: Richmond Plantation (A), Rice Hope Plantation (B), Limerick plantation (C), Huger Recreation Area (D), Santee Experimental Station (E), Witherbie Ranger Station (F), Herberta Siding (G), Bossis Plantation (H), Bonneau Ferry (I), Nonneau Ferry Plantation (J), Cordesville Rural Fire Department Station 2 (K), United States Forest Service Witherbee (L), Macedonia Rural Fire Department Station 2 (M). Display/hide their locations on the map
Churches in zip code 29434 include: Saint James Church (A), Bethel Baptist Church (B), Berea Church (C), Irwin Chapel (D). Display/hide their locations on the map
Cemeteries: Berea Cemetery (1), Bethel Cemetery (2), Bonneau Ferry Plantation Cemetery (3), Hyde Park Plantation Cemetery (4), Richmond Plantation Cemetery (5). Display/hide their locations on the map
Lakes, reservoirs, and swamps: Coingtee Lake (A), Raccoon Pond (B), Midway Reserve (C), Lower Reserve (D), Little Hellhole Reserve (E), Upper Reserve (F), Upper Reserve Pond (G), Rice Hope Lake (H). Display/hide their locations on the map
Streams, rivers, and creeks: Quimby Creek (A), Turkey Creek (B), Quarterman Branch (C), Nicholson Creek (D), Negro Field Branch (E), Mayrant Lead (F), Jericho Branch (G), Huger Creek (H), Gough Creek (I). Display/hide their locations on the map
Size of family households: 70 2-persons, 12 3-persons, 9 4-persons, 23 7-or-more-persons
Size of nonfamily households: 173 1-person, 15 2-persons
109 married couples with children.
0 single-parent households ().
100.3% of residents of 29434 zip code speak English at home.
Foreign born population: 0 (0.0%)
:
0.0%
Whole state:
5.2%
9%American
3%European
Housing units lacking complete plumbing facilities: 11.6% Housing units lacking complete kitchen facilities: 8.5%
Population in 1990: 1,382.
Place of birth for U.S.-born residents:
This state: 481
Northeast: 51
Midwest: 28
South: 43
57% of the 29434 zip code residents lived in the same house 5 years ago. Out of people who lived in different houses, 55% lived in this county. Out of people who lived in different counties, 50% lived in South Carolina.
81% of the 29434 zip code residents lived in the same house 1 year ago. Out of people who lived in different houses, 85% moved from this county.
Private vs. public school enrollment:
Students in private schools in grades 1 to 8 (elementary and middle school):
Here:
0.0%
South Carolina:
14.4%
Students in private schools in grades 9 to 12 (high school):
Here:
0.0%
South Carolina:
11.1%
Students in private undergraduate colleges:
Here:
0.0%
South Carolina:
21.9%
Top industries in this zip code by the number of employees in 2005:
Other Services (except Public Administration): Civic and Social Organizations (5-9 employees: 1 establishment)
Construction: Site Preparation Contractors (1-4: 2)
Fatal accident statistics in 2014:
Fatal accident count: 1
Vehicles involved in fatal accidents: 1
Fatal accidents caused by drunken drivers: 0
Fatalities: 1
Persons involved in fatal accidents: 1
Pedestrians involved in fatal accidents: 0
Fatal accident statistics in 2010:
Fatal accident count: 1
Vehicles involved in fatal accidents: 2
Fatal accidents caused by drunken drivers: 0
Fatalities: 1
Persons involved in fatal accidents: 3
Pedestrians involved in fatal accidents: 0
Home Mortgage Disclosure Act Aggregated Statistics For Year 2009 (Based on 2 partial tracts)
A) FHA, FSA/RHS & VA Home Purchase Loans
B) Conventional Home Purchase Loans
C) Refinancings
D) Home Improvement Loans
F) Non-occupant Loans on < 5 Family Dwellings (A B C & D)
G) Loans On Manufactured Home Dwelling (A B C & D)
Number
Average Value
Number
Average Value
Number
Average Value
Number
Average Value
Number
Average Value
Number
Average Value
LOANS ORIGINATED
0
$0
4
$102,190
13
$141,782
4
$23,588
3
$67,133
5
$42,250
APPLICATIONS APPROVED, NOT ACCEPTED
0
$0
0
$0
2
$108,995
0
$0
0
$0
0
$0
APPLICATIONS DENIED
1
$57,800
2
$69,335
10
$190,253
1
$33,440
1
$44,840
3
$55,813
APPLICATIONS WITHDRAWN
0
$0
0
$0
5
$124,624
0
$0
0
$0
1
$137,640
FILES CLOSED FOR INCOMPLETENESS
0
$0
0
$0
1
$278,380
0
$0
0
$0
0
$0
Aggregated Statistics For Year 2008 (Based on 2 partial tracts)
A) FHA, FSA/RHS & VA Home Purchase Loans
B) Conventional Home Purchase Loans
C) Refinancings
D) Home Improvement Loans
F) Non-occupant Loans on < 5 Family Dwellings (A B C & D)
G) Loans On Manufactured Home Dwelling (A B C & D)
Number
Average Value
Number
Average Value
Number
Average Value
Number
Average Value
Number
Average Value
Number
Average Value
LOANS ORIGINATED
1
$57,800
6
$134,827
12
$129,103
3
$11,750
2
$54,300
5
$58,164
APPLICATIONS APPROVED, NOT ACCEPTED
1
$58,580
2
$89,035
2
$84,630
0
$0
0
$0
3
$79,230
APPLICATIONS DENIED
0
$0
4
$64,410
10
$142,353
2
$31,235
1
$177,550
5
$53,914
APPLICATIONS WITHDRAWN
0
$0
1
$132,190
3
$163,900
0
$0
1
$31,880
1
$50,280
FILES CLOSED FOR INCOMPLETENESS
0
$0
0
$0
3
$141,350
0
$0
0
$0
0
$0
Aggregated Statistics For Year 2007 (Based on 2 partial tracts)
A) FHA, FSA/RHS & VA Home Purchase Loans
B) Conventional Home Purchase Loans
C) Refinancings
D) Home Improvement Loans
F) Non-occupant Loans on < 5 Family Dwellings (A B C & D)
G) Loans On Manufactured Home Dwelling (A B C & D)
Number
Average Value
Number
Average Value
Number
Average Value
Number
Average Value
Number
Average Value
Number
Average Value
LOANS ORIGINATED
1
$172,630
9
$122,487
11
$150,525
5
$32,712
2
$67,520
6
$61,172
APPLICATIONS APPROVED, NOT ACCEPTED
0
$0
1
$79,570
3
$133,833
1
$38,880
0
$0
2
$86,830
APPLICATIONS DENIED
0
$0
7
$194,067
15
$183,393
4
$59,292
1
$118,970
6
$61,905
APPLICATIONS WITHDRAWN
0
$0
2
$85,925
5
$133,384
1
$87,090
0
$0
1
$46,920
FILES CLOSED FOR INCOMPLETENESS
0
$0
0
$0
2
$173,925
0
$0
0
$0
0
$0
Aggregated Statistics For Year 2006 (Based on 2 partial tracts)
B) Conventional Home Purchase Loans
C) Refinancings
D) Home Improvement Loans
F) Non-occupant Loans on < 5 Family Dwellings (A B C & D)
G) Loans On Manufactured Home Dwelling (A B C & D)
Number
Average Value
Number
Average Value
Number
Average Value
Number
Average Value
Number
Average Value
LOANS ORIGINATED
11
$143,785
16
$98,496
6
$44,540
4
$88,648
7
$60,320
APPLICATIONS APPROVED, NOT ACCEPTED
4
$72,510
3
$102,210
0
$0
1
$32,140
3
$62,640
APPLICATIONS DENIED
4
$86,185
16
$86,298
4
$28,188
1
$77,760
7
$60,839
APPLICATIONS WITHDRAWN
1
$69,470
7
$139,820
1
$83,720
0
$0
1
$89,940
FILES CLOSED FOR INCOMPLETENESS
0
$0
2
$109,770
0
$0
0
$0
0
$0
Aggregated Statistics For Year 2005 (Based on 2 partial tracts)
A) FHA, FSA/RHS & VA Home Purchase Loans
B) Conventional Home Purchase Loans
C) Refinancings
D) Home Improvement Loans
F) Non-occupant Loans on < 5 Family Dwellings (A B C & D)
G) Loans On Manufactured Home Dwelling (A B C & D)
Number
Average Value
Number
Average Value
Number
Average Value
Number
Average Value
Number
Average Value
Number
Average Value
LOANS ORIGINATED
1
$47,430
6
$64,713
15
$100,915
4
$39,852
4
$44,970
8
$43,772
APPLICATIONS APPROVED, NOT ACCEPTED
1
$97,200
2
$66,355
5
$101,088
0
$0
0
$0
4
$70,050
APPLICATIONS DENIED
1
$33,180
8
$54,821
12
$131,911
5
$62,570
1
$27,730
9
$67,334
APPLICATIONS WITHDRAWN
0
$0
1
$45,360
6
$158,803
0
$0
1
$136,080
1
$44,840
FILES CLOSED FOR INCOMPLETENESS
0
$0
0
$0
4
$139,125
0
$0
0
$0
0
$0
Aggregated Statistics For Year 2004 (Based on 2 partial tracts)
A) FHA, FSA/RHS & VA Home Purchase Loans
B) Conventional Home Purchase Loans
C) Refinancings
D) Home Improvement Loans
F) Non-occupant Loans on < 5 Family Dwellings (A B C & D)
G) Loans On Manufactured Home Dwelling (A B C & D)
Number
Average Value
Number
Average Value
Number
Average Value
Number
Average Value
Number
Average Value
Number
Average Value
LOANS ORIGINATED
1
$125,190
8
$83,462
14
$89,720
4
$58,190
3
$85,880
7
$47,360
APPLICATIONS APPROVED, NOT ACCEPTED
1
$59,880
2
$91,240
4
$117,870
0
$0
0
$0
2
$87,090
APPLICATIONS DENIED
0
$0
9
$47,030
14
$105,216
3
$48,817
1
$27,730
10
$52,073
APPLICATIONS WITHDRAWN
0
$0
1
$149,820
8
$127,072
1
$29,810
0
$0
1
$59,100
FILES CLOSED FOR INCOMPLETENESS
0
$0
0
$0
4
$85,212
0
$0
0
$0
1
$53,400
Aggregated Statistics For Year 2003 (Based on 2 partial tracts)
B) Conventional Home Purchase Loans
C) Refinancings
D) Home Improvement Loans
F) Non-occupant Loans on < 5 Family Dwellings (A B C & D)
Number
Average Value
Number
Average Value
Number
Average Value
Number
Average Value
LOANS ORIGINATED
6
$61,517
21
$92,201
4
$18,402
1
$37,580
APPLICATIONS APPROVED, NOT ACCEPTED
4
$52,165
5
$110,886
0
$0
1
$43,550
APPLICATIONS DENIED
9
$66,730
15
$83,929
2
$7,905
1
$65,840
APPLICATIONS WITHDRAWN
2
$80,220
7
$77,686
0
$0
0
$0
FILES CLOSED FOR INCOMPLETENESS
1
$82,940
2
$82,555
0
$0
0
$0
Aggregated Statistics For Year 2002 (Based on 2 partial tracts)
A) FHA, FSA/RHS & VA Home Purchase Loans
B) Conventional Home Purchase Loans
C) Refinancings
D) Home Improvement Loans
F) Non-occupant Loans on < 5 Family Dwellings (A B C & D)
Number
Average Value
Number
Average Value
Number
Average Value
Number
Average Value
Number
Average Value
LOANS ORIGINATED
1
$104,720
5
$75,686
15
$85,864
3
$7,777
2
$40,565
APPLICATIONS APPROVED, NOT ACCEPTED
0
$0
4
$42,898
4
$83,592
0
$0
1
$35,510
APPLICATIONS DENIED
0
$0
8
$54,011
13
$91,936
1
$6,480
1
$25,920
APPLICATIONS WITHDRAWN
0
$0
1
$40,180
6
$93,312
0
$0
0
$0
FILES CLOSED FOR INCOMPLETENESS
0
$0
0
$0
2
$86,575
0
$0
0
$0
Aggregated Statistics For Year 2001 (Based on 2 partial tracts)
A) FHA, FSA/RHS & VA Home Purchase Loans
B) Conventional Home Purchase Loans
C) Refinancings
D) Home Improvement Loans
F) Non-occupant Loans on < 5 Family Dwellings (A B C & D)
Number
Average Value
Number
Average Value
Number
Average Value
Number
Average Value
Number
Average Value
LOANS ORIGINATED
0
$0
12
$70,502
21
$86,659
5
$13,686
1
$67,910
APPLICATIONS APPROVED, NOT ACCEPTED
0
$0
5
$60,498
5
$83,670
0
$0
0
$0
APPLICATIONS DENIED
0
$0
10
$49,844
18
$67,118
2
$3,630
1
$72,580
APPLICATIONS WITHDRAWN
1
$46,400
2
$72,445
9
$83,261
1
$10,110
0
$0
FILES CLOSED FOR INCOMPLETENESS
0
$0
0
$0
1
$38,360
0
$0
0
$0
Aggregated Statistics For Year 2000 (Based on 2 partial tracts)
A) FHA, FSA/RHS & VA Home Purchase Loans
B) Conventional Home Purchase Loans
C) Refinancings
D) Home Improvement Loans
F) Non-occupant Loans on < 5 Family Dwellings (A B C & D)
Number
Average Value
Number
Average Value
Number
Average Value
Number
Average Value
Number
Average Value
LOANS ORIGINATED
1
$29,550
12
$49,032
13
$72,177
5
$8,864
1
$19,180
APPLICATIONS APPROVED, NOT ACCEPTED
0
$0
5
$45,308
6
$64,108
0
$0
1
$27,730
APPLICATIONS DENIED
1
$18,920
13
$48,829
16
$57,996
4
$16,590
1
$23,590
APPLICATIONS WITHDRAWN
1
$38,880
1
$40,690
5
$59,408
0
$0
0
$0
FILES CLOSED FOR INCOMPLETENESS
0
$0
0
$0
1
$88,650
0
$0
0
$0
Aggregated Statistics For Year 1999 (Based on 1 partial tract)
A) FHA, FSA/RHS & VA Home Purchase Loans
B) Conventional Home Purchase Loans
C) Refinancings
D) Home Improvement Loans
F) Non-occupant Loans on < 5 Family Dwellings (A B C & D)


 Nearest zip codes: 29450, 29431, 29461, 29445, 29453, 29469.


