Estimated zip code population in 2022: 4,583 Zip code population in 2010: 4,122 Zip code population in 2000: 3,675
Houses and condos: 2,140 Renter-occupied apartments: 164
% of renters here:
9%
State:
28%
March 2022 cost of living index in zip code 29435: 81.1 (low, U.S. average is 100)
Land area: 68.7 sq. mi. Water area: 0.0 sq. mi.
Population density: 67 people per square mile
(very low).
OSM Map
General Map
Google Map
MSN Map
OSM Map
General Map
Google Map
MSN Map
OSM Map
General Map
Google Map
MSN Map
OSM Map
General Map
Google Map
MSN Map
Please wait while loading the map...
Real estate property taxes paid for housing units in 2022:
This zip code:
0.4% ($714)
South Carolina:
0.5% ($1,185)
Median real estate property taxes paid for housing units with mortgages in 2022: $879 (0.4%) Median real estate property taxes paid for housing units with no mortgage in 2022: $471 (0.5%)
Business Search- 14 Million verified businesses
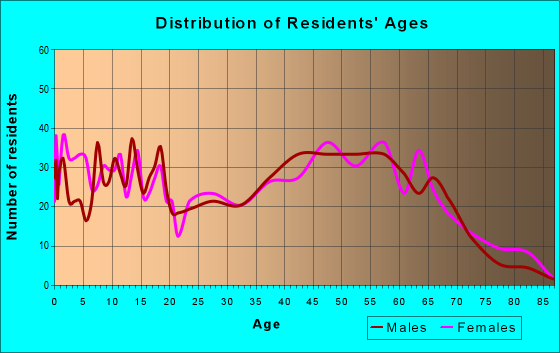
Males: 1,964
(42.9%)
Females: 2,620
(57.1%)
For population 25 years and over in 29435:
High school or higher: 80.3%
Bachelor's degree or higher: 7.9%
Graduate or professional degree: 3.2%
Unemployed: 3.3%
Mean travel time to work (commute): 36.6 minutes
For population 15 years and over in 29435:
Never married: 22.1%
Now married: 61.3%
Separated: 2.3%
Widowed: 6.0%
Divorced: 8.3%
Zip code 29435 compared to state average:
Hispanic race population percentage above state average.
Renting percentage significantly below state average.
Length of stay since moving in significantly above state average.
Number of college students below state average.
Percentage of population with a bachelor's degree or higher significantly below state average.
Estimated median house/condo value in 2022: $173,227
29435:
$173,227
South Carolina:
$254,600
Median resident age:
This zip code:
38.1 years
South Carolina median age:
40.5 years
Average household size:
This zip code:
2.6 people
South Carolina:
2.4 people
Averages for the 2020 tax year for zip code 29435, filed in 2021:
Average Adjusted Gross Income (AGI) in 2020: $44,972 (Individual Income Tax Returns)
Here:
$44,972
State:
$65,754
Salary/wage: $41,968 (reported on 82.0% of returns)
Here:
$41,968
State:
$52,566
(% of AGI for various income ranges: 1252.0% for AGIs below $25k, 3746.0% for AGIs $25k-50k, 7002.7% for AGIs $50k-75k, 11152.2% for AGIs $75k-100k, 22165.7% for AGIs $100k-200k)
Taxable interest for individuals: $814 (reported on 15.3% of returns)
This zip code:
$814
South Carolina:
$1,749
(% of AGI for various income ranges: 10.4% for AGIs below $25k, 3.6% for AGIs $25k-50k, 17.7% for AGIs $50k-75k, 11.1% for AGIs $75k-100k, 160.0% for AGIs $100k-200k)
Ordinary dividends: $1,175 (reported on 6.6% of returns)
Here:
$1,175
State:
$8,783
(% of AGI for various income ranges: 14.3% for AGIs $25k-50k, 15.0% for AGIs $50k-75k, 68.6% for AGIs $100k-200k)
Net capital gain/loss in AGI: +$5,560 (reported on 5.5% of returns)
Here:
+$5,560
State:
+$24,194
(% of AGI for various income ranges: 17.6% for AGIs $25k-50k, 38.2% for AGIs $50k-75k, 568.6% for AGIs $100k-200k)
Profit/loss from business: +$7,506 (reported on 17.5% of returns)
Here:
+$7,506
State:
+$11,253
(% of AGI for various income ranges: 109.0% for AGIs below $25k, 134.8% for AGIs $25k-50k, 305.0% for AGIs $50k-75k, 400.0% for AGIs $75k-100k, 371.4% for AGIs $100k-200k)
Taxable individual retirement arrangement distribution: $16,588 (reported on 4.4% of returns)
29435:
$16,588
South Carolina:
$21,604
(% of AGI for various income ranges: 147.9% for AGIs $25k-50k, 784.4% for AGIs $75k-100k)
Total itemized deductions: $26,988 (reported on 4.4% of returns)
Here:
$26,988
State:
$35,199
(% of AGI for various income ranges: 570.5% for AGIs $50k-75k, 1291.4% for AGIs $100k-200k)
Charity contributions: $11,500 (reported on 2.7% of returns)
Here:
$11,500
State:
$14,319
(% of AGI for various income ranges: 82.3% for AGIs $50k-75k, 562.9% for AGIs $100k-200k)
Taxes paid: $6,500 (reported on 3.8% of returns)
29435:
$6,500
State:
$7,486
(% of AGI for various income ranges: 116.8% for AGIs $50k-75k, 282.9% for AGIs $100k-200k)
Earned income credit: $2,472 (reported on 25.1% of returns)
Here:
$2,472
State:
$2,397
(% of AGI for various income ranges: 144.8% for AGIs below $25k, 98.3% for AGIs $25k-50k)
Percentage of individuals using paid preparers for their 2020 taxes: 92.9%
Here:
93%
State:
93%
(% for various income ranges: 92.5% for AGIs below $25k, 92.7% for AGIs $25k-50k, 93.5% for AGIs $50k-75k, 93.3% for AGIs $75k-100k, 93.3% for AGIs $100k-200k)
Averages for the 2012 tax year for zip code 29435, filed in 2013:
Average Adjusted Gross Income (AGI) in 2012: $36,724 (Individual Income Tax Returns)
Here:
$36,724
State:
$51,133
Salary/wage: $34,317 (reported on 84.0% of returns)
Here:
$34,317
State:
$42,173
(% of AGI for various income ranges: 73.2% for AGIs below $25k, 83.3% for AGIs $25k-50k, 77.6% for AGIs $50k-75k, 79.0% for AGIs $75k-100k, 75.8% for AGIs $100k-200k)
Taxable interest for individuals: $600 (reported on 17.3% of returns)
This zip code:
$600
South Carolina:
$1,468
(% of AGI for various income ranges: 0.4% for AGIs below $25k, 0.3% for AGIs $25k-50k, 0.3% for AGIs $50k-75k, 0.1% for AGIs $75k-100k, 0.3% for AGIs $100k-200k)
Ordinary dividends: $730 (reported on 6.4% of returns)
Here:
$730
State:
$6,511
(% of AGI for various income ranges: 0.2% for AGIs $25k-50k, 0.1% for AGIs $50k-75k, 0.3% for AGIs $75k-100k)
Net capital gain/loss in AGI: +$1,000 (reported on 3.8% of returns)
Here:
+$1,000
State:
+$13,061
Profit/loss from business: +$7,035 (reported on 14.7% of returns)
Here:
+$7,035
State:
+$10,167
(% of AGI for various income ranges: 10.3% for AGIs below $25k, 2.3% for AGIs $25k-50k, 1.3% for AGIs $50k-75k, 1.1% for AGIs $75k-100k)
Taxable individual retirement arrangement distribution: $9,575 (reported on 5.1% of returns)
29435:
$9,575
South Carolina:
$17,019
(% of AGI for various income ranges: 1.4% for AGIs below $25k, 1.5% for AGIs $25k-50k, 4.0% for AGIs $75k-100k)
Total itemized deductions: $17,756 (27% of AGI, reported on 23.1% of returns)
Here:
$17,756
State:
$22,890
Here:
27.1% of AGI
State:
21.4% of AGI
(% of AGI for various income ranges: 5.1% for AGIs below $25k, 9.9% for AGIs $25k-50k, 12.7% for AGIs $50k-75k, 13.1% for AGIs $75k-100k, 15.4% for AGIs $100k-200k)
Charity contributions: $3,585 (reported on 17.3% of returns)
Here:
$3,585
State:
$5,169
(% of AGI for various income ranges: 0.3% for AGIs below $25k, 1.9% for AGIs $25k-50k, 1.7% for AGIs $50k-75k, 1.5% for AGIs $75k-100k, 2.8% for AGIs $100k-200k)
Taxes paid: $4,889 (reported on 23.1% of returns)
29435:
$4,889
State:
$7,644
(% of AGI for various income ranges: 0.7% for AGIs below $25k, 2.0% for AGIs $25k-50k, 3.4% for AGIs $50k-75k, 4.2% for AGIs $75k-100k, 5.7% for AGIs $100k-200k)
Earned income credit: $2,491 (reported on 30.1% of returns)
Here:
$2,491
State:
$2,418
(% of AGI for various income ranges: 9.8% for AGIs below $25k, 1.6% for AGIs $25k-50k)
Percentage of individuals using paid preparers for their 2012 taxes: 59.6%
Here:
60%
State:
57%
(% for various income ranges: 56.9% for AGIs below $25k, 56.5% for AGIs $25k-50k, 65.0% for AGIs $50k-75k, 72.7% for AGIs $75k-100k, 71.4% for AGIs $100k-200k)
Averages for the 2004 tax year for zip code 29435, filed in 2005:
Average Adjusted Gross Income (AGI) in 2004: $30,973 (Individual Income Tax Returns)
Here:
$30,973
State:
$41,965
Salary/wage: $29,463 (reported on 85.7% of returns)
Here:
$29,463
State:
$35,695
(% of AGI for various income ranges: 88.1% for AGIs below $10k, 79.6% for AGIs $10k-25k, 87.0% for AGIs $25k-50k, 81.8% for AGIs $50k-75k, 82.2% for AGIs $75k-100k, 63.3% for AGIs over 100k)
Taxable interest for individuals: $543 (reported on 24.5% of returns)
This zip code:
$543
South Carolina:
$1,623
(% of AGI for various income ranges: 1.5% for AGIs below $10k, 0.8% for AGIs $10k-25k, 0.3% for AGIs $25k-50k, 0.3% for AGIs $50k-75k, 0.4% for AGIs $75k-100k, 0.3% for AGIs over 100k)
Taxable dividends: $450 (reported on 7.1% of returns)
Here:
$450
State:
$3,999
(% of AGI for various income ranges: 0.1% for AGIs $10k-25k, 0.1% for AGIs $25k-50k, 0.2% for AGIs $50k-75k, 0.2% for AGIs $75k-100k)
Net capital gain/loss: +$3,844 (reported on 6.2% of returns)
Here:
+$3,844
State:
+$13,100
(% of AGI for various income ranges: 0.1% for AGIs $10k-25k, 0.2% for AGIs $25k-50k, 2.1% for AGIs $50k-75k, 1.5% for AGIs $75k-100k)
Profit/loss from business: +$4,188 (reported on 17.5% of returns)
Here:
+$4,188
State:
+$9,144
(% of AGI for various income ranges: 11.4% for AGIs below $10k, 5.8% for AGIs $10k-25k, 1.7% for AGIs $25k-50k, 1.2% for AGIs $50k-75k, 1.2% for AGIs $75k-100k)
IRA payment deduction: $1,818 (reported on 0.7% of returns)
29435:
$1,818
South Carolina:
$2,972
Total itemized deductions: $15,144 (28% of AGI, reported on 25.0% of returns)
Here:
$15,144
State:
$19,039
Here:
27.6% of AGI
State:
22.8% of AGI
(% of AGI for various income ranges: 9.0% for AGIs $10k-25k, 12.4% for AGIs $25k-50k, 13.4% for AGIs $50k-75k, 16.3% for AGIs $75k-100k, 12.8% for AGIs over 100k)
Charity contributions deductions: $2,991 (5% of AGI, reported on 21.4% of returns)
Here:
$2,991
State:
$4,305
Here:
5.4% of AGI
State:
5.0% of AGI
(% of AGI for various income ranges: 1.0% for AGIs $10k-25k, 2.0% for AGIs $25k-50k, 2.2% for AGIs $50k-75k, 3.9% for AGIs $75k-100k, 2.1% for AGIs over 100k)
Total tax: $3,550 (reported on 67.2% of returns)
29435:
$3,550
State:
$6,497
(% of AGI for various income ranges: 3.1% for AGIs below $10k, 3.4% for AGIs $10k-25k, 5.8% for AGIs $25k-50k, 8.4% for AGIs $50k-75k, 10.4% for AGIs $75k-100k, 18.2% for AGIs over 100k)
Earned income credit: $1,934 (reported on 28.3% of returns)
Here:
$1,934
State:
$1,882
Percentage of individuals using paid preparers for their 2004 taxes: 69.6%
Here:
70%
State:
66%
(% for various income ranges: 64.3% for AGIs below $10k, 71.0% for AGIs $10k-25k, 68.5% for AGIs $25k-50k, 74.6% for AGIs $50k-75k, 73.3% for AGIs $75k-100k, 74.2% for AGIs over 100k)
Household received Food Stamps/SNAP in the past 12 months: 404 Household did not receive Food Stamps/SNAP in the past 12 months: 1,340
Women who had a birth in the past 12 months: 5 (5 now married, 0 unmarried) Women who did not have a birth in the past 12 months: 858 (469 now married, 392 unmarried)
Housing units in zip code 29435 with a mortgage: 929 (49 second mortgage, 46 both second mortgage and home equity loan) Houses without a mortgage: 7
Median monthly owner costs for units with a mortgage: $1,108 Median monthly owner costs for units without a mortgage: $335
Residents with income below the poverty level in 2022:
This zip code:
15.6%
Whole state:
14.0%
Residents with income below 50% of the poverty level in 2022:
This zip code:
10.7%
Whole state:
7.3%
Median number of rooms in houses and condos:
Here:
6.4
State:
6.4
Median number of rooms in apartments:
Here:
4.2
State:
4.5
Notable locations in this zip code not listed on our city pages
Notable locations in zip code 29435: Cottageville Fire Department (A), Colleton County Fire - Rescue Cottageville (B), Colleton County Fire - Rescue Maple Cane (C), Cottageville Police Department (D). Display/hide their locations on the map
Churches in zip code 29435 include: Rehoboth Church (A), Cottageville Church (B), Cottageville Baptist Church (C), Edisto Church (D), Hickory Hill Church (E), Maple Cane Church (F), Jericho Church (G), Little Rock Church (H), Wesley Church (I). Display/hide their locations on the map
Cemeteries: Ferguson Cemetery (1), Ackerman Cemetery (2), Adams Cemetery (3), Hughes Cemetery (4), Williams Cemetery (5). Display/hide their locations on the map
Size of family households: 505 2-persons, 193 3-persons, 290 4-persons, 152 5-persons, 37 6-persons, 75 7-or-more-persons
Size of nonfamily households: 394 1-person, 80 2-persons, 7 3-persons
833 married couples with children.
312 single-parent households (30 men, 282 women).
87.7% of residents of 29435 zip code speak English at home.
12.2% of residents speak Spanish at home (32% very well, 6% well, 36% not well, 27% not at all).
Foreign born population: 329 (7.2%) (6.0% of them are naturalized citizens)
This zip code:
7.2%
Whole state:
5.2%
91%Honduras
1%Sweden
12%European
11%American
11%English
7%Irish
3%French
3%Italian
3%German
Year of entry for the foreign-born population
2782010 or later
252000 to 2009
291990 to 1999
134Before 1990
Facilities with environmental interests located in this zip code:
BECKER MINERALS INCORPORATED SANDY RUN (SR 13 35 in COTTAGEVILLE, SC)
(Resource Conservation and Recovery Act (tracking hazardous waste)) STATE MASTER (South Carolina database) - HAZARDOUS WASTE PROGRAM Organizations: OPERNAME (CONTACT/OPERATOR)
FOSTER DIXIANA/SANDY RUN MINE (STATE ROAD 15-35 in COTTAGEVILLE, SC)
National Pollutant Discharge Elimination System NON-MAJOR (Tracking pollutant discharge elimination systems) - permit STATE MASTER (South Carolina database) - National Pollutant Discharge Elimination System Permit Business SIC classification: CONSTRUCTION SAND AND GRAVEL
COTTAGEVILLE ELEMENTARY SCHOOL (72 SALLY ACKERMAN DRIVE in COTTAGEVILLE, SC)
(Geographic Names Information System) (National Center for Education Statistics) - STATE ID-1501011 Organizations: COLLETON COUNTY SCHOOL DISTRICT (SCHOOL DISTRICT)
CAROLINA CLEARING/CLYDEVILLE (781 CLYDEVILLE LN in COTTAGEVILLE, SC)
National Pollutant Discharge Elimination System NON-MAJOR (Tracking pollutant discharge elimination systems) - permit Business SIC classification: MISCELLANEOUS NONMETALLIC MINERALS, EXCEPT FUELS
EDISTO MINING/EDISTO #1 (SULLIVAN LANDING ROAD in COTTAGEVILLE, SC)
National Pollutant Discharge Elimination System NON-MAJOR (Tracking pollutant discharge elimination systems) - permit Business SIC classification: CONSTRUCTION SAND AND GRAVEL
Housing units lacking complete plumbing facilities: 0.3% Housing units lacking complete kitchen facilities: 0.8%
84.8%Electricity
9.9%Bottled, tank, or LP gas
2.1%Wood
1.5%Utility gas
1.1%Fuel oil, kerosene, etc.
0.5%Solar energy
Population in 1990: 4,105.
Place of birth for U.S.-born residents:
This state: 2,918
Northeast: 331
Midwest: 182
South: 601
West: 54
64% of the 29435 zip code residents lived in the same house 5 years ago. Out of people who lived in different houses, 39% lived in this county. Out of people who lived in different counties, 50% lived in South Carolina.
97% of the 29435 zip code residents lived in the same house 1 year ago. Out of people who lived in different houses, 11% moved from this county. Out of people who lived in different houses, 46% moved from different county within same state. Out of people who lived in different houses, 48% moved from different state.
Private vs. public school enrollment:
Students in private schools in grades 1 to 8 (elementary and middle school): 45
Here:
5.8%
South Carolina:
14.4%
Students in private schools in grades 9 to 12 (high school): 15
Here:
6.4%
South Carolina:
11.1%
Students in private undergraduate colleges: 9
Here:
11.9%
South Carolina:
21.9%
Occupation by median earnings in the past 12 months ($)
148,307Life, physical, and social science occupations
72,978Installation, maintenance, and repair occupations
68,162Architecture and engineering occupations
48,580Transportation occupations
45,560Management occupations
45,049Fire fighting and prevention, and other protective service workers including supervisors
Companies with federal contracts located in this zip code:
DEANS CONSTRUCTION (3461 RED OAK ROAD in COTTAGEVILLE, SC; small business) : $163,720 in 9 contractsfrom 1999 to 2003
Contracts for Construction of Structures and Facilities -- Miscellaneous Buildings, Maintenance, Repair or Alteration of Real Property -- Other Non-Building Facilities, Maintenance, Repair or Alteration of Real Property -- Miscellaneous Buildings by Navy Signed by year:2000: $65,000; 2001: $32,356; 2002: $21,250; 2003: $22,500; 2004: $0; 2005: $0; 2006: $0.
Biggest contracts:
$65,000 with Navy for Construction of Structures and Facilities -- Miscellaneous Buildings. Signed on 2000-08-17. Completion date: 2000-10-31.
$22,614 with Navy for Maintenance, Repair or Alteration of Real Property -- Other Non-Building Facilities. Signed on 1999-10-01. Completion date: 1999-10-27.
$18,500 with Navy for Maintenance, Repair or Alteration of Real Property -- Miscellaneous Buildings. Signed on 2001-09-28. Completion date: 2001-11-27.
$16,000, same as above.Signed on 2003-07-22. Completion date: 2003-09-30.
Top industries in this zip code by the number of employees in 2005:
Educational Services: Elementary and Secondary Schools (50-99 employees: 1 establishment)
Construction: Plumbing, Heating, and Air-Conditioning Contractors (20-49: 1, 5-9: 2)
Construction: Poured Concrete Foundation and Structure Contractors (10-19: 1, 5-9: 1, 1-4: 1)
Accommodation and Food Services: Limited-Service Restaurants (10-19: 1, 1-4: 2)
Other Services (except Public Administration): Beauty Salons (10-19: 1)
Construction: Site Preparation Contractors (10-19: 1)
Health Care and Social Assistance: Offices of Physicians (except Mental Health Specialists) (10-19: 1)
Construction: Commercial and Institutional Building Construction (10-19: 1)
Fatal accident statistics in 2014:
Fatal accident count: 1
Vehicles involved in fatal accidents: 1
Fatal accidents caused by drunken drivers: 1
Fatalities: 1
Persons involved in fatal accidents: 1
Pedestrians involved in fatal accidents: 0
Fatal accident statistics in 2011:
Fatal accident count: 1
Vehicles involved in fatal accidents: 2
Fatal accidents caused by drunken drivers: 0
Fatalities: 1
Persons involved in fatal accidents: 2
Pedestrians involved in fatal accidents: 0
2002 - 2018 National Fire Incident Reporting System (NFIRS) incidents
According to the data from the years 2002 - 2018 the average number of fire incidents per year is 57. The highest number of fire incidents - 111 took place in 2007, and the least - 26 in 2003. The data has a dropping trend.
When looking into fire subcategories, the most incidents belonged to: Outside Fires (63.0%), and Structure Fires (22.0%).
Fire incident types reported to NFIRS in Zip Code 29435


 Nearest zip codes: 29474, 29472, 29437, 29426, 29477, 29488.


 According to the data from the years 2002 - 2018 the average number of fire incidents per year is 57. The highest number of fire incidents - 111 took place in 2007, and the least - 26 in 2003. The data has a dropping trend.
 When looking into fire subcategories, the most incidents belonged to: Outside Fires (63.0%), and Structure Fires (22.0%).