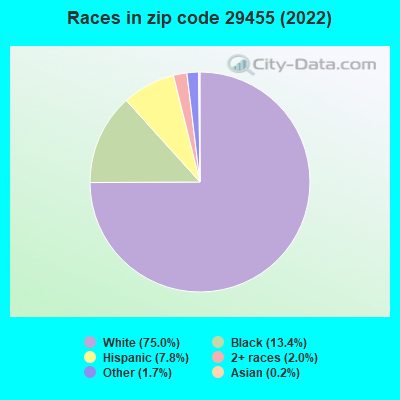
Estimated zip code population in 2022: 26,141 Zip code population in 2010: 20,478 Zip code population in 2000: 13,684
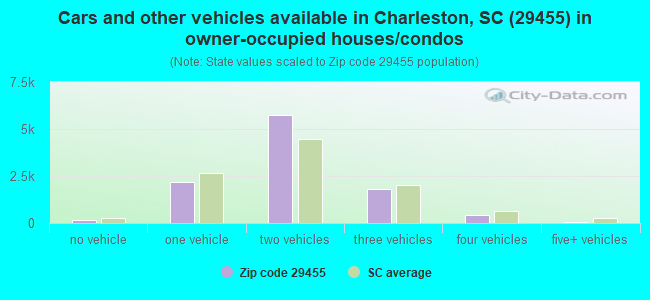
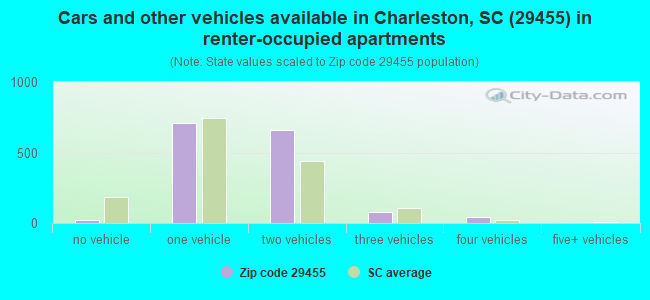
Houses and condos: 17,194 Renter-occupied apartments: 1,507
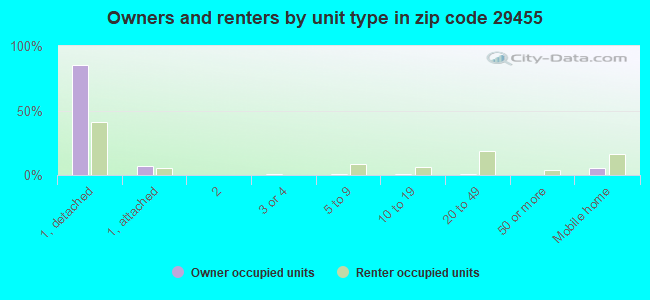
% of renters here:
13%
State:
28%
March 2022 cost of living index in zip code 29455: 84.2 (less than average, U.S. average is 100)
Land area: 107.1 sq. mi. Water area: 11.0 sq. mi.
Population density: 244 people per square mile
(very low).
OSM Map
General Map
Google Map
MSN Map
OSM Map
General Map
Google Map
MSN Map
OSM Map
General Map
Google Map
MSN Map
OSM Map
General Map
Google Map
MSN Map
Please wait while loading the map...
Real estate property taxes paid for housing units in 2022:
This zip code:
0.4% ($2,182)
South Carolina:
0.5% ($1,185)
Median real estate property taxes paid for housing units with mortgages in 2022: $2,162 (0.4%) Median real estate property taxes paid for housing units with no mortgage in 2022: $2,223 (0.4%)
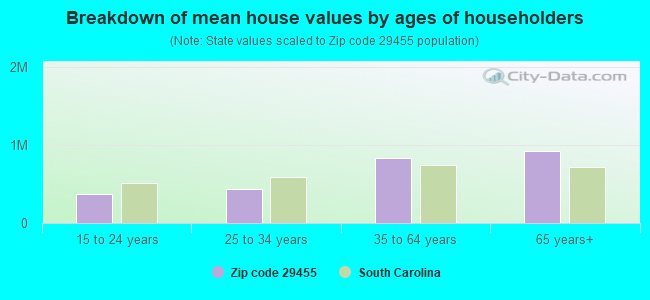
Estimated median house/condo value in 2022: $537,934
29455:
$537,934
South Carolina:
$254,600
According to our research of South Carolina and other state lists, there were 6 registered sex offenders living in 29455 zip code as of May 19, 2024. The ratio of all residents to sex offenders in zip code 29455 is 3,584 to 1. The ratio of registered sex offenders to all residents in this zip code is much lower than the state average.
Median resident age:
This zip code:
51.8 years
South Carolina median age:
40.5 years
Average household size:
This zip code:
2.2 people
South Carolina:
2.4 people
Averages for the 2020 tax year for zip code 29455, filed in 2021:
Average Adjusted Gross Income (AGI) in 2020: $151,342 (Individual Income Tax Returns)
Here:
$151,342
State:
$65,754
Salary/wage: $95,244 (reported on 78.2% of returns)
Here:
$95,244
State:
$52,566
(% of AGI for various income ranges: 1282.0% for AGIs below $25k, 3953.0% for AGIs $25k-50k, 6834.6% for AGIs $50k-75k, 10203.8% for AGIs $75k-100k, 18402.1% for AGIs $100k-200k, 130301.8% for AGIs over 200k)
Taxable interest for individuals: $4,348 (reported on 34.6% of returns)
This zip code:
$4,348
South Carolina:
$1,749
(% of AGI for various income ranges: 15.5% for AGIs below $25k, 23.6% for AGIs $25k-50k, 44.1% for AGIs $50k-75k, 100.6% for AGIs $75k-100k, 202.6% for AGIs $100k-200k, 3983.6% for AGIs over 200k)
Ordinary dividends: $38,752 (reported on 30.4% of returns)
Here:
$38,752
State:
$8,783
(% of AGI for various income ranges: 49.5% for AGIs below $25k, 86.2% for AGIs $25k-50k, 162.3% for AGIs $50k-75k, 365.0% for AGIs $75k-100k, 988.7% for AGIs $100k-200k, 35326.6% for AGIs over 200k)
Net capital gain/loss in AGI: +$87,038 (reported on 29.2% of returns)
Here:
+$87,038
State:
+$24,194
(% of AGI for various income ranges: 24.6% for AGIs below $25k, 62.7% for AGIs $25k-50k, 142.9% for AGIs $50k-75k, 468.0% for AGIs $75k-100k, 1105.8% for AGIs $100k-200k, 81576.1% for AGIs over 200k)
Profit/loss from business: +$31,046 (reported on 21.2% of returns)
Here:
+$31,046
State:
+$11,253
(% of AGI for various income ranges: 165.4% for AGIs below $25k, 265.7% for AGIs $25k-50k, 500.6% for AGIs $50k-75k, 665.0% for AGIs $75k-100k, 1413.7% for AGIs $100k-200k, 13064.5% for AGIs over 200k)
Taxable individual retirement arrangement distribution: $43,725 (reported on 12.6% of returns)
29455:
$43,725
South Carolina:
$21,604
(% of AGI for various income ranges: 53.2% for AGIs below $25k, 111.2% for AGIs $25k-50k, 257.9% for AGIs $50k-75k, 640.5% for AGIs $75k-100k, 1606.0% for AGIs $100k-200k, 10962.7% for AGIs over 200k)
Self-employed (Keogh) retirement plans: $31,968 (reported on 1.7% of returns)
29455:
$31,968
South Carolina:
$25,038
(% of AGI for various income ranges: 8.0% for AGIs $25k-50k, 54.3% for AGIs $100k-200k, 1602.3% for AGIs over 200k)
Total itemized deductions: $49,670 (reported on 18.7% of returns)
Here:
$49,670
State:
$35,199
(% of AGI for various income ranges: 101.2% for AGIs below $25k, 188.1% for AGIs $25k-50k, 524.8% for AGIs $50k-75k, 968.5% for AGIs $75k-100k, 1917.1% for AGIs $100k-200k, 20776.4% for AGIs over 200k)
Charity contributions: $27,215 (reported on 15.3% of returns)
Here:
$27,215
State:
$14,319
(% of AGI for various income ranges: 5.6% for AGIs below $25k, 23.9% for AGIs $25k-50k, 63.1% for AGIs $50k-75k, 125.4% for AGIs $75k-100k, 344.4% for AGIs $100k-200k, 12558.0% for AGIs over 200k)
Taxes paid: $8,257 (reported on 18.6% of returns)
29455:
$8,257
State:
$7,486
(% of AGI for various income ranges: 15.9% for AGIs below $25k, 38.1% for AGIs $25k-50k, 132.5% for AGIs $50k-75k, 245.6% for AGIs $75k-100k, 539.7% for AGIs $100k-200k, 2409.8% for AGIs over 200k)
Earned income credit: $2,038 (reported on 10.7% of returns)
Here:
$2,038
State:
$2,397
(% of AGI for various income ranges: 88.4% for AGIs below $25k, 53.7% for AGIs $25k-50k)
Percentage of individuals using paid preparers for their 2020 taxes: 92.8%
Here:
93%
State:
93%
(% for various income ranges: 90.3% for AGIs below $25k, 92.6% for AGIs $25k-50k, 92.6% for AGIs $50k-75k, 93.6% for AGIs $75k-100k, 94.2% for AGIs $100k-200k, 95.3% for AGIs over 200k)
Averages for the 2012 tax year for zip code 29455, filed in 2013:
Average Adjusted Gross Income (AGI) in 2012: $94,873 (Individual Income Tax Returns)
Here:
$94,873
State:
$51,133
Salary/wage: $57,391 (reported on 80.2% of returns)
Here:
$57,391
State:
$42,173
(% of AGI for various income ranges: 78.7% for AGIs below $25k, 80.1% for AGIs $25k-50k, 69.1% for AGIs $50k-75k, 62.9% for AGIs $75k-100k, 53.2% for AGIs $100k-200k, 34.0% for AGIs over 200k)
Taxable interest for individuals: $4,316 (reported on 34.6% of returns)
This zip code:
$4,316
South Carolina:
$1,468
(% of AGI for various income ranges: 0.8% for AGIs below $25k, 0.7% for AGIs $25k-50k, 0.6% for AGIs $50k-75k, 1.1% for AGIs $75k-100k, 1.8% for AGIs $100k-200k, 1.9% for AGIs over 200k)
Ordinary dividends: $29,817 (reported on 27.0% of returns)
Here:
$29,817
State:
$6,511
(% of AGI for various income ranges: 1.8% for AGIs below $25k, 1.6% for AGIs $25k-50k, 2.9% for AGIs $50k-75k, 3.7% for AGIs $75k-100k, 5.4% for AGIs $100k-200k, 12.7% for AGIs over 200k)
Net capital gain/loss in AGI: +$54,020 (reported on 23.7% of returns)
Here:
+$54,020
State:
+$13,061
(% of AGI for various income ranges: 0.2% for AGIs $25k-50k, 0.7% for AGIs $50k-75k, 1.0% for AGIs $75k-100k, 2.9% for AGIs $100k-200k, 24.0% for AGIs over 200k)
Profit/loss from business: +$23,058 (reported on 19.8% of returns)
Here:
+$23,058
State:
+$10,167
(% of AGI for various income ranges: 8.7% for AGIs below $25k, 4.1% for AGIs $25k-50k, 4.1% for AGIs $50k-75k, 3.5% for AGIs $75k-100k, 3.4% for AGIs $100k-200k, 5.3% for AGIs over 200k)
Taxable individual retirement arrangement distribution: $46,655 (reported on 13.4% of returns)
29455:
$46,655
South Carolina:
$17,019
(% of AGI for various income ranges: 2.6% for AGIs below $25k, 1.7% for AGIs $25k-50k, 3.6% for AGIs $50k-75k, 5.3% for AGIs $75k-100k, 8.0% for AGIs $100k-200k, 7.9% for AGIs over 200k)
Self-employment retirement plans: $28,085 (reported on 1.3% of returns)
29455:
$28,085
South Carolina:
$21,023
(% of AGI for various income ranges: 0.5% for AGIs $100k-200k, 0.6% for AGIs over 200k)
Total itemized deductions: $37,965 (20% of AGI, reported on 41.2% of returns)
Here:
$37,965
State:
$22,890
Here:
20.2% of AGI
State:
21.4% of AGI
(% of AGI for various income ranges: 10.6% for AGIs below $25k, 13.3% for AGIs $25k-50k, 18.4% for AGIs $50k-75k, 18.2% for AGIs $75k-100k, 19.4% for AGIs $100k-200k, 16.1% for AGIs over 200k)
Charity contributions: $8,580 (reported on 35.0% of returns)
Here:
$8,580
State:
$5,169
(% of AGI for various income ranges: 0.8% for AGIs below $25k, 1.5% for AGIs $25k-50k, 2.1% for AGIs $50k-75k, 2.5% for AGIs $75k-100k, 2.8% for AGIs $100k-200k, 4.0% for AGIs over 200k)
Taxes paid: $13,952 (reported on 41.1% of returns)
29455:
$13,952
State:
$7,644
(% of AGI for various income ranges: 2.0% for AGIs below $25k, 3.0% for AGIs $25k-50k, 4.6% for AGIs $50k-75k, 5.8% for AGIs $75k-100k, 7.0% for AGIs $100k-200k, 6.9% for AGIs over 200k)
Earned income credit: $2,238 (reported on 16.9% of returns)
Here:
$2,238
State:
$2,418
(% of AGI for various income ranges: 6.5% for AGIs below $25k, 0.9% for AGIs $25k-50k)
Percentage of individuals using paid preparers for their 2012 taxes: 58.2%
Here:
58%
State:
57%
(% for various income ranges: 53.7% for AGIs below $25k, 52.9% for AGIs $25k-50k, 59.8% for AGIs $50k-75k, 59.0% for AGIs $75k-100k, 63.0% for AGIs $100k-200k, 83.1% for AGIs over 200k)
Averages for the 2004 tax year for zip code 29455, filed in 2005:
Average Adjusted Gross Income (AGI) in 2004: $91,988 (Individual Income Tax Returns)
Here:
$91,988
State:
$41,965
Salary/wage: $60,680 (reported on 80.4% of returns)
Here:
$60,680
State:
$35,695
(% of AGI for various income ranges: 211.4% for AGIs below $10k, 79.8% for AGIs $10k-25k, 77.3% for AGIs $25k-50k, 67.5% for AGIs $50k-75k, 58.9% for AGIs $75k-100k, 45.5% for AGIs over 100k)
Taxable interest for individuals: $3,686 (reported on 43.3% of returns)
This zip code:
$3,686
South Carolina:
$1,623
(% of AGI for various income ranges: 10.7% for AGIs below $10k, 1.6% for AGIs $10k-25k, 1.4% for AGIs $25k-50k, 2.3% for AGIs $50k-75k, 1.8% for AGIs $75k-100k, 1.7% for AGIs over 100k)
Taxable dividends: $11,280 (reported on 29.6% of returns)
Here:
$11,280
State:
$3,999
(% of AGI for various income ranges: 11.7% for AGIs below $10k, 2.0% for AGIs $10k-25k, 2.0% for AGIs $25k-50k, 3.2% for AGIs $50k-75k, 4.7% for AGIs $75k-100k, 3.8% for AGIs over 100k)
Net capital gain/loss: +$62,286 (reported on 26.5% of returns)
Here:
+$62,286
State:
+$13,100
(% of AGI for various income ranges: 6.4% for AGIs below $10k, 0.3% for AGIs $10k-25k, 0.7% for AGIs $25k-50k, 2.3% for AGIs $50k-75k, 2.8% for AGIs $75k-100k, 24.3% for AGIs over 100k)
Profit/loss from business: +$17,541 (reported on 18.4% of returns)
Here:
+$17,541
State:
+$9,144
(% of AGI for various income ranges: 11.4% for AGIs below $10k, 5.0% for AGIs $10k-25k, 3.7% for AGIs $25k-50k, 4.2% for AGIs $50k-75k, 4.4% for AGIs $75k-100k, 3.2% for AGIs over 100k)
IRA payment deduction: $3,104 (reported on 2.7% of returns)
29455:
$3,104
South Carolina:
$2,972
(% of AGI for various income ranges: 0.1% for AGIs $10k-25k, 0.2% for AGIs $25k-50k, 0.2% for AGIs $50k-75k, 0.2% for AGIs $75k-100k, 0.1% for AGIs over 100k)
Self-employed pension: $19,079 (reported on 1.8% of returns)
Here:
$19,079
South Carolina:
$15,117
(% of AGI for various income ranges: 0.1% for AGIs $25k-50k, 0.2% for AGIs $50k-75k, 0.4% for AGIs $75k-100k, 0.4% for AGIs over 100k)
Total itemized deductions: $36,548 (19% of AGI, reported on 41.4% of returns)
Here:
$36,548
State:
$19,039
Here:
19.1% of AGI
State:
22.8% of AGI
(% of AGI for various income ranges: 43.2% for AGIs below $10k, 12.3% for AGIs $10k-25k, 17.9% for AGIs $25k-50k, 22.8% for AGIs $50k-75k, 21.9% for AGIs $75k-100k, 15.2% for AGIs over 100k)
Charity contributions deductions: $10,072 (5% of AGI, reported on 37.5% of returns)
Here:
$10,072
State:
$4,305
Here:
4.9% of AGI
State:
5.0% of AGI
(% of AGI for various income ranges: 2.1% for AGIs below $10k, 1.4% for AGIs $10k-25k, 2.4% for AGIs $25k-50k, 3.2% for AGIs $50k-75k, 3.1% for AGIs $75k-100k, 4.7% for AGIs over 100k)
Total tax: $22,136 (reported on 73.1% of returns)
29455:
$22,136
State:
$6,497
(% of AGI for various income ranges: 6.9% for AGIs below $10k, 3.6% for AGIs $10k-25k, 6.8% for AGIs $25k-50k, 8.9% for AGIs $50k-75k, 10.2% for AGIs $75k-100k, 21.4% for AGIs over 100k)
Earned income credit: $1,846 (reported on 19.2% of returns)
Here:
$1,846
State:
$1,882
Percentage of individuals using paid preparers for their 2004 taxes: 66.3%
Here:
66%
State:
66%
(% for various income ranges: 61.0% for AGIs below $10k, 67.9% for AGIs $10k-25k, 62.8% for AGIs $25k-50k, 65.8% for AGIs $50k-75k, 62.3% for AGIs $75k-100k, 77.6% for AGIs over 100k)
Likely homosexual households (counted as self-reported same-sex unmarried-partner households)
Lesbian couples: 0.4% of all households
Gay men: 0.0% of all households
Household received Food Stamps/SNAP in the past 12 months: 388 Household did not receive Food Stamps/SNAP in the past 12 months: 11,322
Women who had a birth in the past 12 months: 131 (139 now married, 0 unmarried) Women who did not have a birth in the past 12 months: 4,563 (2,633 now married, 1,956 unmarried)
Housing units in zip code 29455 with a mortgage: 6,651 (660 second mortgage, 4 home equity loan, 445 both second mortgage and home equity loan) Houses without a mortgage: 549
Median monthly owner costs for units with a mortgage: $2,141 Median monthly owner costs for units without a mortgage: $700
Residents with income below the poverty level in 2022:
This zip code:
7.9%
Whole state:
14.0%
Residents with income below 50% of the poverty level in 2022:
This zip code:
3.7%
Whole state:
7.3%
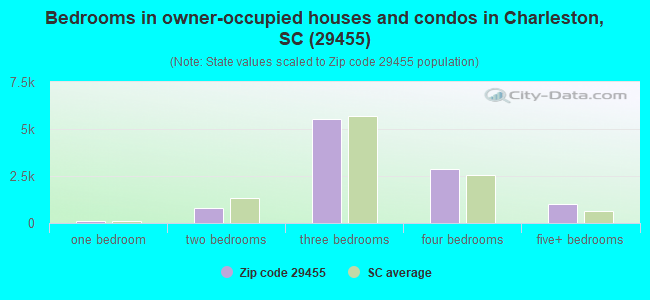
Median number of rooms in houses and condos:
Here:
6.7
State:
6.4
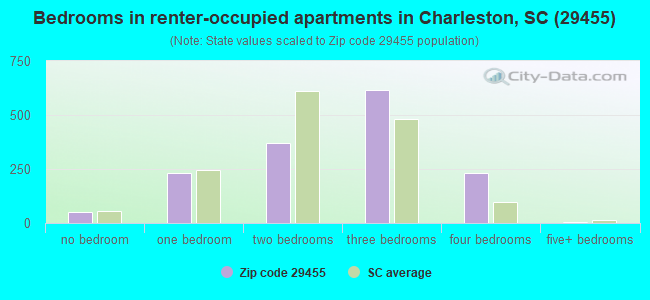
Median number of rooms in apartments:
Here:
5.0
State:
4.5
Notable locations in this zip code not listed on our city pages
Notable locations in zip code 29455: Johns Island Community Center (A), Stono Marina (B), Ocean Course Golf Course (C), Seven Oaks (D), Mullet Hall (E), Bohicket Marina (F), Storybook Farm (G), Stono River Stable Farm (H), Eden Wind Farm (I), Fenwick Hall (J), Exchange Landing (K), Cottage Plantation (L), Buzzards Roost Marina (M), Big Oaks Hunting Club (N), Saint John's Fire Department Station 7 (O), Johns Island Magistrate Office (P), Saint John's Fire Department Station 6 (Q), City of Charleston Fire Department Station 17 (R), Saint John's Fire Department Station 5 (S), Saint John's Fire Department Station 1 (T). Display/hide their locations on the map
Churches in zip code 29455 include: Saint Andrews Church (A), Saint James Church (B), Saint Johns Church (C), Saint Marys Church (D), Saint Matthews Church (E), Bethany Church (F), Blessed Sacrament Church (G), Calvary Church (H), Faith Church (I). Display/hide their locations on the map
Rivers and creeks: Stono River (A), Rantowles Creek (B), Privateer Creek (C), Pennys Creek (D), North Edisto River (E), Kiawah River (F), Hut Creek (G), Haulover Creek (H), Cinder Creek (I). Display/hide their locations on the map
2,422 married couples with children.
580 single-parent households (171 men, 409 women).
92.6% of residents of 29455 zip code speak English at home.
5.8% of residents speak Spanish at home (70% very well, 16% well, 13% not well, 1% not at all).
1.9% of residents speak other Indo-European language at home (91% very well, 9% well).
0.1% of residents speak Asian or Pacific Island language at home (100% well).
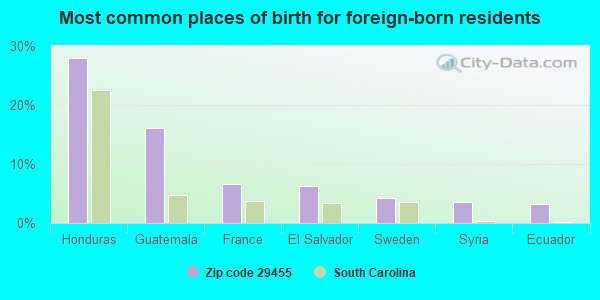
Foreign born population: 1,355 (5.2%) (52.3% of them are naturalized citizens)
This zip code:
5.2%
Whole state:
5.2%
28%Honduras
16%Guatemala
7%France
6%El Salvador
4%Sweden
3%Syria
3%Ecuador
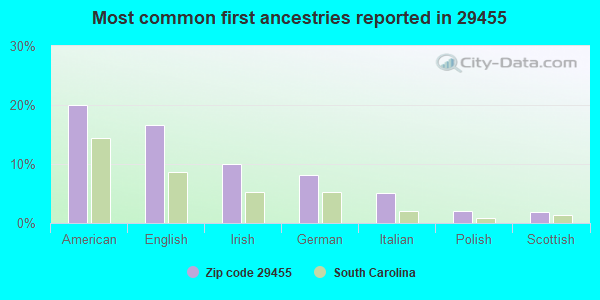
20%American
17%English
10%Irish
8%German
5%Italian
2%Polish
2%Scottish
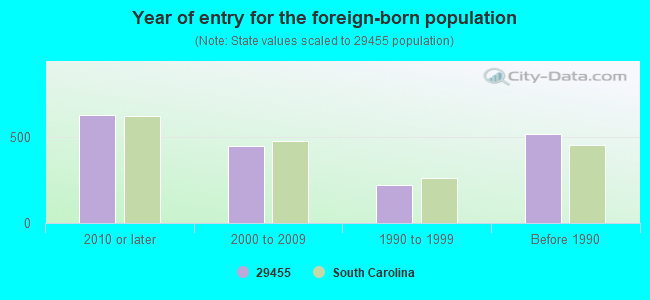
Year of entry for the foreign-born population
6292010 or later
4492000 to 2009
2191990 to 1999
521Before 1990
Major facilities with environmental interests located in this zip code:
CHARLESTON CLEANERS (3219 MAYBANK HWY in JOHNS ISLAND, SC)
(Resource Conservation and Recovery Act (tracking hazardous waste)) Small Quantity Generators, between 100 kg and 1000 kg of hazardous waste/month (Resource Conservation and Recovery Act (tracking hazardous waste)) - notification STATE MASTER (South Carolina database) - HAZARDOUS WASTE PROGRAM Organizations: OPERNAME (CONTACT/OPERATOR)
, KARAL HEISE (CONTACT/OWNER)
, SUE LEE FLOYD & CHONG LEE PONG (CONTACT/OWNER)
Alternative names: SEA ISLAND CLEANER
COASTAL CONCRETE (3644 BELVEDERE RD in JOHNS ISLAND, SC)
AIR MINOR (AIRS/AFS) STATE MASTER (South Carolina database) - AIR PROGRAM, STATE MASTER (South Carolina database) - AIR PROGRAM Business SIC classification: READY-MIXED CONCRETE Alternative names: COASTAL CONCRETE INC JOHNS ISLAND, COASTAL CONCRETE INC - JOHNS ISLAND MOBILE, COASTAL CONCRETE:CHARLESTON #1
AGFEE DIVISION BAYER CORPORATION C O KIAWAH ISL RES (12 KIAWAH BEACH DR in KIAWAH ISLAND, SC)
Conditionally Exempt Small Quantity Generators, less than 100 kg/month of hazardous waste (Resource Conservation and Recovery Act (tracking hazardous waste)) - notification STATE MASTER (South Carolina database) - HAZARDOUS WASTE PROGRAM Organizations: AGFA DIV BAYER CORP (CONTACT/OWNER)
Alternative names: AGFEE DIVISION BAYER CORP C/O KIAWAH ISL
BUZZARDS ROOST MARINA INCORPORATED (BUZZARDS ROOST 2408 MAYBANK HY in JOHNS ISLAND, SC)
AIR PROGRAM (Clean Air Markets Division Business System) STATE MASTER (South Carolina database) - National Pollutant Discharge Elimination System Permit Organizations: DUKE ENERGY CORPORATION (OWNER/OPERATOR)
COASTAL CLEANERS (2770 MAYBANK HWY UNIT H in JOHNS ISLAND, SC)
Small Quantity Generators, between 100 kg and 1000 kg of hazardous waste/month (Resource Conservation and Recovery Act (tracking hazardous waste)) - notification STATE MASTER (South Carolina database) - HAZARDOUS WASTE PROGRAM Organizations: DBA COASTAL CLEANERS (CONTACT/OWNER)
ANGEL OAK ELEMENTARY (6134 CHISOLM ROAD in JOHNS ISLAND, SC)
(National Center for Education Statistics) - STATE ID-1001083 Organizations: CHARLESTON COUNTY SCHOOL DISTRICT (SCHOOL DISTRICT)
BISHOP CONST/ED'S MINE (3716 MARY ANN POINT ROAD in JOHNS ISLAND, SC)
National Pollutant Discharge Elimination System NON-MAJOR (Tracking pollutant discharge elimination systems) - permit Business SIC classification: MISCELLANEOUS NONMETALLIC MINERALS, EXCEPT FUELS
BRUCE BISHOP/BISHOP MINE I (4019 BETSY KERRISON PARKWAY in JOHNS ISLAND, SC)
National Pollutant Discharge Elimination System NON-MAJOR (Tracking pollutant discharge elimination systems) - permit Business SIC classification: MISCELLANEOUS NONMETALLIC MINERALS, EXCEPT FUELS
BRUCE BISHOP/BISHOP MINE II (3934 BETSY KERRISON PARKWAY in JOHNS ISLAND, SC)
National Pollutant Discharge Elimination System NON-MAJOR (Tracking pollutant discharge elimination systems) - permit Business SIC classification: MISCELLANEOUS NONMETALLIC MINERALS, EXCEPT FUELS
BRUCE BISHOP/BISHOP MINE III (4788 RIVER ROAD in JOHNS ISLAND, SC)
National Pollutant Discharge Elimination System NON-MAJOR (Tracking pollutant discharge elimination systems) - permit Business SIC classification: MISCELLANEOUS NONMETALLIC MINERALS, EXCEPT FUELS
CHARLESTON COUNTY/KINSEY-BLAKE (MICHELLE LANE in JOHNS ISLAND, SC)
National Pollutant Discharge Elimination System NON-MAJOR (Tracking pollutant discharge elimination systems) - permit Business SIC classification: MISCELLANEOUS NONMETALLIC MINERALS, EXCEPT FUELS
D & A LLC/HARLEY BAKER MINE (4020 BETSY KERRISON PKWY in JOHNS ISLAND, SC)
National Pollutant Discharge Elimination System NON-MAJOR (Tracking pollutant discharge elimination systems) - permit Business SIC classification: MISCELLANEOUS NONMETALLIC MINERALS, EXCEPT FUELS
DELLS INC/FLIP PIT (2250 BOHICKET ROAD in JOHNS ISLAND, SC)
National Pollutant Discharge Elimination System NON-MAJOR (Tracking pollutant discharge elimination systems) - permit Business SIC classification: MISCELLANEOUS NONMETALLIC MINERALS, EXCEPT FUELS
Housing units lacking complete plumbing facilities: 0.2% Housing units lacking complete kitchen facilities: 0.6%
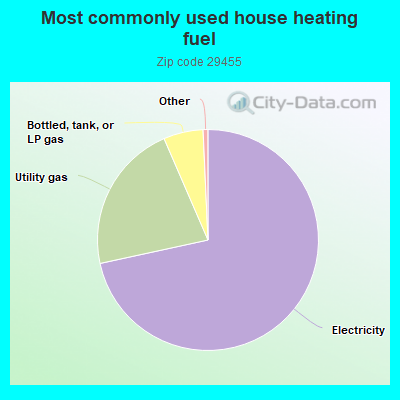
71.6%Electricity
21.9%Utility gas
5.8%Bottled, tank, or LP gas
Population in 1990: 11,756. Population change in the 1990s: +1,928 (+16.4%).
Place of birth for U.S.-born residents:
This state: 9,673
Northeast: 5,675
Midwest: 3,531
South: 4,978
West: 785
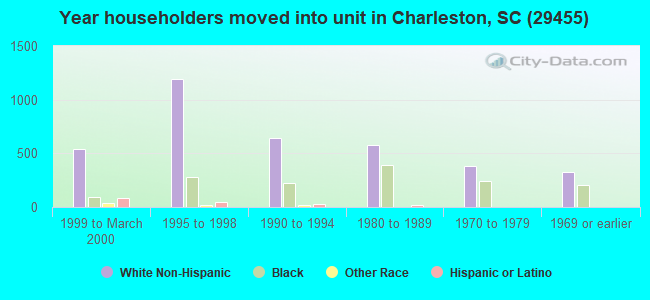
62% of the 29455 zip code residents lived in the same house 5 years ago. Out of people who lived in different houses, 63% lived in this county. Out of people who lived in different counties, 50% lived in South Carolina.
85% of the 29455 zip code residents lived in the same house 1 year ago. Out of people who lived in different houses, 39% moved from this county. Out of people who lived in different houses, 6% moved from different county within same state. Out of people who lived in different houses, 51% moved from different state. Out of people who lived in different houses, 6% moved from abroad.
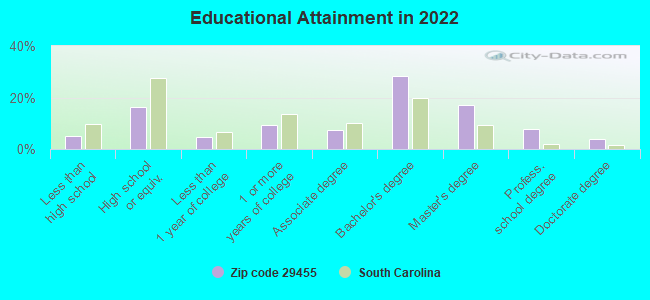
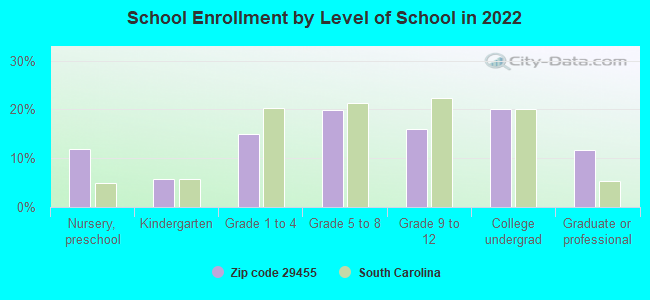
Private vs. public school enrollment:
Students in private schools in grades 1 to 8 (elementary and middle school): 386
Here:
29.5%
South Carolina:
14.4%
Students in private schools in grades 9 to 12 (high school): 128
Here:
21.8%
South Carolina:
11.1%
Students in private undergraduate colleges: 192
Here:
26.9%
South Carolina:
21.9%
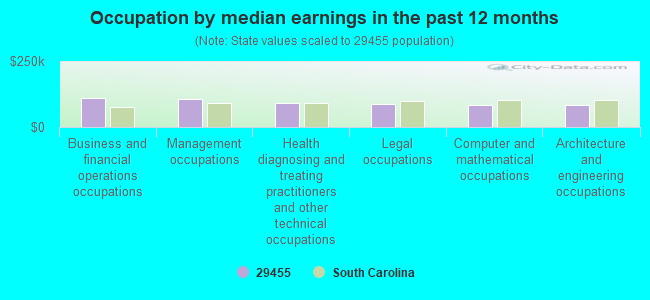
Occupation by median earnings in the past 12 months ($)
111,754Business and financial operations occupations
106,178Management occupations
93,114Health diagnosing and treating practitioners and other technical occupations
89,143Legal occupations
84,200Computer and mathematical occupations
84,079Architecture and engineering occupations
Companies with federal contracts located in this zip code (JOHNS ISLAND, SC):
BRAINWAVES INC (2191 RIVER ROAD; small business) : $1,046,304 in 15 contractsfrom 2002 to 2006
Contracts for Programming Services, Maintenance, Repair and Rebuilding of Equipment -- Communication, Detection, and Coherent Radiation Equipment, Other Special Studies and Analyses, Miscellaneous Items, and moreby Navy Signed by year:2000: $0; 2001: $0; 2002: $38,656; 2003: $69,184; 2004: $340,488; 2005: $403,349; 2006: $194,627.
Biggest contracts:
$99,267 with Navy for Programming Services. Signed on 2005-02-25. Completion date: 2005-03-15.
$99,032 with Navy for Maintenance, Repair and Rebuilding of Equipment -- Communication, Detection, and Coherent Radiation Equipment. Signed on 2004-09-29. Completion date: 2004-09-30.
$97,518, same as above.Signed on 2006-05-18. Completion date: 2006-06-30.
$97,109 with Navy for Other Special Studies and Analyses. Signed on 2006-03-07. Completion date: 2006-04-30.
J P ELECTRICAL INC (3467 HOBSON DR; small business) : $208,280 in 13 contractsfrom 2001 to 2005
Contracts for Miscellaneous Special Industry Machinery, Maintenance, Repair and Rebuilding of Equipment -- Communication, Detection, and Coherent Radiation Equipment, Miscellaneous Items, Wire, Nonelectrical by Navy Signed by year:2000: $0; 2001: $147,530; 2002: $0; 2003: $0; 2004: $18,000; 2005: $42,750; 2006: $0.
Biggest contracts:
$61,000 with Navy for Miscellaneous Special Industry Machinery. Signed on 2001-04-12. Completion date: 2001-04-19.
$48,130, same as above.Signed on 2001-08-02. Completion date: 2001-08-15.
$38,400, same as above.Signed on 2001-09-06. Completion date: 2001-09-30.
$14,250 with Navy for Maintenance, Repair and Rebuilding of Equipment -- Communication, Detection, and Coherent Radiation Equipment. Signed on 2004-10-06. Completion date: 2004-11-30.
MERCURY AIR GROUP (2700 FT TRENHOLM RD; small business)
$172,268 with Defense Logistics Agency for Liquid Propellants and Fuels, Petroleum Base. Signed on 2000-11-08. Completion date: 2002-03-31.
AUTO EQUIPMENT CO INC (518 BUFFLEHEAD DR; small business)
$83,738 with Navy for Maintenance, Repair or Alteration of Real Property -- Other Non-Building Facilities. Taking place in GA. Signed on 2004-08-17. Completion date: 2004-12-15.
LEGARE FARMS, INC (2442 HANSCOMBE POINT RD; small business)
$13,500 with Navy for Fertilizers. Signed on 2004-03-18. Completion date: 2004-04-09.
APPLIED ENGINEERED SYSTEMS L L (3404 LEGAREVILLE RD; small business)
$6,200 with Army for Engineering and Technical Services. Signed on 2003-01-27. Completion date: 2003-02-14.
Top industries in this zip code by the number of employees in 2005:
Construction: New Single-Family Housing Construction (except Operative Builders) (20-49: 1, 10-19: 3, 5-9: 7, 1-4: 22)
Other Services (except Public Administration): Other Similar Organizations (except Business, Professional, Labor, and Political Organizations) (50-99: 1, 20-49: 1, 10-19: 1, 1-4: 1)
People in group quarters in 2010:
127 people in nursing facilities/skilled-nursing facilities
People in group quarters in 2000:
25 people in other nonhousehold living situations
8 people in other noninstitutional group quarters
Fatal accident statistics in 2014:
Fatal accident count: 7
Vehicles involved in fatal accidents: 10
Fatal accidents caused by drunken drivers: 4
Fatalities: 7
Persons involved in fatal accidents: 12
Pedestrians involved in fatal accidents: 0
Fatal accident statistics in 2013:
Fatal accident count: 1
Vehicles involved in fatal accidents: 1
Fatal accidents caused by drunken drivers: 1
Fatalities: 3
Persons involved in fatal accidents: 3
Pedestrians involved in fatal accidents: 0
Home Mortgage Disclosure Act Aggregated Statistics For Year 2009 (Based on 2 full and 8 partial tracts)
A) FHA, FSA/RHS & VA Home Purchase Loans
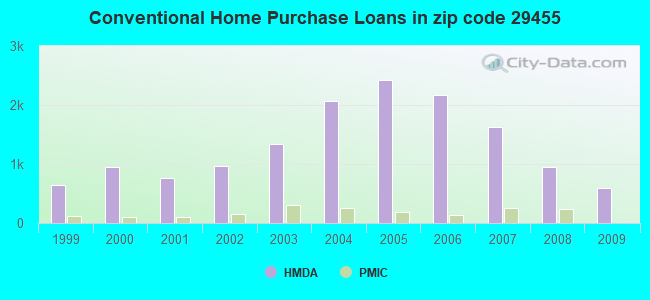
B) Conventional Home Purchase Loans
C) Refinancings
D) Home Improvement Loans
E) Loans on Dwellings For 5+ Families
F) Non-occupant Loans on < 5 Family Dwellings (A B C & D)
G) Loans On Manufactured Home Dwelling (A B C & D)
Number
Average Value
Number
Average Value
Number
Average Value
Number
Average Value
Number
Average Value
Number
Average Value
Number
Average Value
LOANS ORIGINATED
265
$207,818
588
$454,156
2,076
$342,011
66
$158,984
2
$1,620,900
1,062
$501,285
9
$127,081
APPLICATIONS APPROVED, NOT ACCEPTED
14
$195,495
50
$458,370
119
$262,573
2
$375,510
0
$0
54
$475,132
4
$44,690
APPLICATIONS DENIED
34
$191,316
94
$357,775
684
$322,412
38
$89,102
0
$0
243
$462,655
21
$106,083
APPLICATIONS WITHDRAWN
32
$209,110
74
$451,444
373
$328,001
6
$45,960
5
$27,119,458
151
$519,608
2
$233,460
FILES CLOSED FOR INCOMPLETENESS
6
$209,645
20
$408,063
85
$291,680
4
$277,600
0
$0
21
$410,262
0
$0
Aggregated Statistics For Year 2008 (Based on 2 full and 8 partial tracts)
A) FHA, FSA/RHS & VA Home Purchase Loans
B) Conventional Home Purchase Loans
C) Refinancings
D) Home Improvement Loans
F) Non-occupant Loans on < 5 Family Dwellings (A B C & D)
G) Loans On Manufactured Home Dwelling (A B C & D)
Number
Average Value
Number
Average Value
Number
Average Value
Number
Average Value
Number
Average Value
Number
Average Value
LOANS ORIGINATED
137
$213,532
945
$417,442
1,246
$375,135
104
$145,264
914
$548,241
28
$95,431
APPLICATIONS APPROVED, NOT ACCEPTED
17
$220,609
146
$367,894
148
$327,534
11
$67,959
106
$527,487
8
$88,834
APPLICATIONS DENIED
24
$185,512
137
$386,472
560
$288,648
80
$95,810
151
$447,718
32
$93,618
APPLICATIONS WITHDRAWN
17
$238,986
112
$508,113
234
$268,315
21
$154,776
102
$553,826
2
$230,530
FILES CLOSED FOR INCOMPLETENESS
2
$380,775
27
$700,084
66
$363,387
2
$448,285
16
$1,104,082
4
$111,775
Aggregated Statistics For Year 2007 (Based on 2 full and 8 partial tracts)
A) FHA, FSA/RHS & VA Home Purchase Loans
B) Conventional Home Purchase Loans
C) Refinancings
D) Home Improvement Loans
E) Loans on Dwellings For 5+ Families
F) Non-occupant Loans on < 5 Family Dwellings (A B C & D)
G) Loans On Manufactured Home Dwelling (A B C & D)
Number
Average Value
Number
Average Value
Number
Average Value
Number
Average Value
Number
Average Value
Number
Average Value
Number
Average Value
LOANS ORIGINATED
54
$210,891
1,623
$412,091
1,274
$370,449
163
$198,599
4
$1,708,062
1,048
$596,309
40
$92,441
APPLICATIONS APPROVED, NOT ACCEPTED
5
$199,026
216
$342,374
184
$346,947
22
$96,581
0
$0
126
$529,652
14
$101,880
APPLICATIONS DENIED
5
$130,114
189
$370,449
680
$302,850
171
$87,133
0
$0
132
$614,901
48
$108,063
APPLICATIONS WITHDRAWN
4
$184,578
139
$524,857
263
$268,411
21
$151,450
0
$0
80
$681,445
11
$118,356
FILES CLOSED FOR INCOMPLETENESS
0
$0
21
$264,322
108
$304,616
5
$23,872
0
$0
9
$401,688
2
$214,405
Aggregated Statistics For Year 2006 (Based on 2 full and 8 partial tracts)
A) FHA, FSA/RHS & VA Home Purchase Loans
B) Conventional Home Purchase Loans
C) Refinancings
D) Home Improvement Loans
F) Non-occupant Loans on < 5 Family Dwellings (A B C & D)
G) Loans On Manufactured Home Dwelling (A B C & D)
Number
Average Value
Number
Average Value
Number
Average Value
Number
Average Value
Number
Average Value
Number
Average Value
LOANS ORIGINATED
25
$210,686
2,171
$342,652
1,154
$349,055
172
$150,021
1,291
$486,607
40
$96,996
APPLICATIONS APPROVED, NOT ACCEPTED
4
$183,698
301
$318,410
180
$312,654
24
$43,970
145
$503,685
32
$66,802
APPLICATIONS DENIED
13
$92,625
325
$244,019
558
$241,429
105
$69,215
176
$409,817
119
$76,656
APPLICATIONS WITHDRAWN
9
$188,817
256
$303,126
317
$284,522
25
$298,712
147
$462,414
7
$122,366
FILES CLOSED FOR INCOMPLETENESS
0
$0
57
$392,244
122
$200,962
2
$47,645
39
$369,931
4
$186,768
Aggregated Statistics For Year 2005 (Based on 2 full and 8 partial tracts)
A) FHA, FSA/RHS & VA Home Purchase Loans
B) Conventional Home Purchase Loans
C) Refinancings
D) Home Improvement Loans
F) Non-occupant Loans on < 5 Family Dwellings (A B C & D)
G) Loans On Manufactured Home Dwelling (A B C & D)
Number
Average Value
Number
Average Value
Number
Average Value
Number
Average Value
Number
Average Value
Number
Average Value
LOANS ORIGINATED
26
$193,136
2,429
$348,532
1,511
$337,411
143
$130,971
1,670
$468,479
57
$86,975
APPLICATIONS APPROVED, NOT ACCEPTED
4
$97,938
222
$238,340
176
$237,033
23
$107,237
90
$432,785
56
$78,610
APPLICATIONS DENIED
8
$108,542
277
$212,810
604
$198,297
117
$82,837
126
$344,825
102
$81,116
APPLICATIONS WITHDRAWN
3
$177,937
283
$412,795
331
$231,653
32
$141,223
141
$586,428
11
$107,505
FILES CLOSED FOR INCOMPLETENESS
0
$0
61
$371,585
189
$216,316
8
$78,196
35
$331,747
13
$172,466
Aggregated Statistics For Year 2004 (Based on 2 full and 8 partial tracts)
A) FHA, FSA/RHS & VA Home Purchase Loans
B) Conventional Home Purchase Loans
C) Refinancings
D) Home Improvement Loans
E) Loans on Dwellings For 5+ Families
F) Non-occupant Loans on < 5 Family Dwellings (A B C & D)
G) Loans On Manufactured Home Dwelling (A B C & D)
Number
Average Value
Number
Average Value
Number
Average Value
Number
Average Value
Number
Average Value
Number
Average Value
Number
Average Value
LOANS ORIGINATED
41
$170,865
2,070
$292,331
1,215
$273,593
92
$100,778
2
$283,655
1,353
$381,529
52
$70,922
APPLICATIONS APPROVED, NOT ACCEPTED
4
$168,480
189
$287,349
208
$237,744
13
$117,209
0
$0
117
$455,400
47
$84,262
APPLICATIONS DENIED
17
$88,368
244
$231,050
545
$168,568
88
$54,934
0
$0
100
$359,956
106
$80,143
APPLICATIONS WITHDRAWN
3
$119,693
159
$346,120
302
$242,172
23
$43,187
0
$0
93
$470,514
6
$133,117
FILES CLOSED FOR INCOMPLETENESS
1
$215,920
45
$350,931
113
$201,947
6
$44,200
0
$0
19
$483,672
7
$107,187
Aggregated Statistics For Year 2003 (Based on 2 full and 8 partial tracts)
A) FHA, FSA/RHS & VA Home Purchase Loans
B) Conventional Home Purchase Loans
C) Refinancings
D) Home Improvement Loans
F) Non-occupant Loans on < 5 Family Dwellings (A B C & D)
Number
Average Value
Number
Average Value
Number
Average Value
Number
Average Value
Number
Average Value
LOANS ORIGINATED
52
$160,616
1,338
$291,321
2,983
$258,314
64
$69,312
1,666
$340,049
APPLICATIONS APPROVED, NOT ACCEPTED
1
$148,410
143
$291,800
262
$202,217
12
$87,588
110
$327,216
APPLICATIONS DENIED
2
$97,195
204
$185,630
684
$171,313
62
$41,798
136
$341,003
APPLICATIONS WITHDRAWN
5
$148,752
146
$341,600
403
$197,576
4
$26,230
139
$354,133
FILES CLOSED FOR INCOMPLETENESS
0
$0
19
$292,619
86
$207,992
3
$237,280
13
$395,848
Aggregated Statistics For Year 2002 (Based on 2 full and 6 partial tracts)
A) FHA, FSA/RHS & VA Home Purchase Loans
B) Conventional Home Purchase Loans
C) Refinancings
D) Home Improvement Loans
F) Non-occupant Loans on < 5 Family Dwellings (A B C & D)
Number
Average Value
Number
Average Value
Number
Average Value
Number
Average Value
Number
Average Value
LOANS ORIGINATED
19
$101,438
963
$318,755
1,961
$298,829
68
$59,736
1,371
$367,022
APPLICATIONS APPROVED, NOT ACCEPTED
4
$33,492
144
$433,618
216
$230,385
2
$60,035
87
$702,272
APPLICATIONS DENIED
11
$34,986
215
$105,806
417
$179,367
48
$44,576
96
$397,720
APPLICATIONS WITHDRAWN
0
$0
105
$300,906
265
$230,007
7
$13,481
112
$368,509
FILES CLOSED FOR INCOMPLETENESS
0
$0
27
$529,347
81
$313,345
2
$42,880
40
$541,110
Aggregated Statistics For Year 2001 (Based on 2 full and 6 partial tracts)
A) FHA, FSA/RHS & VA Home Purchase Loans
B) Conventional Home Purchase Loans
C) Refinancings
D) Home Improvement Loans
F) Non-occupant Loans on < 5 Family Dwellings (A B C & D)
Number
Average Value
Number
Average Value
Number
Average Value
Number
Average Value
Number
Average Value
LOANS ORIGINATED
17
$114,832
770
$369,795
1,490
$334,846
79
$109,145
1,020
$447,473
APPLICATIONS APPROVED, NOT ACCEPTED
2
$82,900
77
$173,972
169
$170,101
17
$65,898
49
$434,207
APPLICATIONS DENIED
4
$89,095
201
$72,944
436
$143,710
54
$77,283
50
$407,573
APPLICATIONS WITHDRAWN
2
$141,030
71
$327,606
237
$217,683
4
$29,268
69
$490,667
FILES CLOSED FOR INCOMPLETENESS
0
$0
15
$356,193
65
$233,118
2
$7,205
18
$342,759
Aggregated Statistics For Year 2000 (Based on 2 full and 6 partial tracts)
A) FHA, FSA/RHS & VA Home Purchase Loans
B) Conventional Home Purchase Loans
C) Refinancings
D) Home Improvement Loans
F) Non-occupant Loans on < 5 Family Dwellings (A B C & D)
Number
Average Value
Number
Average Value
Number
Average Value
Number
Average Value
Number
Average Value
LOANS ORIGINATED
25
$78,672
951
$355,441
462
$240,817
86
$38,271
679
$440,616
APPLICATIONS APPROVED, NOT ACCEPTED
11
$59,785
134
$234,520
83
$161,340
15
$26,371
49
$483,433
APPLICATIONS DENIED
18
$66,428
297
$92,603
307
$99,690
65
$23,701
49
$282,919
APPLICATIONS WITHDRAWN
9
$90,789
82
$403,033
128
$155,242
11
$24,433
53
$447,594
FILES CLOSED FOR INCOMPLETENESS
2
$80,145
29
$392,198
58
$113,545
4
$17,152
20
$486,070
Aggregated Statistics For Year 1999 (Based on 1 full and 4 partial tracts)
A) FHA, FSA/RHS & VA Home Purchase Loans
B) Conventional Home Purchase Loans
C) Refinancings
D) Home Improvement Loans
E) Loans on Dwellings For 5+ Families
F) Non-occupant Loans on < 5 Family Dwellings (A B C & D)
2002 - 2018 National Fire Incident Reporting System (NFIRS) incidents
Based on the data from the years 2002 - 2018 the average number of fire incidents per year is 132. The highest number of reported fire incidents - 223 took place in 2010, and the least - 17 in 2002. The data has an increasing trend.
When looking into fire subcategories, the most incidents belonged to: Outside Fires (49.3%), and Structure Fires (33.6%).
Fire incident types reported to NFIRS in Zip Code 29455


 Nearest zip codes: 29439, 29412, 29487, 29407, 29401, 29409.


 Based on the data from the years 2002 - 2018 the average number of fire incidents per year is 132. The highest number of reported fire incidents - 223 took place in 2010, and the least - 17 in 2002. The data has an increasing trend.
 When looking into fire subcategories, the most incidents belonged to: Outside Fires (49.3%), and Structure Fires (33.6%).