Estimated zip code population in 2022: 2,063 Zip code population in 2010: 2,029 Zip code population in 2000: 2,033
Houses and condos: 892 Renter-occupied apartments: 212
% of renters here:
27%
State:
28%
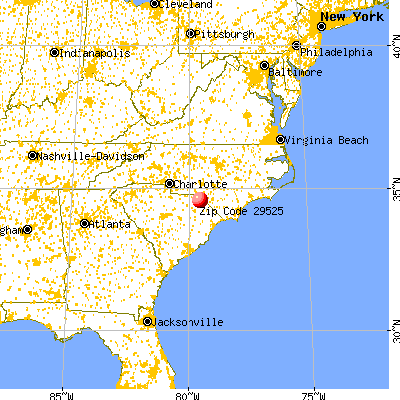
March 2022 cost of living index in zip code 29525: 78.0 (low, U.S. average is 100)
Land area: 49.8 sq. mi. Water area: 0.1 sq. mi.
Population density: 41 people per square mile
(very low).
OSM Map
General Map
Google Map
MSN Map
OSM Map
General Map
Google Map
MSN Map
OSM Map
General Map
Google Map
MSN Map
OSM Map
General Map
Google Map
MSN Map
Please wait while loading the map...
Real estate property taxes paid for housing units in 2022:
This zip code:
0.8% ($521)
South Carolina:
0.5% ($1,185)
Median real estate property taxes paid for housing units with mortgages in 2022: $500 (0.5%) Median real estate property taxes paid for housing units with no mortgage in 2022: $538 (0.9%)
Business Search- 14 Million verified businesses
Males: 985
(47.8%)
Females: 1,077
(52.2%)
For population 25 years and over in 29525:
High school or higher: 83.3%
Bachelor's degree or higher: 14.9%
Graduate or professional degree: 6.7%
Unemployed: 5.1%
Mean travel time to work (commute): 33.9 minutes
For population 15 years and over in 29525:
Never married: 40.3%
Now married: 37.8%
Separated: 3.9%
Widowed: 7.1%
Divorced: 10.8%
Zip code 29525 compared to state average:
Median household income below state average.
Median house value significantly below state average.
Black race population percentage above state average.
Median age significantly above state average.
Length of stay since moving in significantly above state average.
Percentage of population with a bachelor's degree or higher below state average.
Estimated median house/condo value in 2022: $63,356
29525:
$63,356
South Carolina:
$254,600
According to our research of South Carolina and other state lists, there were 4 registered sex offenders living in 29525 zip code as of May 28, 2024. The ratio of all residents to sex offenders in zip code 29525 is 511 to 1.
Median resident age:
This zip code:
50.2 years
South Carolina median age:
40.5 years
Average household size:
This zip code:
2.7 people
South Carolina:
2.4 people
Averages for the 2020 tax year for zip code 29525, filed in 2021:
Average Adjusted Gross Income (AGI) in 2020: $34,455 (Individual Income Tax Returns)
Here:
$34,455
State:
$65,754
Salary/wage: $29,663 (reported on 87.4% of returns)
Here:
$29,663
State:
$52,566
(% of AGI for various income ranges: 1305.3% for AGIs below $25k, 3888.1% for AGIs $25k-50k, 7141.7% for AGIs $50k-75k, 6365.0% for AGIs $75k-100k)
Taxable interest for individuals: $267 (reported on 10.3% of returns)
This zip code:
$267
South Carolina:
$1,749
(% of AGI for various income ranges: 1.5% for AGIs below $25k, 4.3% for AGIs $25k-50k, 25.0% for AGIs $75k-100k)
Ordinary dividends: $2,725 (reported on 4.6% of returns)
Here:
$2,725
State:
$8,783
(% of AGI for various income ranges: 51.9% for AGIs $25k-50k)
Net capital gain/loss in AGI: +$1,600 (reported on 4.6% of returns)
Here:
+$1,600
State:
+$24,194
(% of AGI for various income ranges: 30.5% for AGIs $25k-50k)
Profit/loss from business: +$2,250 (reported on 9.2% of returns)
Here:
+$2,250
State:
+$11,253
(% of AGI for various income ranges: 27.1% for AGIs below $25k, 146.7% for AGIs $50k-75k)
Taxable individual retirement arrangement distribution: $5,600 (reported on 4.6% of returns)
29525:
$5,600
South Carolina:
$21,604
(% of AGI for various income ranges: 106.7% for AGIs $25k-50k)
Earned income credit: $2,639 (reported on 35.6% of returns)
Here:
$2,639
State:
$2,397
(% of AGI for various income ranges: 169.7% for AGIs below $25k, 114.8% for AGIs $25k-50k)
Percentage of individuals using paid preparers for their 2020 taxes: 92.0%
Here:
92%
State:
93%
(% for various income ranges: 92.9% for AGIs below $25k, 89.3% for AGIs $25k-50k, 88.9% for AGIs $50k-75k, 100.0% for AGIs $75k-100k, 100.0% for AGIs $100k-200k)
Averages for the 2012 tax year for zip code 29525, filed in 2013:
Average Adjusted Gross Income (AGI) in 2012: $28,791 (Individual Income Tax Returns)
Here:
$28,791
State:
$51,133
Salary/wage: $24,550 (reported on 87.6% of returns)
Here:
$24,550
State:
$42,173
(% of AGI for various income ranges: 85.6% for AGIs below $25k, 87.0% for AGIs $25k-50k, 78.1% for AGIs $50k-75k, 59.7% for AGIs $75k-100k, 37.4% for AGIs $100k-200k)
Taxable interest for individuals: $780 (reported on 11.2% of returns)
This zip code:
$780
South Carolina:
$1,468
(% of AGI for various income ranges: 0.2% for AGIs below $25k, 0.1% for AGIs $25k-50k, 0.4% for AGIs $50k-75k, 1.7% for AGIs $75k-100k)
Ordinary dividends: $2,980 (reported on 5.6% of returns)
Here:
$2,980
State:
$6,511
Net capital gain/loss in AGI: +$5,600 (reported on 3.4% of returns)
Here:
+$5,600
State:
+$13,061
Profit/loss from business: +$4,650 (reported on 9.0% of returns)
Here:
+$4,650
State:
+$10,167
Taxable individual retirement arrangement distribution: $12,525 (reported on 4.5% of returns)
29525:
$12,525
South Carolina:
$17,019
Total itemized deductions: $17,156 (23% of AGI, reported on 10.1% of returns)
Here:
$17,156
State:
$22,890
Here:
23.2% of AGI
State:
21.4% of AGI
(% of AGI for various income ranges: 7.3% for AGIs $25k-50k, 12.1% for AGIs $50k-75k, 10.8% for AGIs $100k-200k)
Charity contributions: $4,888 (reported on 9.0% of returns)
Here:
$4,888
State:
$5,169
(% of AGI for various income ranges: 1.6% for AGIs below $25k, 2.8% for AGIs $50k-75k, 3.8% for AGIs $100k-200k)
Taxes paid: $4,678 (reported on 10.1% of returns)
29525:
$4,678
State:
$7,644
(% of AGI for various income ranges: 1.4% for AGIs $25k-50k, 3.1% for AGIs $50k-75k, 4.4% for AGIs $100k-200k)
Earned income credit: $2,570 (reported on 48.3% of returns)
Here:
$2,570
State:
$2,418
(% of AGI for various income ranges: 13.3% for AGIs below $25k, 2.1% for AGIs $25k-50k)
Percentage of individuals using paid preparers for their 2012 taxes: 53.9%
Here:
54%
State:
57%
(% for various income ranges: 50.9% for AGIs below $25k, 56.5% for AGIs $25k-50k, 42.9% for AGIs $50k-75k, 66.7% for AGIs $75k-100k, 100.0% for AGIs $100k-200k)
Averages for the 2004 tax year for zip code 29525, filed in 2005:
Average Adjusted Gross Income (AGI) in 2004: $25,905 (Individual Income Tax Returns)
Here:
$25,905
State:
$41,965
Salary/wage: $23,531 (reported on 91.5% of returns)
Here:
$23,531
State:
$35,695
(% of AGI for various income ranges: 106.4% for AGIs below $10k, 89.0% for AGIs $10k-25k, 89.7% for AGIs $25k-50k, 78.4% for AGIs $50k-75k, 72.6% for AGIs $75k-100k, 57.1% for AGIs over 100k)
Taxable interest for individuals: $951 (reported on 14.0% of returns)
This zip code:
$951
South Carolina:
$1,623
(% of AGI for various income ranges: 0.9% for AGIs $10k-25k, 0.5% for AGIs $25k-50k, 0.2% for AGIs $50k-75k, 0.5% for AGIs $75k-100k, 0.2% for AGIs over 100k)
Taxable dividends: $2,698 (reported on 5.2% of returns)
Here:
$2,698
State:
$3,999
Net capital gain/loss: +$500 (reported on 3.7% of returns)
Here:
+$500
State:
+$13,100
Profit/loss from business: +$667 (reported on 6.2% of returns)
Here:
+$667
State:
+$9,144
(% of AGI for various income ranges: 3.7% for AGIs below $10k, 0.7% for AGIs $10k-25k, 0.1% for AGIs $25k-50k, -1.4% for AGIs $50k-75k)
Total itemized deductions: $16,164 (30% of AGI, reported on 12.5% of returns)
Here:
$16,164
State:
$19,039
Here:
29.6% of AGI
State:
22.8% of AGI
(% of AGI for various income ranges: 3.8% for AGIs $10k-25k, 9.4% for AGIs $25k-50k, 7.0% for AGIs $50k-75k, 14.9% for AGIs $75k-100k, 10.9% for AGIs over 100k)
Charity contributions deductions: $3,831 (7% of AGI, reported on 11.6% of returns)
Here:
$3,831
State:
$4,305
Here:
7.0% of AGI
State:
5.0% of AGI
(% of AGI for various income ranges: 0.6% for AGIs $10k-25k, 2.0% for AGIs $25k-50k, 2.6% for AGIs $50k-75k, 3.0% for AGIs $75k-100k, 2.0% for AGIs over 100k)
Total tax: $3,208 (reported on 50.4% of returns)
29525:
$3,208
State:
$6,497
(% of AGI for various income ranges: 0.9% for AGIs below $10k, 1.8% for AGIs $10k-25k, 4.9% for AGIs $25k-50k, 9.2% for AGIs $50k-75k, 10.5% for AGIs $75k-100k, 15.9% for AGIs over 100k)
Earned income credit: $2,033 (reported on 47.8% of returns)
Here:
$2,033
State:
$1,882
Percentage of individuals using paid preparers for their 2004 taxes: 69.6%
Here:
70%
State:
66%
(% for various income ranges: 62.5% for AGIs below $10k, 72.2% for AGIs $10k-25k, 72.8% for AGIs $25k-50k, 67.8% for AGIs $50k-75k, 53.1% for AGIs $75k-100k, 76.2% for AGIs over 100k)
Household received Food Stamps/SNAP in the past 12 months: 186 Household did not receive Food Stamps/SNAP in the past 12 months: 590
Women who had a birth in the past 12 months: 10 (0 now married, 9 unmarried) Women who did not have a birth in the past 12 months: 455 (152 now married, 301 unmarried)
Housing units in zip code 29525 with a mortgage: 139 (1 second mortgage, 1 both second mortgage and home equity loan) Median monthly owner costs for units with a mortgage: $900 Median monthly owner costs for units without a mortgage: $364
Residents with income below the poverty level in 2022:
This zip code:
28.7%
Whole state:
14.0%
Residents with income below 50% of the poverty level in 2022:
This zip code:
20.1%
Whole state:
7.3%
Median number of rooms in houses and condos:
Here:
6.1
State:
6.4
Median number of rooms in apartments:
Here:
5.0
State:
4.5
Notable locations in this zip code not listed on our city pages
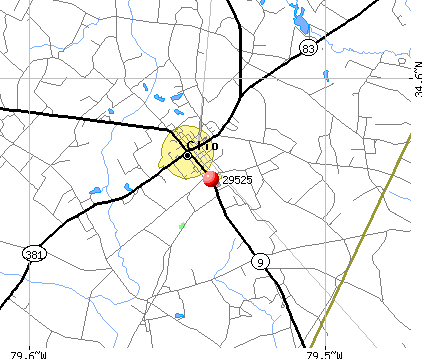
Notable locations in zip code 29525: Clio Rural Fire Department Clio (A), Clio Rural Fire Department Eastside (B), Clio City Hall (C). Display/hide their locations on the map
Churches in zip code 29525 include: Old Clio Church (A), Mount Tabor Church (B), Ebenezer Church (C), Hebron Church (D), Asbury Church (E), Mount Elohim Church (F), Zion Church (G), Oak Grove Church (H), Trinity Church (I). Display/hide their locations on the map
Size of family households: 278 2-persons, 52 3-persons, 16 4-persons, 71 5-persons, 4 6-persons
Size of nonfamily households: 311 1-person, 37 2-persons, 2 4-persons
78 married couples with children.
99 single-parent households (99 women).
90.9% of residents of 29525 zip code speak English at home.
9.2% of residents speak Spanish at home (96% very well, 4% well).
0.5% of residents speak other Indo-European language at home (100% very well).
Foreign born population: 150 (7.3%) (100.0% of them are naturalized citizens)
This zip code:
7.3%
Whole state:
5.2%
86%Guatemala
6%Congo
3%English
3%Irish
2%Scottish
2%American
1%Scotch-Irish
1%German
0%Greek
Year of entry for the foreign-born population
02010 or later
1352000 to 2009
01990 to 1999
24Before 1990
Facilities with environmental interests located in this zip code:
DODGE ROCKWELL AUTOMATION (2660 HIGHWAY 9 EAST in CLIO, SC)
AIR MINOR (AIRS/AFS) CRITERIA AND HAZARDOUS AIR POLLUTANT INVENTORY (Inventory of air pollution sources) Conditionally Exempt Small Quantity Generators, less than 100 kg/month of hazardous waste (Resource Conservation and Recovery Act (tracking hazardous waste)) - notification STATE MASTER (South Carolina database) - AIR PROGRAM, HAZARDOUS WASTE PROGRAM, Business SIC classification: CONVEYORS AND CONVEYING EQUIPMENT Business NAICS classification: CONVEYOR AND CONVEYING EQUIPMENT MANUFACTURING. Organizations: SCHLOSS & ASSOCIATES PLLC (CONTACT/ENGINEERING/CONSULTING FIRM)
Alternative names: DODGE ROCKWELL AUTOMATION - CLIO
CLIO ELEMENTARY SCHOOL (200 JEFFERSON ST in CLIO, SC)
(Resource Conservation and Recovery Act (tracking hazardous waste)) STATE MASTER (South Carolina database) - HAZARDOUS WASTE PROGRAM Organizations: MARLBORO COUNTY BOARD OF ED (CONTACT/OWNER)
CLIO WWTF (TOWN OF CLIO-PO BOX 487 in CLIO, SC)
National Pollutant Discharge Elimination System NON-MAJOR (Tracking pollutant discharge elimination systems) - permit STATE MASTER (South Carolina database) - National Pollutant Discharge Elimination System Permit, DRINKING WATER PROGRAM Business SIC classification: SEWERAGE SYSTEMS
CLIO ELEM\MIDDLE SCHOOL (2635 HIGHWAY 9 EAST in CLIO, SC)
(National Center for Education Statistics) - STATE ID-3501023 Organizations: MARLBORO COUNTY SCHOOL DISTRICT (SCHOOL DISTRICT)
BOROWOOD:COMPONENTS - CLOSED (HWY #9 SOUTH in CLIO, SC)
AIR MINOR (AIRS/AFS) Business SIC classification: HARDWARE
Housing units lacking complete plumbing facilities: 2.4% Housing units lacking complete kitchen facilities: 6.0%
80.5%Electricity
9.3%Fuel oil, kerosene, etc.
8.8%Bottled, tank, or LP gas
1.4%Wood
Population in 1990: 2,870.
Place of birth for U.S.-born residents:
This state: 1,572
Northeast: 5
Midwest: 27
South: 231
West: 32
69% of the 29525 zip code residents lived in the same house 5 years ago. Out of people who lived in different houses, 77% lived in this county. Out of people who lived in different counties, 50% lived in South Carolina.
97% of the 29525 zip code residents lived in the same house 1 year ago. Out of people who lived in different houses, 10% moved from this county. Out of people who lived in different houses, 45% moved from different county within same state. Out of people who lived in different houses, 52% moved from different state.
Private vs. public school enrollment:
Students in private schools in grades 1 to 8 (elementary and middle school):
Here:
0.0%
South Carolina:
14.4%
Students in private schools in grades 9 to 12 (high school): 9
Here:
8.3%
South Carolina:
11.1%
Students in private undergraduate colleges:
Here:
0.0%
South Carolina:
21.9%
Occupation by median earnings in the past 12 months ($)
65,577Health diagnosing and treating practitioners and other technical occupations
60,026Community and social service occupations
54,034Production occupations
34,306Office and administrative support occupations
24,456Healthcare support occupations
17,887Material moving occupations
Top industries in this zip code by the number of employees in 2005:
Wholesale Trade: Farm and Garden Machinery and Equipment Merchant Wholesalers (10-19 employees: 1 establishment)
Other Services (except Public Administration): Religious Organizations (1-4: 3)
Health Care and Social Assistance: Offices of Physicians (except Mental Health Specialists) (1-4: 1)
Administrative and Support and Waste Management and Remediation Services: Janitorial Services (1-4: 1)
Finance and Insurance: Insurance Agencies and Brokerages (1-4: 1)
Fatal accident statistics in 2014:
Fatal accident count: 1
Vehicles involved in fatal accidents: 1
Fatal accidents caused by drunken drivers: 0
Fatalities: 1
Persons involved in fatal accidents: 2
Pedestrians involved in fatal accidents: 0
Fatal accident statistics in 2011:
Fatal accident count: 1
Vehicles involved in fatal accidents: 1
Fatal accidents caused by drunken drivers: 1
Fatalities: 1
Persons involved in fatal accidents: 1
Pedestrians involved in fatal accidents: 0
2003 - 2018 National Fire Incident Reporting System (NFIRS) incidents
According to the data from the years 2003 - 2018 the average number of fire incidents per year is 27. The highest number of fire incidents - 62 took place in 2007, and the least - 1 in 2006. The data has a growing trend.
When looking into fire subcategories, the most incidents belonged to: Outside Fires (55.4%), and Structure Fires (31.8%).
Fire incident types reported to NFIRS in Zip Code 29525


 Nearest zip codes: 29594, 29567, 29570, 29516, 29512, 29565.


 According to the data from the years 2003 - 2018 the average number of fire incidents per year is 27. The highest number of fire incidents - 62 took place in 2007, and the least - 1 in 2006. The data has a growing trend.
 When looking into fire subcategories, the most incidents belonged to: Outside Fires (55.4%), and Structure Fires (31.8%).