Estimated zip code population in 2022: 3,779 Zip code population in 2010: 3,677 Zip code population in 2000: 3,179
Houses and condos: 1,209 Renter-occupied apartments: 147
% of renters here:
15%
State:
28%
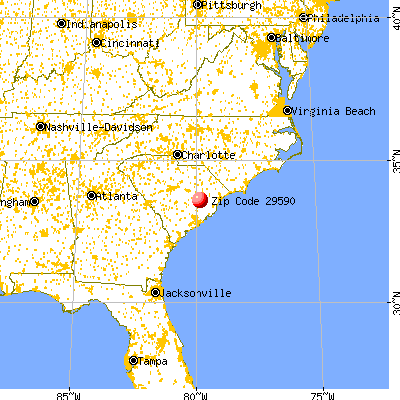
March 2022 cost of living index in zip code 29590: 79.0 (low, U.S. average is 100)
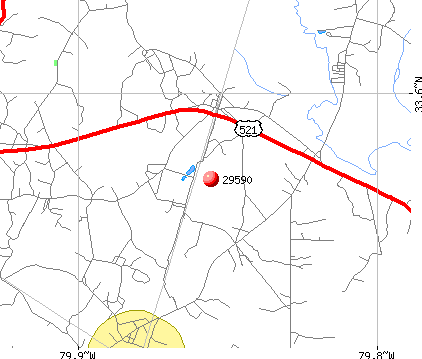
Land area: 99.3 sq. mi. Water area: 0.1 sq. mi.
Population density: 38 people per square mile
(very low).
OSM Map
General Map
Google Map
MSN Map
OSM Map
General Map
Google Map
MSN Map
OSM Map
General Map
Google Map
MSN Map
OSM Map
General Map
Google Map
MSN Map
Please wait while loading the map...
Real estate property taxes paid for housing units in 2022:
This zip code:
0.8% ($514)
South Carolina:
0.5% ($1,185)
Median real estate property taxes paid for housing units with mortgages in 2022: $921 (1.0%) Median real estate property taxes paid for housing units with no mortgage in 2022: $387 (0.6%)
Business Search- 14 Million verified businesses
Males: 2,133
(56.5%)
Females: 1,643
(43.5%)
For population 25 years and over in 29590:
High school or higher: 81.0%
Bachelor's degree or higher: 12.8%
Graduate or professional degree: 6.8%
Unemployed: 3.4%
Mean travel time to work (commute): 40.2 minutes
For population 15 years and over in 29590:
Never married: 50.2%
Now married: 23.8%
Separated: 7.7%
Widowed: 5.6%
Divorced: 12.6%
Zip code 29590 compared to state average:
Median household income below state average.
Median house value significantly below state average.
Black race population percentage significantly above state average.
Renting percentage below state average.
Length of stay since moving in significantly above state average.
Percentage of population with a bachelor's degree or higher significantly below state average.
Estimated median house/condo value in 2022: $68,419
29590:
$68,419
South Carolina:
$254,600
According to our research of South Carolina and other state lists, there were 7 registered sex offenders living in 29590 zip code as of June 08, 2024. The ratio of all residents to sex offenders in zip code 29590 is 543 to 1.
Median resident age:
This zip code:
40.2 years
South Carolina median age:
40.5 years
Average household size:
This zip code:
2.7 people
South Carolina:
2.4 people
Averages for the 2020 tax year for zip code 29590, filed in 2021:
Average Adjusted Gross Income (AGI) in 2020: $30,309 (Individual Income Tax Returns)
Here:
$30,309
State:
$65,754
Salary/wage: $29,472 (reported on 79.4% of returns)
Here:
$29,472
State:
$52,566
(% of AGI for various income ranges: 1251.0% for AGIs below $25k, 4145.2% for AGIs $25k-50k, 6651.4% for AGIs $50k-75k, 17745.0% for AGIs $100k-200k)
Taxable interest for individuals: $194 (reported on 15.7% of returns)
This zip code:
$194
South Carolina:
$1,749
(% of AGI for various income ranges: 3.5% for AGIs below $25k, 3.3% for AGIs $25k-50k)
Ordinary dividends: $650 (reported on 3.9% of returns)
Here:
$650
State:
$8,783
(% of AGI for various income ranges: 37.1% for AGIs $50k-75k)
Net capital gain/loss in AGI: +$1,875 (reported on 3.9% of returns)
Here:
+$1,875
State:
+$24,194
(% of AGI for various income ranges: 35.7% for AGIs $25k-50k)
Profit/loss from business: +$2,308 (reported on 12.7% of returns)
Here:
+$2,308
State:
+$11,253
(% of AGI for various income ranges: 55.8% for AGIs below $25k, 36.7% for AGIs $25k-50k)
Taxable individual retirement arrangement distribution: $11,467 (reported on 2.9% of returns)
29590:
$11,467
South Carolina:
$21,604
(% of AGI for various income ranges: 86.0% for AGIs below $25k)
Total itemized deductions: $26,967 (reported on 2.9% of returns)
Here:
$26,967
State:
$35,199
(% of AGI for various income ranges: 1155.7% for AGIs $50k-75k)
Taxes paid: $4,667 (reported on 2.9% of returns)
29590:
$4,667
State:
$7,486
(% of AGI for various income ranges: 200.0% for AGIs $50k-75k)
Earned income credit: $2,532 (reported on 33.3% of returns)
Here:
$2,532
State:
$2,397
(% of AGI for various income ranges: 164.0% for AGIs below $25k, 97.6% for AGIs $25k-50k)
Percentage of individuals using paid preparers for their 2020 taxes: 89.2%
Here:
89%
State:
93%
(% for various income ranges: 85.7% for AGIs below $25k, 93.1% for AGIs $25k-50k, 88.9% for AGIs $50k-75k, 100.0% for AGIs $75k-100k, 100.0% for AGIs $100k-200k)
Averages for the 2012 tax year for zip code 29590, filed in 2013:
Average Adjusted Gross Income (AGI) in 2012: $25,531 (Individual Income Tax Returns)
Here:
$25,531
State:
$51,133
Salary/wage: $23,311 (reported on 86.5% of returns)
Here:
$23,311
State:
$42,173
(% of AGI for various income ranges: 80.1% for AGIs below $25k, 78.9% for AGIs $25k-50k, 76.3% for AGIs $50k-75k, 79.6% for AGIs $75k-100k)
Taxable interest for individuals: $836 (reported on 11.5% of returns)
This zip code:
$836
South Carolina:
$1,468
(% of AGI for various income ranges: 0.3% for AGIs below $25k, 0.7% for AGIs $25k-50k, 0.2% for AGIs $50k-75k)
Ordinary dividends: $433 (reported on 3.1% of returns)
Here:
$433
State:
$6,511
Net capital gain/loss in AGI: +$850 (reported on 2.1% of returns)
Here:
+$850
State:
+$13,061
Profit/loss from business: +$5,609 (reported on 11.5% of returns)
Here:
+$5,609
State:
+$10,167
Taxable individual retirement arrangement distribution: $5,800 (reported on 3.1% of returns)
29590:
$5,800
South Carolina:
$17,019
Total itemized deductions: $15,400 (29% of AGI, reported on 12.5% of returns)
Here:
$15,400
State:
$22,890
Here:
29.5% of AGI
State:
21.4% of AGI
(% of AGI for various income ranges: 4.3% for AGIs below $25k, 6.1% for AGIs $25k-50k, 11.0% for AGIs $50k-75k, 12.9% for AGIs $75k-100k)
Charity contributions: $4,170 (reported on 10.4% of returns)
Here:
$4,170
State:
$5,169
(% of AGI for various income ranges: 0.8% for AGIs below $25k, 1.3% for AGIs $25k-50k, 2.5% for AGIs $50k-75k, 3.4% for AGIs $75k-100k)
Taxes paid: $3,867 (reported on 12.5% of returns)
29590:
$3,867
State:
$7,644
(% of AGI for various income ranges: 0.6% for AGIs below $25k, 1.0% for AGIs $25k-50k, 2.9% for AGIs $50k-75k, 5.1% for AGIs $75k-100k)
Earned income credit: $2,600 (reported on 44.8% of returns)
Here:
$2,600
State:
$2,418
(% of AGI for various income ranges: 12.4% for AGIs below $25k, 1.5% for AGIs $25k-50k)
Percentage of individuals using paid preparers for their 2012 taxes: 68.8%
Here:
69%
State:
57%
(% for various income ranges: 67.2% for AGIs below $25k, 65.2% for AGIs $25k-50k, 75.0% for AGIs $50k-75k, 100.0% for AGIs $75k-100k)
Averages for the 2004 tax year for zip code 29590, filed in 2005:
Average Adjusted Gross Income (AGI) in 2004: $21,071 (Individual Income Tax Returns)
Here:
$21,071
State:
$41,965
Salary/wage: $20,440 (reported on 89.6% of returns)
Here:
$20,440
State:
$35,695
(% of AGI for various income ranges: 90.6% for AGIs below $10k, 86.6% for AGIs $10k-25k, 89.3% for AGIs $25k-50k, 87.2% for AGIs $50k-75k, 75.1% for AGIs $75k-100k)
Taxable interest for individuals: $667 (reported on 13.7% of returns)
This zip code:
$667
South Carolina:
$1,623
(% of AGI for various income ranges: 1.5% for AGIs below $10k, 0.5% for AGIs $10k-25k, 0.4% for AGIs $25k-50k, 0.2% for AGIs $50k-75k, 0.2% for AGIs $75k-100k)
Taxable dividends: $571 (reported on 2.8% of returns)
Here:
$571
State:
$3,999
Net capital gain/loss: +$1,938 (reported on 1.6% of returns)
Here:
+$1,938
State:
+$13,100
Profit/loss from business: +$4,919 (reported on 7.3% of returns)
Here:
+$4,919
State:
+$9,144
Total itemized deductions: $13,944 (32% of AGI, reported on 12.5% of returns)
Here:
$13,944
State:
$19,039
Here:
32.0% of AGI
State:
22.8% of AGI
(% of AGI for various income ranges: 4.6% for AGIs $10k-25k, 11.1% for AGIs $25k-50k, 12.0% for AGIs $50k-75k, 8.7% for AGIs $75k-100k)
Charity contributions deductions: $3,350 (8% of AGI, reported on 11.9% of returns)
Here:
$3,350
State:
$4,305
Here:
7.8% of AGI
State:
5.0% of AGI
(% of AGI for various income ranges: 1.2% for AGIs $10k-25k, 2.4% for AGIs $25k-50k, 2.8% for AGIs $50k-75k, 2.2% for AGIs $75k-100k)
Total tax: $2,318 (reported on 46.6% of returns)
29590:
$2,318
State:
$6,497
(% of AGI for various income ranges: 1.3% for AGIs below $10k, 2.1% for AGIs $10k-25k, 4.9% for AGIs $25k-50k, 8.3% for AGIs $50k-75k, 12.8% for AGIs $75k-100k)
Earned income credit: $2,018 (reported on 48.8% of returns)
Here:
$2,018
State:
$1,882
Percentage of individuals using paid preparers for their 2004 taxes: 76.7%
Here:
77%
State:
66%
(% for various income ranges: 71.7% for AGIs below $10k, 78.4% for AGIs $10k-25k, 81.4% for AGIs $25k-50k, 74.5% for AGIs $50k-75k, 72.2% for AGIs $75k-100k)
Household received Food Stamps/SNAP in the past 12 months: 121 Household did not receive Food Stamps/SNAP in the past 12 months: 864
Women who had a birth in the past 12 months: 77 (31 now married, 43 unmarried) Women who did not have a birth in the past 12 months: 874 (147 now married, 719 unmarried)
Housing units in zip code 29590 with a mortgage: 248 Houses without a mortgage: 75
Median monthly owner costs for units with a mortgage: $1,082 Median monthly owner costs for units without a mortgage: $335
Residents with income below the poverty level in 2022:
This zip code:
32.8%
Whole state:
14.0%
Residents with income below 50% of the poverty level in 2022:
This zip code:
18.5%
Whole state:
7.3%
Median number of rooms in houses and condos:
Here:
6.0
State:
6.4
Median number of rooms in apartments:
Here:
6.7
State:
4.5
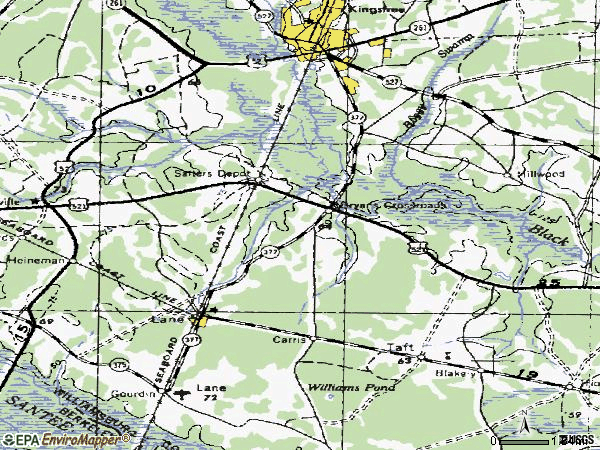
Notable locations in this zip code not listed on our city pages
Notable locations in zip code 29590: Long Lands Plantation (A), Scott Woods Plantation (B), Federal Correctional Institution at Williamsburg (C), Williamsburg County Fire Department Trio (D), Williamsburg County Fire Department Salters (E). Display/hide their locations on the map
Churches in zip code 29590 include: Randy Grove Church (A), Saint Lukes Church (B), Saint Mark Church (C), Saint Rest Church (D), Union Church (E), Trio Methodist Episcopal Church South (F), Salters Methodist Church (G), Saint Matthews Church (H), Oak Grove Church (I). Display/hide their locations on the map
Reservoirs and swamps: Webber Pond (A), W S McCollough Junior Pond (B), Parsons Pond (C), Cypress Pond (D), Spring Valley Swamp (E). Display/hide their locations on the map
Streams, rivers, and creeks: Chaney Swamp (A), Shanty Branch (B), Pushing Branch (C), Rocky Ford Swamp (D), Mulberry Branch (E), Mill Branch (F), Stony Run Branch (G), Gumtree Branch (H), Boggy Swamp (I). Display/hide their locations on the map
In group quarters: 1,141 (-1 institutionalized population)
Size of family households: 223 2-persons, 236 3-persons, 142 4-persons, 26 5-persons, 5 6-persons
Size of nonfamily households: 322 1-person, 12 2-persons, 7 5-persons
79 married couples with children.
34 single-parent households (28 men, 6 women).
92.7% of residents of 29590 zip code speak English at home.
5.0% of residents speak Spanish at home (28% very well, 24% well, 36% not well, 12% not at all).
0.6% of residents speak Asian or Pacific Island language at home (55% very well, 45% well).
0.5% of residents speak other language at home (100% very well).
Foreign born population: 162 (4.3%) (10.8% of them are naturalized citizens)
This zip code:
4.3%
Whole state:
5.2%
55%Honduras
12%Dominica
7%Costa Rica
6%Chile
5%Thailand
2%Haiti
3%English
3%French Canadian
0%Irish
0%Scottish
0%African
Year of entry for the foreign-born population
802010 or later
772000 to 2009
761990 to 1999
26Before 1990
Facilities with environmental interests located in this zip code:
AIR MINOR (AIRS/AFS) STATE MASTER (South Carolina database) - AIR PROGRAM STATE MASTER (South Carolina database) - AIR PROGRAM, Business SIC classification: SAWMILLS AND PLANING MILLS, GENERAL; SCRAP AND WASTE MATERIALS Organizations: PEDCON INC (CONTACT/ENGINEERING/CONSULTING FIRM)
Alternative names: FRANKLINS INDUSTRIAL RECYCLING INC - PORTABLE, FRANKLINS INDUSTRIAL RECYCLING INC - SALTERS
D P COOPER ELEMENTARY (ROUTE #2 BOX 235 in SALTERS, SC)
(National Center for Education Statistics) - STATE ID-4501011 Organizations: WILLIAMSBURG COUNTY SCHOOL DISTRICT (SCHOOL DISTRICT)
National Pollutant Discharge Elimination System NON-MAJOR (Tracking pollutant discharge elimination systems) - permit Business SIC classification: MISCELLANEOUS NONMETALLIC MINERALS, EXCEPT FUELS
Housing units lacking complete plumbing facilities: 2.2% Housing units lacking complete kitchen facilities: 2.1%
84.8%Electricity
14.4%Bottled, tank, or LP gas
1.0%No fuel used
Population in 1990: 1,932. Population change in the 1990s: +1,247 (+64.5%).
Place of birth for U.S.-born residents:
This state: 2,399
Northeast: 151
Midwest: 269
South: 611
West: 48
85% of the 29590 zip code residents lived in the same house 5 years ago. Out of people who lived in different houses, 76% lived in this county. Out of people who lived in different counties, 50% lived in South Carolina.
82% of the 29590 zip code residents lived in the same house 1 year ago. Out of people who lived in different houses, 19% moved from this county. Out of people who lived in different houses, 76% moved from different county within same state. Out of people who lived in different houses, 7% moved from different state.
Private vs. public school enrollment:
Students in private schools in grades 1 to 8 (elementary and middle school):
Here:
0.0%
South Carolina:
14.4%
Students in private schools in grades 9 to 12 (high school): 44
Here:
31.9%
South Carolina:
11.1%
Students in private undergraduate colleges: 95
Here:
26.8%
South Carolina:
21.9%
Occupation by median earnings in the past 12 months ($)
63,919Management occupations
33,775Food preparation and serving related occupations
23,605Office and administrative support occupations
11,705Production occupations
6,423Transportation occupations
5,206Building and grounds cleaning and maintenance occupations
Companies with federal contracts located in this zip code:
HADDOCK FLYING SERVICE INC (RT 1 BOX 76B in SALTERS, SC; small business)
$31,990 with U.S. Army Corps of Engineers - civil program financing only for Other Natural Resources and Conservation Services. Signed on 2000-09-13. Completion date: 2000-09-18.
Top industries in this zip code by the number of employees in 2005:
3 people in emergency and transitional shelters (with sleeping facilities) for people experiencing homelessness
Fatal accident statistics in 2014:
Fatal accident count: 2
Vehicles involved in fatal accidents: 3
Fatal accidents caused by drunken drivers: 0
Fatalities: 2
Persons involved in fatal accidents: 5
Pedestrians involved in fatal accidents: 1
Fatal accident statistics in 2013:
Fatal accident count: 1
Vehicles involved in fatal accidents: 2
Fatal accidents caused by drunken drivers: 0
Fatalities: 1
Persons involved in fatal accidents: 3
Pedestrians involved in fatal accidents: 0
2009 - 2018 National Fire Incident Reporting System (NFIRS) incidents
According to the data from the years 2009 - 2018 the average number of fire incidents per year is 39. The highest number of fires - 105 took place in 2011, and the least - 0 in 2012. The data has an increasing trend.
When looking into fire subcategories, the most reports belonged to: Outside Fires (61.4%), and Structure Fires (22.1%).
Fire incident types reported to NFIRS in Zip Code 29590


 Nearest zip codes: 29564, 29556, 29056, 29479, 29518, 29468.


 According to the data from the years 2009 - 2018 the average number of fire incidents per year is 39. The highest number of fires - 105 took place in 2011, and the least - 0 in 2012. The data has an increasing trend.
 When looking into fire subcategories, the most reports belonged to: Outside Fires (61.4%), and Structure Fires (22.1%).