Estimated zip code population in 2022: 40,229 Zip code population in 2010: 35,151 Zip code population in 2000: 31,249
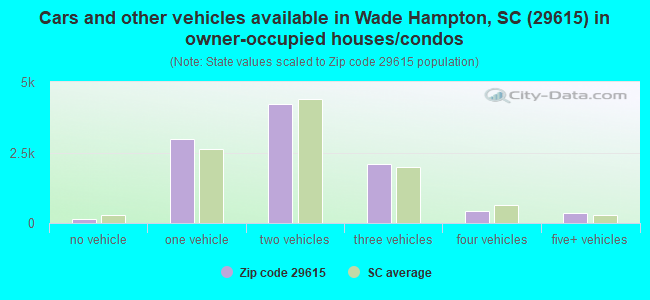
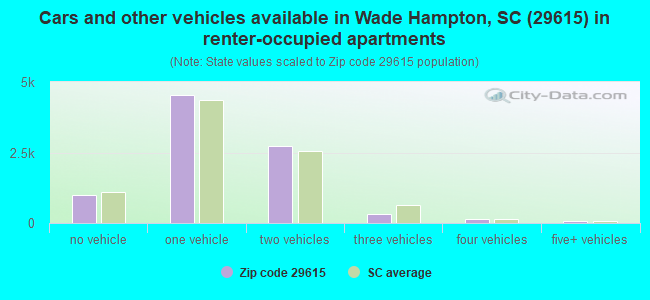
Houses and condos: 20,354 Renter-occupied apartments: 8,760
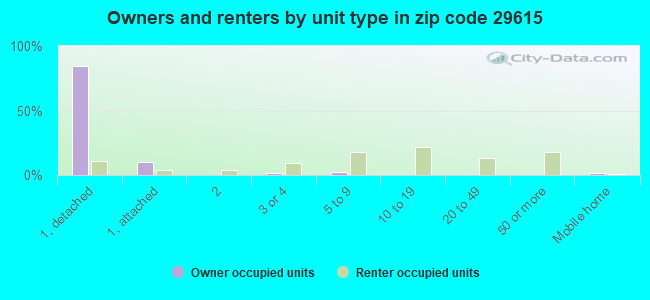
% of renters here:
46%
State:
28%
March 2022 cost of living index in zip code 29615: 87.8 (less than average, U.S. average is 100)
Land area: 19.2 sq. mi. Water area: 0.2 sq. mi.
Population density: 2,097 people per square mile
(low).
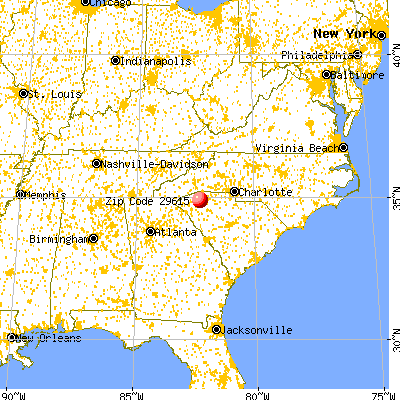
OSM Map
General Map
Google Map
MSN Map
OSM Map
General Map
Google Map
MSN Map
OSM Map
General Map
Google Map
MSN Map
OSM Map
General Map
Google Map
MSN Map
Please wait while loading the map...
Real estate property taxes paid for housing units in 2022:
This zip code:
0.5% ($1,706)
South Carolina:
0.5% ($1,185)
Median real estate property taxes paid for housing units with mortgages in 2022: $1,788 (0.5%) Median real estate property taxes paid for housing units with no mortgage in 2022: $1,572 (0.5%)
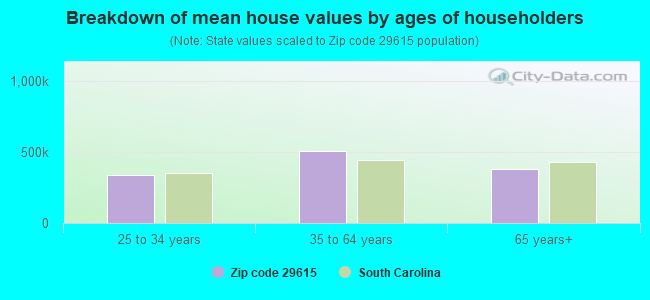
Estimated median house/condo value in 2022: $369,771
29615:
$369,771
South Carolina:
$254,600
According to our research of South Carolina and other state lists, there were 3 registered sex offenders living in 29615 zip code as of May 19, 2024. The ratio of all residents to sex offenders in zip code 29615 is 12,186 to 1. The ratio of registered sex offenders to all residents in this zip code is much lower than the state average.
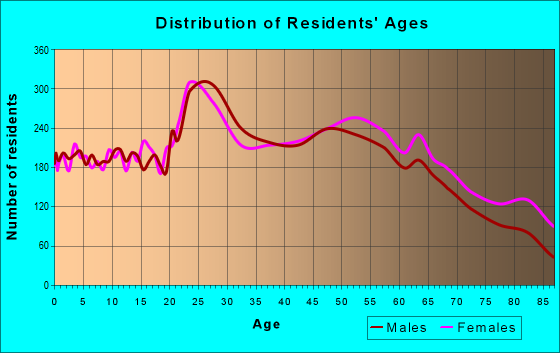
Median resident age:
This zip code:
40.2 years
South Carolina median age:
40.5 years
Average household size:
This zip code:
2.1 people
South Carolina:
2.4 people
Averages for the 2020 tax year for zip code 29615, filed in 2021:
Average Adjusted Gross Income (AGI) in 2020: $87,211 (Individual Income Tax Returns)
Here:
$87,211
State:
$65,754
Salary/wage: $66,004 (reported on 78.4% of returns)
Here:
$66,004
State:
$52,566
(% of AGI for various income ranges: 1266.4% for AGIs below $25k, 3974.3% for AGIs $25k-50k, 6801.4% for AGIs $50k-75k, 9795.4% for AGIs $75k-100k, 18118.7% for AGIs $100k-200k, 83759.5% for AGIs over 200k)
Taxable interest for individuals: $2,463 (reported on 33.1% of returns)
This zip code:
$2,463
South Carolina:
$1,749
(% of AGI for various income ranges: 18.4% for AGIs below $25k, 28.6% for AGIs $25k-50k, 83.7% for AGIs $50k-75k, 122.8% for AGIs $75k-100k, 256.7% for AGIs $100k-200k, 1857.7% for AGIs over 200k)
Ordinary dividends: $9,264 (reported on 27.4% of returns)
Here:
$9,264
State:
$8,783
(% of AGI for various income ranges: 51.1% for AGIs below $25k, 74.3% for AGIs $25k-50k, 206.1% for AGIs $50k-75k, 430.4% for AGIs $75k-100k, 1017.5% for AGIs $100k-200k, 5425.5% for AGIs over 200k)
Net capital gain/loss in AGI: +$29,661 (reported on 25.0% of returns)
Here:
+$29,661
State:
+$24,194
(% of AGI for various income ranges: 14.4% for AGIs below $25k, 39.1% for AGIs $25k-50k, 136.3% for AGIs $50k-75k, 373.2% for AGIs $75k-100k, 1274.2% for AGIs $100k-200k, 27438.0% for AGIs over 200k)
Profit/loss from business: +$15,866 (reported on 17.6% of returns)
Here:
+$15,866
State:
+$11,253
(% of AGI for various income ranges: 128.5% for AGIs below $25k, 181.0% for AGIs $25k-50k, 314.5% for AGIs $50k-75k, 448.4% for AGIs $75k-100k, 971.9% for AGIs $100k-200k, 4660.7% for AGIs over 200k)
Taxable individual retirement arrangement distribution: $23,524 (reported on 12.6% of returns)
29615:
$23,524
South Carolina:
$21,604
(% of AGI for various income ranges: 75.6% for AGIs below $25k, 142.6% for AGIs $25k-50k, 360.9% for AGIs $50k-75k, 757.2% for AGIs $75k-100k, 1714.6% for AGIs $100k-200k, 3147.3% for AGIs over 200k)
Self-employed (Keogh) retirement plans: $23,025 (reported on 0.6% of returns)
29615:
$23,025
South Carolina:
$25,038
(% of AGI for various income ranges: 5.7% for AGIs $25k-50k, 51.3% for AGIs $100k-200k, 425.5% for AGIs over 200k)
Total itemized deductions: $46,768 (reported on 11.4% of returns)
Here:
$46,768
State:
$35,199
(% of AGI for various income ranges: 51.8% for AGIs below $25k, 117.3% for AGIs $25k-50k, 336.3% for AGIs $50k-75k, 578.5% for AGIs $75k-100k, 1813.5% for AGIs $100k-200k, 14191.1% for AGIs over 200k)
Charity contributions: $27,639 (reported on 10.0% of returns)
Here:
$27,639
State:
$14,319
(% of AGI for various income ranges: 5.3% for AGIs below $25k, 23.5% for AGIs $25k-50k, 79.5% for AGIs $50k-75k, 163.3% for AGIs $75k-100k, 613.9% for AGIs $100k-200k, 9604.5% for AGIs over 200k)
Taxes paid: $7,804 (reported on 11.4% of returns)
29615:
$7,804
State:
$7,486
(% of AGI for various income ranges: 6.2% for AGIs below $25k, 17.6% for AGIs $25k-50k, 67.2% for AGIs $50k-75k, 140.2% for AGIs $75k-100k, 447.0% for AGIs $100k-200k, 1830.7% for AGIs over 200k)
Earned income credit: $2,006 (reported on 11.9% of returns)
Here:
$2,006
State:
$2,397
(% of AGI for various income ranges: 72.3% for AGIs below $25k, 48.5% for AGIs $25k-50k, 1.3% for AGIs $50k-75k)
Percentage of individuals using paid preparers for their 2020 taxes: 92.3%
Here:
92%
State:
93%
(% for various income ranges: 91.1% for AGIs below $25k, 92.7% for AGIs $25k-50k, 92.4% for AGIs $50k-75k, 92.6% for AGIs $75k-100k, 92.9% for AGIs $100k-200k, 94.0% for AGIs over 200k)
Averages for the 2012 tax year for zip code 29615, filed in 2013:
Average Adjusted Gross Income (AGI) in 2012: $70,340 (Individual Income Tax Returns)
Here:
$70,340
State:
$51,133
Salary/wage: $57,173 (reported on 80.6% of returns)
Here:
$57,173
State:
$42,173
(% of AGI for various income ranges: 75.7% for AGIs below $25k, 78.9% for AGIs $25k-50k, 68.6% for AGIs $50k-75k, 67.0% for AGIs $75k-100k, 70.6% for AGIs $100k-200k, 53.9% for AGIs over 200k)
Taxable interest for individuals: $2,342 (reported on 37.2% of returns)
This zip code:
$2,342
South Carolina:
$1,468
(% of AGI for various income ranges: 1.4% for AGIs below $25k, 0.7% for AGIs $25k-50k, 1.0% for AGIs $50k-75k, 1.1% for AGIs $75k-100k, 1.0% for AGIs $100k-200k, 1.7% for AGIs over 200k)
Ordinary dividends: $7,293 (reported on 28.4% of returns)
Here:
$7,293
State:
$6,511
(% of AGI for various income ranges: 2.7% for AGIs below $25k, 1.7% for AGIs $25k-50k, 2.6% for AGIs $50k-75k, 2.4% for AGIs $75k-100k, 3.0% for AGIs $100k-200k, 3.7% for AGIs over 200k)
Net capital gain/loss in AGI: +$14,498 (reported on 23.7% of returns)
Here:
+$14,498
State:
+$13,061
(% of AGI for various income ranges: 0.2% for AGIs $25k-50k, 0.9% for AGIs $50k-75k, 1.3% for AGIs $75k-100k, 1.8% for AGIs $100k-200k, 12.0% for AGIs over 200k)
Profit/loss from business: +$13,810 (reported on 15.3% of returns)
Here:
+$13,810
State:
+$10,167
(% of AGI for various income ranges: 7.0% for AGIs below $25k, 2.4% for AGIs $25k-50k, 2.9% for AGIs $50k-75k, 2.8% for AGIs $75k-100k, 3.0% for AGIs $100k-200k, 2.6% for AGIs over 200k)
Taxable individual retirement arrangement distribution: $18,669 (reported on 15.1% of returns)
29615:
$18,669
South Carolina:
$17,019
(% of AGI for various income ranges: 4.5% for AGIs below $25k, 3.8% for AGIs $25k-50k, 5.1% for AGIs $50k-75k, 5.2% for AGIs $75k-100k, 5.1% for AGIs $100k-200k, 2.5% for AGIs over 200k)
Self-employment retirement plans: $19,470 (reported on 0.6% of returns)
29615:
$19,470
South Carolina:
$21,023
(% of AGI for various income ranges: 0.2% for AGIs $50k-75k, 0.2% for AGIs $100k-200k, 0.3% for AGIs over 200k)
Total itemized deductions: $26,948 (20% of AGI, reported on 37.2% of returns)
Here:
$26,948
State:
$22,890
Here:
19.8% of AGI
State:
21.4% of AGI
(% of AGI for various income ranges: 12.1% for AGIs below $25k, 10.9% for AGIs $25k-50k, 13.7% for AGIs $50k-75k, 15.7% for AGIs $75k-100k, 16.4% for AGIs $100k-200k, 14.1% for AGIs over 200k)
Charity contributions: $7,123 (reported on 33.3% of returns)
Here:
$7,123
State:
$5,169
(% of AGI for various income ranges: 1.4% for AGIs below $25k, 2.0% for AGIs $25k-50k, 2.7% for AGIs $50k-75k, 3.6% for AGIs $75k-100k, 3.8% for AGIs $100k-200k, 4.1% for AGIs over 200k)
Taxes paid: $9,279 (reported on 37.1% of returns)
29615:
$9,279
State:
$7,644
(% of AGI for various income ranges: 1.6% for AGIs below $25k, 2.0% for AGIs $25k-50k, 3.4% for AGIs $50k-75k, 4.7% for AGIs $75k-100k, 6.1% for AGIs $100k-200k, 6.2% for AGIs over 200k)
Earned income credit: $1,983 (reported on 13.1% of returns)
Here:
$1,983
State:
$2,418
(% of AGI for various income ranges: 4.4% for AGIs below $25k, 0.7% for AGIs $25k-50k)
Percentage of individuals using paid preparers for their 2012 taxes: 52.5%
Here:
52%
State:
57%
(% for various income ranges: 48.4% for AGIs below $25k, 48.1% for AGIs $25k-50k, 54.4% for AGIs $50k-75k, 55.6% for AGIs $75k-100k, 58.5% for AGIs $100k-200k, 76.3% for AGIs over 200k)
Averages for the 2004 tax year for zip code 29615, filed in 2005:
Average Adjusted Gross Income (AGI) in 2004: $56,437 (Individual Income Tax Returns)
Here:
$56,437
State:
$41,965
Salary/wage: $48,729 (reported on 79.9% of returns)
Here:
$48,729
State:
$35,695
(% of AGI for various income ranges: 295.9% for AGIs below $10k, 74.9% for AGIs $10k-25k, 75.9% for AGIs $25k-50k, 71.8% for AGIs $50k-75k, 72.0% for AGIs $75k-100k, 62.6% for AGIs over 100k)
Taxable interest for individuals: $2,402 (reported on 48.4% of returns)
This zip code:
$2,402
South Carolina:
$1,623
(% of AGI for various income ranges: 26.2% for AGIs below $10k, 3.1% for AGIs $10k-25k, 2.1% for AGIs $25k-50k, 1.9% for AGIs $50k-75k, 1.6% for AGIs $75k-100k, 1.8% for AGIs over 100k)
Taxable dividends: $4,697 (reported on 35.3% of returns)
Here:
$4,697
State:
$3,999
(% of AGI for various income ranges: 21.5% for AGIs below $10k, 2.9% for AGIs $10k-25k, 2.7% for AGIs $25k-50k, 2.5% for AGIs $50k-75k, 2.7% for AGIs $75k-100k, 3.0% for AGIs over 100k)
Net capital gain/loss: +$8,786 (reported on 29.6% of returns)
Here:
+$8,786
State:
+$13,100
(% of AGI for various income ranges: 4.3% for AGIs below $10k, 0.4% for AGIs $10k-25k, 0.7% for AGIs $25k-50k, 1.5% for AGIs $50k-75k, 2.1% for AGIs $75k-100k, 7.9% for AGIs over 100k)
Profit/loss from business: +$12,859 (reported on 15.2% of returns)
Here:
+$12,859
State:
+$9,144
(% of AGI for various income ranges: 10.1% for AGIs below $10k, 4.1% for AGIs $10k-25k, 2.8% for AGIs $25k-50k, 2.9% for AGIs $50k-75k, 2.8% for AGIs $75k-100k, 3.9% for AGIs over 100k)
IRA payment deduction: $3,376 (reported on 3.2% of returns)
29615:
$3,376
South Carolina:
$2,972
(% of AGI for various income ranges: 0.3% for AGIs below $10k, 0.2% for AGIs $10k-25k, 0.3% for AGIs $25k-50k, 0.3% for AGIs $50k-75k, 0.2% for AGIs $75k-100k, 0.1% for AGIs over 100k)
Self-employed pension: $14,255 (reported on 1.2% of returns)
Here:
$14,255
South Carolina:
$15,117
(% of AGI for various income ranges: 0.6% for AGIs below $10k, 0.1% for AGIs $25k-50k, 0.2% for AGIs $50k-75k, 0.2% for AGIs $75k-100k, 0.5% for AGIs over 100k)
Total itemized deductions: $22,161 (22% of AGI, reported on 43.1% of returns)
Here:
$22,161
State:
$19,039
Here:
22.1% of AGI
State:
22.8% of AGI
(% of AGI for various income ranges: 64.0% for AGIs below $10k, 13.5% for AGIs $10k-25k, 15.2% for AGIs $25k-50k, 18.4% for AGIs $50k-75k, 19.7% for AGIs $75k-100k, 16.3% for AGIs over 100k)
Charity contributions deductions: $5,694 (5% of AGI, reported on 39.6% of returns)
Here:
$5,694
State:
$4,305
Here:
5.5% of AGI
State:
5.0% of AGI
(% of AGI for various income ranges: 5.4% for AGIs below $10k, 2.2% for AGIs $10k-25k, 2.9% for AGIs $25k-50k, 3.6% for AGIs $50k-75k, 4.3% for AGIs $75k-100k, 4.6% for AGIs over 100k)
Total tax: $9,690 (reported on 78.3% of returns)
29615:
$9,690
State:
$6,497
(% of AGI for various income ranges: 9.2% for AGIs below $10k, 4.3% for AGIs $10k-25k, 7.4% for AGIs $25k-50k, 9.5% for AGIs $50k-75k, 10.2% for AGIs $75k-100k, 18.5% for AGIs over 100k)
Earned income credit: $1,599 (reported on 10.2% of returns)
Here:
$1,599
State:
$1,882
Percentage of individuals using paid preparers for their 2004 taxes: 57.6%
Here:
58%
State:
66%
(% for various income ranges: 49.9% for AGIs below $10k, 59.3% for AGIs $10k-25k, 57.0% for AGIs $25k-50k, 58.4% for AGIs $50k-75k, 54.6% for AGIs $75k-100k, 67.1% for AGIs over 100k)
Likely homosexual households (counted as self-reported same-sex unmarried-partner households)
Lesbian couples: 0.2% of all households
Gay men: 0.1% of all households
Household received Food Stamps/SNAP in the past 12 months: 569 Household did not receive Food Stamps/SNAP in the past 12 months: 18,556
Women who had a birth in the past 12 months: 506 (487 now married, 43 unmarried) Women who did not have a birth in the past 12 months: 9,361 (4,199 now married, 5,171 unmarried)
Housing units in zip code 29615 with a mortgage: 6,216 (723 second mortgage, 144 home equity loan, 522 both second mortgage and home equity loan) Houses without a mortgage: 338
Median monthly owner costs for units with a mortgage: $1,626 Median monthly owner costs for units without a mortgage: $460
Residents with income below the poverty level in 2022:
This zip code:
6.4%
Whole state:
14.0%
Residents with income below 50% of the poverty level in 2022:
This zip code:
2.5%
Whole state:
7.3%
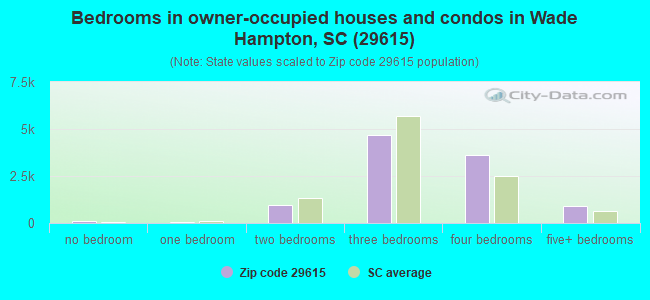
Median number of rooms in houses and condos:
Here:
7.5
State:
6.4
Median number of rooms in apartments:
Here:
3.9
State:
4.5
Notable locations in this zip code not listed on our city pages
Notable locations in zip code 29615: Carolina Golf and Tennis Club (A), Wade Hampton Fire Department Station 4 (B), Wade Hampton Fire Department Station 2 (C), Mauldin Fire Department Station 2 (D), Boiling Springs Fire Department Station 2 (E). Display/hide their locations on the map
Shopping Centers: Lake Forest Shopping Center (1), Burns Corner Shopping Center (2), North Hills Shopping Center (3). Display/hide their locations on the map
Churches in zip code 29615 include: Rock Hill Church (A), Aldersgate Church (B), Edwards Road Church (C), Hampton Heights Church (D), East North Street Church (E), Pelham Road Church (F), Pine Forest Church (G), Saint Francis Church (H), Saint Giles Church (I). Display/hide their locations on the map
Reservoirs: J P Stevens Pond (A), Lake Fairfield (B), McCalls Lake (C), Oak Grove Lake (D), Smiths Pond (E), Huntington Lake (F), Pine Grove Lake (G). Display/hide their locations on the map
6,226 married couples with children.
1,086 single-parent households (254 men, 832 women).
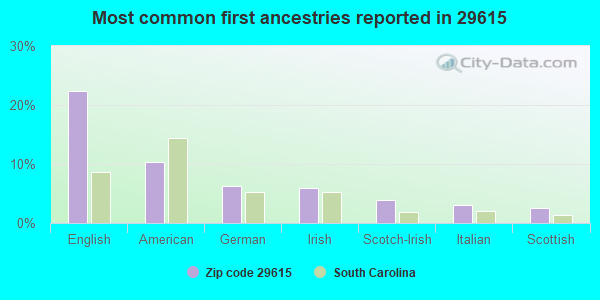
86.2% of residents of 29615 zip code speak English at home.
6.9% of residents speak Spanish at home (49% very well, 25% well, 20% not well, 6% not at all).
3.2% of residents speak other Indo-European language at home (85% very well, 15% well).
2.7% of residents speak Asian or Pacific Island language at home (60% very well, 30% well, 7% not well, 3% not at all).
1.1% of residents speak other language at home (81% very well, 10% well, 9% not well).
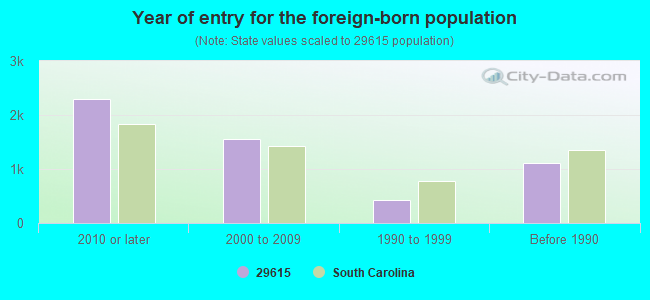
Foreign born population: 4,350 (10.8%) (45.9% of them are naturalized citizens)
Major facilities with environmental interests located in this zip code:
AMERADA HESS STATION 40239 (2049 WADE HAMPTON BLVD in GREENVILLE, SC)
Conditionally Exempt Small Quantity Generators, less than 100 kg/month of hazardous waste (Resource Conservation and Recovery Act (tracking hazardous waste)) - notification STATE MASTER (South Carolina database) - HAZARDOUS WASTE PROGRAM STATE MASTER (South Carolina database) - UNDERGROUND STORAGE TANK PROGRAM Organizations: AMERADA HESS CORP (CONTACT/OWNER)
BAUSCH & LOMB INCORPORATED (8507 PELHAM RD. in GREENVILLE, SC)
AIR MINOR (AIRS/AFS) Small Quantity Generators, between 100 kg and 1000 kg of hazardous waste/month (Resource Conservation and Recovery Act (tracking hazardous waste)) - notification STATE MASTER (South Carolina database) - AIR PROGRAM, LABORATORY CERTIFICATION, TRI REPORTER, RADIOACTIVE MATERIALS, National Pollutant Discharge Elimination System Permit, HAZARDOUS WASTE PROGRAM TRI REPORTER (Tracking of toxic chemicals releasing facilities) Business SIC classification: ROBES AND DRESSING GOWNS; MEDICINAL CHEMICALS AND BOTANICAL PRODUCTS; PHARMACEUTICAL PREPARATIONS Business NAICS classification: PHARMACEUTICAL PREPARATION MANUFACTURING. Organizations: ARCADIS GERAGHTY & MILLER/DICKENS (CONTACT/ENGINEERING/CONSULTING FIRM)
Alternative names: BAUSCH & LOMB GLOBAL VISION CARE
BOSTIK FINDLEY INCORPORATED (6997 PELHAM ROAD in GREENVILLE, SC)
AIR MINOR (AIRS/AFS) COMPLIANCE ACTIVITY (Tracking inspections of insecticide, fungicide, and rodenticide, and toxic substances) (Resource Conservation and Recovery Act (tracking hazardous waste)) STATE MASTER (South Carolina database) - HAZARDOUS WASTE PROGRAM, AIR PROGRAM, Business SIC classification: ADHESIVES AND SEALANTS Organizations: ATO FINDLEY INC (CONTACT/OWNER)
Alternative names: ATO FINDLEY INC, ATO FINDLEY (FINDLEY ADHESIVES, INC.)
COMPUTER DYNAMICS INC. (7640 PELHAM RD. in GREENVILLE, SC)
COMPLIANCE ACTIVITY (Tracking inspections of insecticide, fungicide, and rodenticide, and toxic substances) CRITERIA AND HAZARDOUS AIR POLLUTANT INVENTORY (Inventory of air pollution sources) Small Quantity Generators, between 100 kg and 1000 kg of hazardous waste/month (Resource Conservation and Recovery Act (tracking hazardous waste)) STATE MASTER (South Carolina database) - HAZARDOUS WASTE PROGRAM TRI REPORTER (Tracking of toxic chemicals releasing facilities) Business SIC classification: ELECTRONIC COMPUTERS; COMPUTER PERIPHERAL EQUIPMENT; RELAYS AND INDUSTRIAL CONTROLS Organizations: GE FANUC (CONTACT/OPERATOR)
Alternative names: DAVIS MECHANICAL CONTRACTORS
FIBER SERVICES INCORPORATED (200 BROZZINI COURT in GREENVILLE, SC)
AIR MINOR (AIRS/AFS) Small Quantity Generators, between 100 kg and 1000 kg of hazardous waste/month (Resource Conservation and Recovery Act (tracking hazardous waste)) - notification STATE MASTER (South Carolina database) - HAZARDOUS WASTE PROGRAM TRI REPORTER (Tracking of toxic chemicals releasing facilities) Business SIC classification: MANUFACTURING INDUSTRIES; SERVICES Business NAICS classification: ALL OTHER MISCELLANEOUS MANUFACTURING.
FIBER SERVICES INCORPORATED (340 INTERSTATE BOULEVARD in GREENVILLE, SC)
(Resource Conservation and Recovery Act (tracking hazardous waste)) STATE MASTER (South Carolina database) - TRI REPORTER, HAZARDOUS WASTE PROGRAM TRI REPORTER (Tracking of toxic chemicals releasing facilities) Business SIC classification: MANUFACTURING INDUSTRIES Organizations: OPERNAME (CONTACT/OPERATOR)
, CORPORATION (CONTACT/OWNER)
CENTRAL TRANSPORT INCORPORATED (5330 HONBARRIER RD in GREENVILLE, SC)
National Pollutant Discharge Elimination System NON-MAJOR (Tracking pollutant discharge elimination systems) - permit Conditionally Exempt Small Quantity Generators, less than 100 kg/month of hazardous waste (Resource Conservation and Recovery Act (tracking hazardous waste)) - notification STATE MASTER (South Carolina database) - National Pollutant Discharge Elimination System Permit, HAZARDOUS WASTE PROGRAM Business SIC classification: TERMINAL AND JOINT TERMINAL MAINTENANCE FACILITIES FOR MOTOR FREIGHT TRANSPORTATION
CHEROKEE KENWORTH TRUCK REPAIR (1111 WOODRUFF RD in GREENVILLE, SC)
(Resource Conservation and Recovery Act (tracking hazardous waste)) STATE MASTER (South Carolina database) - HAZARDOUS WASTE PROGRAM Organizations: OPERNAME (CONTACT/OPERATOR)
, UNITED CAROLINA BANK (CONTACT/OWNER)
ELMAT INCORPORATED (50 COMMERCE CTR in GREENVILLE, SC)
(Resource Conservation and Recovery Act (tracking hazardous waste)) STATE MASTER (South Carolina database) - HAZARDOUS WASTE PROGRAM Organizations: OPERNAME (CONTACT/OPERATOR)
, CORPORATION (CONTACT/OWNER)
Alternative names: ELMAT INCORPORATED DEACTIVATED, ELMONT INC.
ELMAT, INC. (200 ELLIMAN DR. in GREENVILLE, SC)
(Resource Conservation and Recovery Act (tracking hazardous waste)) STATE MASTER (South Carolina database) - HAZARDOUS WASTE PROGRAM Organizations: OPERNAME (CONTACT/OPERATOR)
, PETER J. ELLIMAN (CONTACT/OWNER)
Alternative names: ELMAT INC
BAUSCH & LOMB GREENVILLE DISTRIBUTION CR (130 COMMERCE DR in GREENVILLE, SC)
Small Quantity Generators, between 100 kg and 1000 kg of hazardous waste/month (Resource Conservation and Recovery Act (tracking hazardous waste)) STATE MASTER (South Carolina database) - HAZARDOUS WASTE PROGRAM
DRYCLEAN USA GREENVILLE (3566 PELHAM RD in GREENVILLE, SC)
Conditionally Exempt Small Quantity Generators, less than 100 kg/month of hazardous waste (Resource Conservation and Recovery Act (tracking hazardous waste)) - notification STATE MASTER (South Carolina database) - HAZARDOUS WASTE PROGRAM Organizations: OPERNAME (CONTACT/OPERATOR)
, DRYCLEAN USA SC INC (CONTACT/OWNER)
Alternative names: DRYCLEAN USA STORE 407
AMERADA HESS STATION 40250 (2431 E NORTH STREET in GREENVILLE, SC)
Conditionally Exempt Small Quantity Generators, less than 100 kg/month of hazardous waste (Resource Conservation and Recovery Act (tracking hazardous waste)) - notification STATE MASTER (South Carolina database) - National Pollutant Discharge Elimination System Permit, HAZARDOUS WASTE PROGRAM Organizations: AMERADA HESS CORP (CONTACT/OWNER)
Housing units lacking complete plumbing facilities: 0.1% Housing units lacking complete kitchen facilities: 2.8%
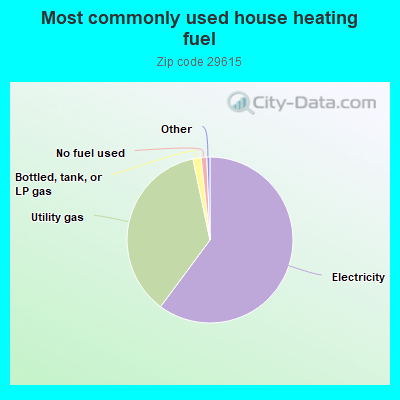
60.1%Electricity
36.5%Utility gas
1.6%Bottled, tank, or LP gas
1.1%No fuel used
Population in 1990: 25,818. Population change in the 1990s: +5,431 (+21.0%).
Place of birth for U.S.-born residents:
This state: 15,751
Northeast: 4,252
Midwest: 3,954
South: 9,657
West: 1,601
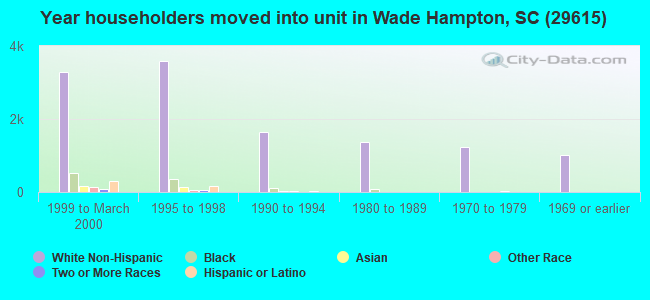
46% of the 29615 zip code residents lived in the same house 5 years ago. Out of people who lived in different houses, 43% lived in this county. Out of people who lived in different counties, 50% lived in South Carolina.
85% of the 29615 zip code residents lived in the same house 1 year ago. Out of people who lived in different houses, 51% moved from this county. Out of people who lived in different houses, 16% moved from different county within same state. Out of people who lived in different houses, 25% moved from different state. Out of people who lived in different houses, 4% moved from abroad.
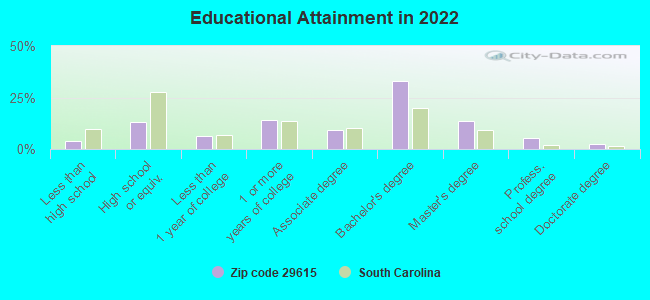
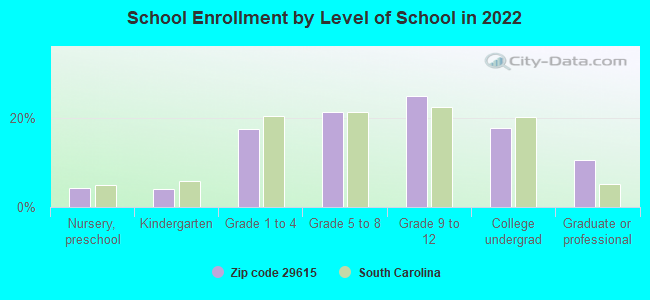
Private vs. public school enrollment:
Students in private schools in grades 1 to 8 (elementary and middle school): 1,072
Here:
31.4%
South Carolina:
14.4%
Students in private schools in grades 9 to 12 (high school): 293
Here:
14.0%
South Carolina:
11.1%
Students in private undergraduate colleges: 472
Here:
31.7%
South Carolina:
21.9%
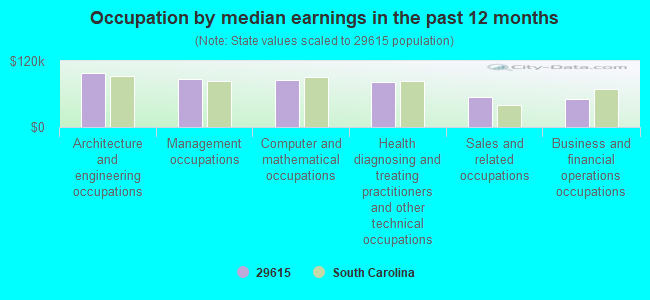
Occupation by median earnings in the past 12 months ($)
97,380Architecture and engineering occupations
88,152Management occupations
85,253Computer and mathematical occupations
82,349Health diagnosing and treating practitioners and other technical occupations
54,986Sales and related occupations
51,267Business and financial operations occupations
Companies with biggest federal contracts located in this zip code (GREENVILLE, SC):
EARTH TECH ENVIRONMENT & INFRA (10 PATEWOOD DRIVE) : $87,600,688 in 276 contractsfrom 1999 to 2004
Contracts for Hazardous Substance Removal, Cleanup, and Disposal Services and Operational Support, Other Environmental Services, Studies, and Analytical Support, Maintenance, Repair or Alteration of Real Property -- Sewage and Waste Facilities, Construction of Structures and Facilities -- Restoration of real property, and moreby Army, U.S. Army Corps of Engineers - civil program financing only, Air Force Signed by year:2000: $27,665,853; 2001: $12,782,549; 2002: $19,655,433; 2003: $15,572,378; 2004: $1,977,190; 2005: $0; 2006: $0.
Biggest contracts:
$4,015,000 with Army for Hazardous Substance Removal, Cleanup, and Disposal Services and Operational Support. Taking place in CO. Signed on 2000-06-27. Completion date: 2002-07-31.
$3,498,482 with Army for Other Environmental Services, Studies, and Analytical Support. Taking place in CO. Signed on 2003-04-21. Completion date: 2006-05-01.
$2,989,056 with U.S. Army Corps of Engineers - civil program financing only for Other Environmental Services, Studies, and Analytical Support. Taking place in CO. Signed on 2002-05-22. Completion date: 2004-06-01.
$2,715,549 with Army for Hazardous Substance Removal, Cleanup, and Disposal Services and Operational Support. Taking place in FL. Signed on 2000-02-18. Completion date: 2001-07-31.
EARTH TECH, INC (10 PATEWOOD DR BUILDING VI) : $34,305,250 in 72 contractsfrom 2003 to 2006
Contracts for Other Environmental Services, Studies, and Analytical Support, Construction of Structures and Facilities -- Restoration of real property, Lease or Rental of Facilities -- Restoration of real property, Hazardous Substance Removal, Cleanup, and Disposal Services and Operational Support by Army Signed by year:2000: $0; 2001: $0; 2002: $0; 2003: $3,553,643; 2004: $11,113,207; 2005: $12,280,848; 2006: $7,357,552.
Biggest contracts:
$3,746,150 with Army for Other Environmental Services, Studies, and Analytical Support. Taking place in FL. Signed on 2006-05-24. Completion date: 2010-09-30.
$2,928,927 with Army for Other Environmental Services, Studies, and Analytical Support. Taking place in MD. Signed on 2005-09-08. Completion date: 2010-12-30.
$2,388,697 with Army for Other Environmental Services, Studies, and Analytical Support. Taking place in FL. Signed on 2005-09-23. Completion date: 2006-10-31.
$2,094,402 with Army for Construction of Structures and Facilities -- Restoration of real property. Taking place in SD. Signed on 2003-12-29. Completion date: 2006-06-30.
SHAW ENVIRONMENTAL, INC (3 INDEPENDENCE POINTE, SUI) : $10,472,889 in 27 contractsfrom 2003 to 2004
Contracts for Construction of Structures and Facilities -- Restoration of real property, Hazardous Substance Removal, Cleanup, and Disposal Services and Operational Support by U.S. Army Corps of Engineers - civil program financing only, Army Signed by year:2000: $0; 2001: $0; 2002: $0; 2003: $9,319,883; 2004: $1,153,006; 2005: $0; 2006: $0.
Biggest contracts:
$2,500,000 with U.S. Army Corps of Engineers - civil program financing only for Construction of Structures and Facilities -- Restoration of real property. Taking place in FL. Signed on 2003-07-22. Completion date: 2003-09-30.
$1,800,000, same as above.Signed on 2003-09-18. Completion date: 2004-02-20.
$1,506,894, same as above.Signed on 2003-12-18. Completion date: 2004-02-20.
$1,506,894 with Army for Construction of Structures and Facilities -- Restoration of real property. Taking place in FL. Signed on 2003-12-18. Completion date: 2004-02-20.
EARTH TECH (10 PATEWOOD DR BLDG 6) : $7,655,389 in 28 contractsfrom 2000 to 2002
Contracts for Hazardous Substance Removal, Cleanup, and Disposal Services and Operational Support, Construction of Structures and Facilities -- Restoration of real property, Other Environmental Services, Studies, and Analytical Support, Industrial Investigations, Surveys and Technical Support for Multiple Pollutants, and moreby Army Signed by year:2000: -$35,231; 2001: $6,129,412; 2002: $1,561,208; 2003: $0; 2004: $0; 2005: $0; 2006: $0.
Biggest contracts:
$2,171,297 with Army for Hazardous Substance Removal, Cleanup, and Disposal Services and Operational Support. Taking place in FL. Signed on 2001-02-09. Completion date: 2003-07-31.
$840,919 with Army for Construction of Structures and Facilities -- Restoration of real property. Taking place in CO. Signed on 2001-03-30. Completion date: 2002-01-31.
$787,000 with Army for Other Environmental Services, Studies, and Analytical Support. Taking place in FL. Signed on 2002-06-29. Completion date: 2004-11-30.
$561,319 with Army for Industrial Investigations, Surveys and Technical Support for Multiple Pollutants. Taking place in CO. Signed on 2002-03-19. Completion date: 2002-07-31.
GATES ARROW DISTRIBUTING (39 PELHAM RIDGE DRIVE) : $2,710,838 in 80 contractsfrom 1999 to 2003
Contracts for ADP Input/Output and Storage Devices, ADP Components, ADP Supplies, ADPE System Configuration, and moreby Federal Technology Service, Navy, Food and Drug Administration, Department of Veterans Affairs, and others Signed by year:2000: $1,193,448; 2001: $977,362; 2002: $471,875; 2003: $2,359; 2004: $0; 2005: $0; 2006: $0.
Biggest contracts:
$134,000 with Federal Technology Service for ADP Input/Output and Storage Devices. Signed on 2000-09-15. Completion date: 2000-09-15.
$127,828 with Navy for ADP Components. Signed on 2001-05-03. Completion date: 2004-03-04.
$98,000 with Food and Drug Administration for ADP Supplies. Signed on 2002-05-15. Completion date: 2002-05-15.
$93,000 with Federal Technology Service for ADPE System Configuration. Signed on 2000-03-15. Completion date: 2000-04-15.
IT CORPORATION (30 PATEWOOD DRIVE) : $2,071,309 in 2 contractsfrom 2001 to 2002
$1,353,546 with Army for Construction of Structures and Facilities -- Restoration of real property. Taking place in VA. Signed on 2002-09-26. Completion date: 2002-09-30.
$717,763, same as above.Signed on 2001-09-28. Completion date: 2002-09-30.
ROXFORD FORDELL GROUP INC (16 PELHAM DAVIS CIRCLE; small business) : $2,039,436 in 5 contractsfrom 2004 to 2005
Contracts for Prefabricated and Portable Buildings, Textile Fabrics, Miscellaneous Prefabricated Structures by Army Signed by year:2000: $0; 2001: $0; 2002: $0; 2003: $0; 2004: $2,417,436; 2005: -$378,000; 2006: $0.
Biggest contracts:
$2,016,000 with Army for Prefabricated and Portable Buildings. Signed on 2004-04-29. Completion date: 2006-04-30.
$378,000, same as above.Signed on 2004-08-18. Completion date: 2006-04-30.
$23,436 with Army for Textile Fabrics. Signed on 2004-04-13. Completion date: 2004-05-14.
$0 with Army for Miscellaneous Prefabricated Structures. Signed on 2004-04-29. Completion date: 2006-04-30.
RELIANCE ELECTRIC COMPANY (6040 PONDERS COURT) : $1,789,626 in 40 contractsfrom 1999 to 2005
Contracts for Motors, Electrical, Miscellaneous Electric Power and Distribution Equipment, Miscellaneous Special Industry Machinery, Maintenance, Repair and Rebuilding of Equipment -- Electric Wire, and Power and Distribution Equipment, and moreby Navy, Defense Logistics Agency, Air Force, U.S. Army Corps of Engineers - civil program financing only, and others Signed by year:2000: $33,403; 2001: $405,804; 2002: $263,585; 2003: $386,113; 2004: $599,189; 2005: $66,537; 2006: $0.
Biggest contracts:
$271,372 with Navy for Motors, Electrical. Signed on 2003-01-16. Completion date: 2003-08-29.
$210,520 with Navy for Miscellaneous Electric Power and Distribution Equipment. Signed on 2004-03-26. Completion date: 2004-08-26.
$133,658 with Navy for Motors, Electrical. Taking place in MA. Signed on 2001-12-05. Completion date: 2002-07-08.
$130,885 with Navy for Miscellaneous Special Industry Machinery. Signed on 2004-12-09. Completion date: 2005-03-15.
SYNNEX INFORMATION TECHNOLOGIE (39 PELHAM RIDGE DRIVE) : $1,040,777 in 56 contractsfrom 2002 to 2005
Contracts for ADP Components, ADPE System Configuration, Engineering and Technical Services, ADP Support Equipment, and moreby Navy, Army, Federal Technology Service, Department of Defense, and others Signed by year:2000: $0; 2001: $0; 2002: $383,823; 2003: $589,300; 2004: $64,754; 2005: $2,900; 2006: $0.
Biggest contracts:
$114,407 with Navy for ADP Components. Signed on 2003-03-31. Completion date: 2003-04-08.
$83,107 with Army for ADPE System Configuration. Taking place in AL. Signed on 2002-07-15. Completion date: 2002-08-09.
$76,168 with Federal Technology Service for Engineering and Technical Services. Signed on 2003-08-15. Completion date: 2003-09-15.
$73,569 with Navy for ADP Support Equipment. Signed on 2003-09-25. Completion date: 2003-10-09.
IKON OFFICE SOLUTIONS (1001 KEYS DRIVE) : $915,278 in 20 contractsfrom 1999 to 2004
Contracts for Printing, Duplicating, and Bookbinding Equipment, Office Information System Equipment, Photographic Equipment and Accessories, ADP Support Equipment, and moreby Army, Internal Revenue Service, Navy, Air Force, and others Signed by year:2000: $558,787; 2001: $46,145; 2002: -$1,129; 2003: $8,552; 2004: $73,103; 2005: $0; 2006: $0.
Biggest contracts:
$211,632 with Army for Printing, Duplicating, and Bookbinding Equipment. Signed on 2000-10-05. Completion date: 2001-09-30.
$209,820, same as above.Signed on 1999-10-07. Completion date: 2002-09-30.
$156,044 with Army for Office Information System Equipment. Signed on 2000-09-30. Completion date: 2000-11-30.
$72,000 with Internal Revenue Service for Photographic Equipment and Accessories. Taking place in DC. Signed on 2000-08-15. Completion date: 2000-08-15.
Top industries in this zip code by the number of employees in 2005:
Health Care and Social Assistance: Offices of Physicians (except Mental Health Specialists) (100-249: 1, 50-99: 1, 20-49: 9, 10-19: 16, 5-9: 17, 1-4: 32)
Wholesale Trade: Computer and Computer Peripheral Equipment and Software Merchant Wholesalers (250-499: 2, 20-49: 2, 10-19: 1, 1-4: 2)
Other Services (except Public Administration): Commercial and Industrial Machinery and Equipment (except Automotive and Electronic) Repair and Maintenance (500-999: 1, 20-49: 1, 10-19: 1, 5-9: 2)
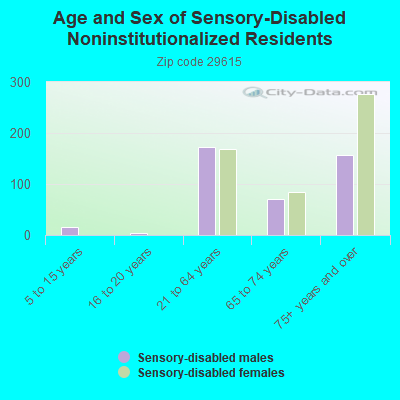
People in group quarters in 2010:
273 people in nursing facilities/skilled-nursing facilities
4 people in workers' group living quarters and job corps centers
People in group quarters in 2000:
119 people in other group homes
83 people in nursing homes
40 people in other noninstitutional group quarters
36 people in other nonhousehold living situations
Fatal accident statistics in 2014:
Fatal accident count: 5
Vehicles involved in fatal accidents: 7
Fatal accidents caused by drunken drivers: 1
Fatalities: 5
Persons involved in fatal accidents: 10
Pedestrians involved in fatal accidents: 2
Fatal accident statistics in 2013:
Fatal accident count: 4
Vehicles involved in fatal accidents: 4
Fatal accidents caused by drunken drivers: 3
Fatalities: 4
Persons involved in fatal accidents: 4
Pedestrians involved in fatal accidents: 0
Home Mortgage Disclosure Act Aggregated Statistics For Year 2009 (Based on 2 full and 20 partial tracts)
A) FHA, FSA/RHS & VA Home Purchase Loans
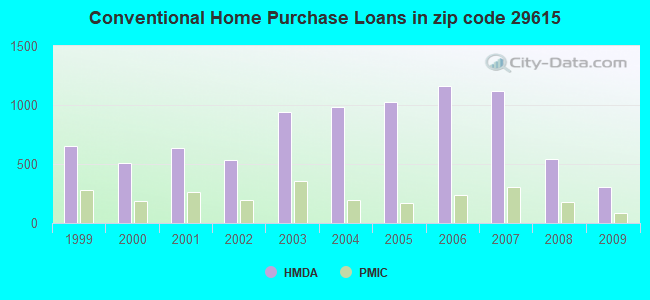
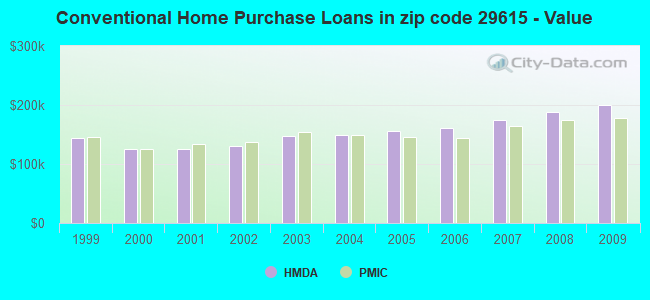
B) Conventional Home Purchase Loans
C) Refinancings
D) Home Improvement Loans
E) Loans on Dwellings For 5+ Families
F) Non-occupant Loans on < 5 Family Dwellings (A B C & D)
G) Loans On Manufactured Home Dwelling (A B C & D)
Number
Average Value
Number
Average Value
Number
Average Value
Number
Average Value
Number
Average Value
Number
Average Value
Number
Average Value
LOANS ORIGINATED
182
$151,053
306
$200,418
1,445
$190,868
32
$92,353
1
$1,219,980
58
$144,813
2
$204,225
APPLICATIONS APPROVED, NOT ACCEPTED
12
$164,475
16
$212,421
79
$170,562
3
$48,327
0
$0
1
$79,510
0
$0
APPLICATIONS DENIED
12
$121,784
29
$154,907
312
$196,260
19
$52,127
0
$0
18
$152,802
3
$45,200
APPLICATIONS WITHDRAWN
17
$132,332
49
$183,543
244
$184,804
8
$111,646
0
$0
9
$141,388
0
$0
FILES CLOSED FOR INCOMPLETENESS
3
$124,547
9
$163,484
89
$198,376
0
$0
0
$0
1
$71,760
0
$0
Aggregated Statistics For Year 2008 (Based on 2 full and 20 partial tracts)
A) FHA, FSA/RHS & VA Home Purchase Loans
B) Conventional Home Purchase Loans
C) Refinancings
D) Home Improvement Loans
E) Loans on Dwellings For 5+ Families
F) Non-occupant Loans on < 5 Family Dwellings (A B C & D)
G) Loans On Manufactured Home Dwelling (A B C & D)
Number
Average Value
Number
Average Value
Number
Average Value
Number
Average Value
Number
Average Value
Number
Average Value
Number
Average Value
LOANS ORIGINATED
110
$154,490
546
$187,920
770
$180,451
59
$79,109
8
$8,313,190
106
$149,595
2
$40,040
APPLICATIONS APPROVED, NOT ACCEPTED
8
$134,112
47
$170,379
112
$174,190
11
$8,979
0
$0
10
$102,899
1
$27,780
APPLICATIONS DENIED
25
$152,461
84
$163,537
323
$158,530
48
$82,402
2
$220,800
28
$121,058
2
$46,790
APPLICATIONS WITHDRAWN
7
$173,301
67
$193,986
186
$175,030
22
$123,525
0
$0
20
$113,092
0
$0
FILES CLOSED FOR INCOMPLETENESS
0
$0
15
$165,981
37
$185,492
1
$43,620
0
$0
2
$99,940
0
$0
Aggregated Statistics For Year 2007 (Based on 2 full and 20 partial tracts)
A) FHA, FSA/RHS & VA Home Purchase Loans
B) Conventional Home Purchase Loans
C) Refinancings
D) Home Improvement Loans
E) Loans on Dwellings For 5+ Families
F) Non-occupant Loans on < 5 Family Dwellings (A B C & D)
G) Loans On Manufactured Home Dwelling (A B C & D)
Number
Average Value
Number
Average Value
Number
Average Value
Number
Average Value
Number
Average Value
Number
Average Value
Number
Average Value
LOANS ORIGINATED
48
$158,323
1,116
$174,201
614
$173,392
60
$93,315
8
$8,361,778
194
$152,575
4
$65,588
APPLICATIONS APPROVED, NOT ACCEPTED
1
$103,890
63
$177,686
105
$146,849
10
$71,749
0
$0
9
$131,204
0
$0
APPLICATIONS DENIED
6
$100,208
136
$150,519
295
$152,850
31
$72,492
0
$0
29
$131,361
5
$53,438
APPLICATIONS WITHDRAWN
1
$78,880
86
$215,660
185
$175,427
12
$96,914
2
$3,143,115
16
$471,687
0
$0
FILES CLOSED FOR INCOMPLETENESS
2
$104,860
18
$166,683
45
$171,127
4
$45,988
0
$0
5
$121,730
0
$0
Aggregated Statistics For Year 2006 (Based on 2 full and 20 partial tracts)
A) FHA, FSA/RHS & VA Home Purchase Loans
B) Conventional Home Purchase Loans
C) Refinancings
D) Home Improvement Loans
E) Loans on Dwellings For 5+ Families
F) Non-occupant Loans on < 5 Family Dwellings (A B C & D)
G) Loans On Manufactured Home Dwelling (A B C & D)
Number
Average Value
Number
Average Value
Number
Average Value
Number
Average Value
Number
Average Value
Number
Average Value
Number
Average Value
LOANS ORIGINATED
39
$161,263
1,160
$161,398
752
$132,012
88
$48,097
5
$5,517,804
189
$138,485
8
$75,340
APPLICATIONS APPROVED, NOT ACCEPTED
3
$143,637
131
$148,230
137
$124,827
20
$78,570
0
$0
29
$159,427
10
$66,190
APPLICATIONS DENIED
7
$100,064
212
$158,291
327
$149,783
62
$70,483
2
$3,143,115
53
$133,235
12
$80,448
APPLICATIONS WITHDRAWN
4
$137,675
162
$143,799
217
$148,439
9
$93,972
1
$173,950
32
$144,874
0
$0
FILES CLOSED FOR INCOMPLETENESS
2
$138,575
40
$131,897
67
$148,875
4
$97,238
0
$0
4
$167,898
0
$0
Aggregated Statistics For Year 2005 (Based on 2 full and 20 partial tracts)
A) FHA, FSA/RHS & VA Home Purchase Loans
B) Conventional Home Purchase Loans
C) Refinancings
D) Home Improvement Loans
E) Loans on Dwellings For 5+ Families
F) Non-occupant Loans on < 5 Family Dwellings (A B C & D)
G) Loans On Manufactured Home Dwelling (A B C & D)
Number
Average Value
Number
Average Value
Number
Average Value
Number
Average Value
Number
Average Value
Number
Average Value
Number
Average Value
LOANS ORIGINATED
38
$135,935
1,022
$155,484
808
$154,679
80
$61,116
4
$3,990,530
120
$113,798
3
$60,017
APPLICATIONS APPROVED, NOT ACCEPTED
3
$113,290
77
$169,423
134
$124,529
14
$29,504
0
$0
10
$193,499
4
$60,978
APPLICATIONS DENIED
11
$115,476
150
$119,970
359
$152,744
73
$45,288
0
$0
28
$99,453
35
$60,965
APPLICATIONS WITHDRAWN
2
$94,520
110
$158,509
246
$174,302
30
$170,975
0
$0
20
$169,250
3
$18,707
FILES CLOSED FOR INCOMPLETENESS
5
$102,928
35
$151,202
115
$155,052
3
$72,073
0
$0
5
$113,790
0
$0
Aggregated Statistics For Year 2004 (Based on 2 full and 20 partial tracts)
A) FHA, FSA/RHS & VA Home Purchase Loans
B) Conventional Home Purchase Loans
C) Refinancings
D) Home Improvement Loans
E) Loans on Dwellings For 5+ Families
F) Non-occupant Loans on < 5 Family Dwellings (A B C & D)
G) Loans On Manufactured Home Dwelling (A B C & D)
Number
Average Value
Number
Average Value
Number
Average Value
Number
Average Value
Number
Average Value
Number
Average Value
Number
Average Value
LOANS ORIGINATED
59
$119,392
982
$149,886
955
$153,996
68
$92,446
2
$411,930
149
$114,716
3
$53,730
APPLICATIONS APPROVED, NOT ACCEPTED
3
$96,230
98
$154,979
113
$144,369
9
$51,686
0
$0
7
$153,701
8
$43,940
APPLICATIONS DENIED
6
$121,363
116
$117,237
372
$136,285
64
$61,181
0
$0
29
$104,227
23
$64,733
APPLICATIONS WITHDRAWN
10
$110,253
101
$140,128
226
$160,084
26
$64,585
0
$0
10
$101,863
2
$87,080
FILES CLOSED FOR INCOMPLETENESS
0
$0
21
$167,422
86
$163,137
9
$31,009
0
$0
7
$142,129
0
$0
Aggregated Statistics For Year 2003 (Based on 2 full and 20 partial tracts)
A) FHA, FSA/RHS & VA Home Purchase Loans
B) Conventional Home Purchase Loans
C) Refinancings
D) Home Improvement Loans
E) Loans on Dwellings For 5+ Families
F) Non-occupant Loans on < 5 Family Dwellings (A B C & D)
Number
Average Value
Number
Average Value
Number
Average Value
Number
Average Value
Number
Average Value
Number
Average Value
LOANS ORIGINATED
86
$107,512
940
$147,843
2,797
$146,100
34
$44,994
9
$6,082,699
169
$109,650
APPLICATIONS APPROVED, NOT ACCEPTED
7
$86,759
52
$146,208
194
$143,262
2
$33,180
0
$0
19
$111,314
APPLICATIONS DENIED
9
$114,204
111
$116,237
447
$140,092
29
$36,075
0
$0
40
$101,020
APPLICATIONS WITHDRAWN
14
$98,659
108
$142,142
320
$154,063
9
$43,683
0
$0
20
$95,038
FILES CLOSED FOR INCOMPLETENESS
2
$87,245
24
$169,934
92
$154,779
10
$37,806
0
$0
8
$110,974
Aggregated Statistics For Year 2002 (Based on 2 full and 16 partial tracts)
A) FHA, FSA/RHS & VA Home Purchase Loans
B) Conventional Home Purchase Loans
C) Refinancings
D) Home Improvement Loans
E) Loans on Dwellings For 5+ Families
F) Non-occupant Loans on < 5 Family Dwellings (A B C & D)
Number
Average Value
Number
Average Value
Number
Average Value
Number
Average Value
Number
Average Value
Number
Average Value
LOANS ORIGINATED
19
$114,222
533
$130,585
1,310
$133,001
34
$33,988
2
$105,935
108
$103,735
APPLICATIONS APPROVED, NOT ACCEPTED
1
$153,420
34
$127,128
118
$126,104
4
$30,662
0
$0
6
$90,755
APPLICATIONS DENIED
6
$107,983
59
$90,129
256
$115,703
22
$16,531
0
$0
15
$85,753
APPLICATIONS WITHDRAWN
6
$101,402
76
$139,751
171
$130,961
4
$82,950
0
$0
5
$110,902
FILES CLOSED FOR INCOMPLETENESS
0
$0
5
$122,098
40
$127,442
0
$0
0
$0
2
$38,625
Aggregated Statistics For Year 2001 (Based on 2 full and 16 partial tracts)
A) FHA, FSA/RHS & VA Home Purchase Loans
B) Conventional Home Purchase Loans
C) Refinancings
D) Home Improvement Loans
E) Loans on Dwellings For 5+ Families
F) Non-occupant Loans on < 5 Family Dwellings (A B C & D)
Number
Average Value
Number
Average Value
Number
Average Value
Number
Average Value
Number
Average Value
Number
Average Value
LOANS ORIGINATED
42
$112,980
639
$125,295
1,074
$128,199
65
$25,320
2
$4,272,800
69
$91,542
APPLICATIONS APPROVED, NOT ACCEPTED
3
$128,157
61
$107,618
86
$125,873
12
$42,095
0
$0
9
$74,936
APPLICATIONS DENIED
5
$95,790
80
$85,738
227
$102,016
44
$25,667
0
$0
17
$66,262
APPLICATIONS WITHDRAWN
5
$99,152
60
$134,644
161
$117,614
8
$40,729
0
$0
4
$116,122
FILES CLOSED FOR INCOMPLETENESS
0
$0
4
$222,980
28
$143,350
0
$0
0
$0
1
$75,280
Aggregated Statistics For Year 2000 (Based on 2 full and 16 partial tracts)
A) FHA, FSA/RHS & VA Home Purchase Loans
B) Conventional Home Purchase Loans
C) Refinancings
D) Home Improvement Loans
E) Loans on Dwellings For 5+ Families
F) Non-occupant Loans on < 5 Family Dwellings (A B C & D)
Number
Average Value
Number
Average Value
Number
Average Value
Number
Average Value
Number
Average Value
Number
Average Value
LOANS ORIGINATED
28
$86,187
510
$126,214
287
$105,471
69
$25,137
3
$8,462,353
38
$140,687
APPLICATIONS APPROVED, NOT ACCEPTED
8
$63,084
41
$106,990
38
$89,199
10
$32,478
0
$0
5
$54,400
APPLICATIONS DENIED
13
$49,491
143
$70,631
157
$81,789
26
$17,852
2
$103,695
10
$47,161
APPLICATIONS WITHDRAWN
9
$133,037
68
$105,428
103
$73,119
4
$9,948
0
$0
10
$80,224
FILES CLOSED FOR INCOMPLETENESS
0
$0
13
$103,032
25
$103,146
0
$0
0
$0
1
$45,940
Aggregated Statistics For Year 1999 (Based on 2 full and 8 partial tracts)
A) FHA, FSA/RHS & VA Home Purchase Loans
B) Conventional Home Purchase Loans
C) Refinancings
D) Home Improvement Loans
E) Loans on Dwellings For 5+ Families
F) Non-occupant Loans on < 5 Family Dwellings (A B C & D)
2004 - 2018 National Fire Incident Reporting System (NFIRS) incidents
Based on the data from the years 2004 - 2018 the average number of fires per year is 87. The highest number of fire incidents - 125 took place in 2016, and the least - 20 in 2004. The data has a growing trend.
When looking into fire subcategories, the most incidents belonged to: Structure Fires (47.9%), and Outside Fires (31.2%).
Fire incident types reported to NFIRS in Zip Code 29615


 Nearest zip codes: 29650, 29607, 29614, 29662, 29601, 29609.


 Based on the data from the years 2004 - 2018 the average number of fires per year is 87. The highest number of fire incidents - 125 took place in 2016, and the least - 20 in 2004. The data has a growing trend.
 When looking into fire subcategories, the most incidents belonged to: Structure Fires (47.9%), and Outside Fires (31.2%).