Estimated zip code population in 2022: 2,994 Zip code population in 2010: 2,756 Zip code population in 2000: 2,386
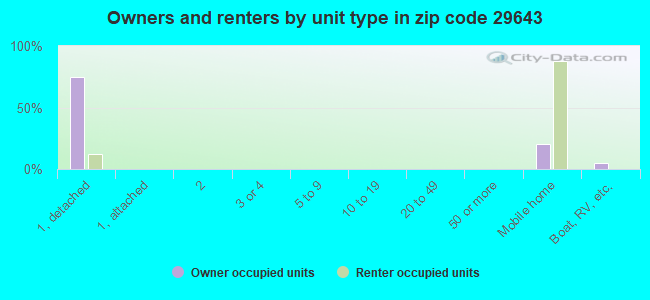
Houses and condos: 1,846 Renter-occupied apartments: 97
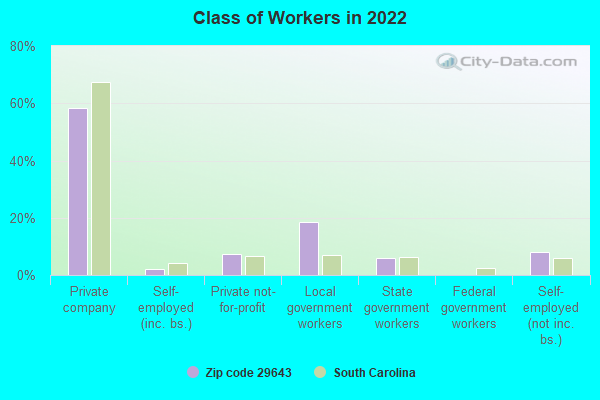
% of renters here:
8%
State:
28%
March 2022 cost of living index in zip code 29643: 80.8 (low, U.S. average is 100)
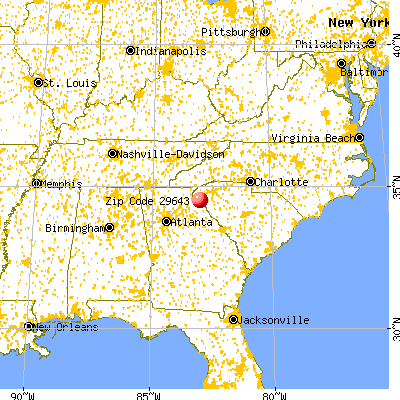
Land area: 26.8 sq. mi. Water area: 5.8 sq. mi.
Population density: 112 people per square mile
(very low).
OSM Map
General Map
Google Map
MSN Map
OSM Map
General Map
Google Map
MSN Map
OSM Map
General Map
Google Map
MSN Map
OSM Map
General Map
Google Map
MSN Map
Please wait while loading the map...
Real estate property taxes paid for housing units in 2022:
This zip code:
0.4% ($1,225)
South Carolina:
0.5% ($1,185)
Median real estate property taxes paid for housing units with mortgages in 2022: $1,353 (0.4%) Median real estate property taxes paid for housing units with no mortgage in 2022: $1,085 (0.4%)
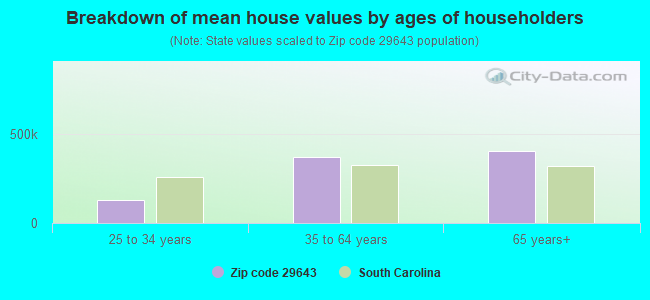
Estimated median house/condo value in 2022: $327,730
29643:
$327,730
South Carolina:
$254,600
According to our research of South Carolina and other state lists, there were 2 registered sex offenders living in 29643 zip code as of May 28, 2024. The ratio of all residents to sex offenders in zip code 29643 is 1,119 to 1. The ratio of registered sex offenders to all residents in this zip code is near the state average.
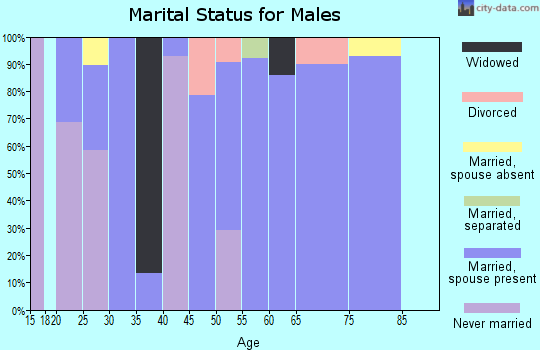
Median resident age:
This zip code:
47.0 years
South Carolina median age:
40.5 years
Average household size:
This zip code:
2.4 people
South Carolina:
2.4 people
Averages for the 2020 tax year for zip code 29643, filed in 2021:
Average Adjusted Gross Income (AGI) in 2020: $75,689 (Individual Income Tax Returns)
Here:
$75,689
State:
$65,754
Salary/wage: $60,522 (reported on 77.1% of returns)
Here:
$60,522
State:
$52,566
(% of AGI for various income ranges: 1172.4% for AGIs below $25k, 3646.4% for AGIs $25k-50k, 7143.3% for AGIs $50k-75k, 8710.0% for AGIs $75k-100k, 17581.0% for AGIs $100k-200k, 89925.0% for AGIs over 200k)
Taxable interest for individuals: $1,356 (reported on 32.1% of returns)
This zip code:
$1,356
South Carolina:
$1,749
(% of AGI for various income ranges: 16.9% for AGIs below $25k, 26.8% for AGIs $25k-50k, 85.0% for AGIs $50k-75k, 22.0% for AGIs $75k-100k, 176.0% for AGIs $100k-200k, 970.0% for AGIs over 200k)
Ordinary dividends: $12,523 (reported on 21.4% of returns)
Here:
$12,523
State:
$8,783
(% of AGI for various income ranges: 35.5% for AGIs below $25k, 37.2% for AGIs $25k-50k, 125.8% for AGIs $50k-75k, 135.0% for AGIs $75k-100k, 747.0% for AGIs $100k-200k, 12640.0% for AGIs over 200k)
Net capital gain/loss in AGI: +$17,746 (reported on 20.0% of returns)
Here:
+$17,746
State:
+$24,194
(% of AGI for various income ranges: 23.1% for AGIs below $25k, 49.6% for AGIs $25k-50k, 190.8% for AGIs $50k-75k, 145.0% for AGIs $75k-100k, 1233.0% for AGIs $100k-200k, 15855.0% for AGIs over 200k)
Profit/loss from business: +$9,374 (reported on 16.4% of returns)
Here:
+$9,374
State:
+$11,253
(% of AGI for various income ranges: 86.6% for AGIs below $25k, 149.6% for AGIs $25k-50k, 194.2% for AGIs $50k-75k, 105.0% for AGIs $75k-100k, 737.0% for AGIs $100k-200k, 2280.0% for AGIs over 200k)
Taxable individual retirement arrangement distribution: $24,432 (reported on 13.6% of returns)
29643:
$24,432
South Carolina:
$21,604
(% of AGI for various income ranges: 64.8% for AGIs below $25k, 165.2% for AGIs $25k-50k, 481.7% for AGIs $50k-75k, 632.0% for AGIs $75k-100k, 2831.0% for AGIs $100k-200k)
Total itemized deductions: $31,242 (reported on 8.6% of returns)
Here:
$31,242
State:
$35,199
(% of AGI for various income ranges: 790.8% for AGIs $50k-75k, 1489.0% for AGIs $100k-200k, 6555.0% for AGIs over 200k)
Charity contributions: $11,660 (reported on 7.1% of returns)
Here:
$11,660
State:
$14,319
(% of AGI for various income ranges: 70.8% for AGIs $25k-50k, 368.0% for AGIs $100k-200k, 3105.0% for AGIs over 200k)
Taxes paid: $7,873 (reported on 7.9% of returns)
29643:
$7,873
State:
$7,486
(% of AGI for various income ranges: 137.5% for AGIs $50k-75k, 411.0% for AGIs $100k-200k, 1450.0% for AGIs over 200k)
Earned income credit: $2,386 (reported on 15.7% of returns)
Here:
$2,386
State:
$2,397
(% of AGI for various income ranges: 116.2% for AGIs below $25k, 75.2% for AGIs $25k-50k)
Percentage of individuals using paid preparers for their 2020 taxes: 93.6%
Here:
94%
State:
93%
(% for various income ranges: 92.7% for AGIs below $25k, 93.9% for AGIs $25k-50k, 95.0% for AGIs $50k-75k, 93.3% for AGIs $75k-100k, 95.5% for AGIs $100k-200k, 88.9% for AGIs over 200k)
Averages for the 2012 tax year for zip code 29643, filed in 2013:
Average Adjusted Gross Income (AGI) in 2012: $48,571 (Individual Income Tax Returns)
Here:
$48,571
State:
$51,133
Salary/wage: $41,054 (reported on 76.3% of returns)
Here:
$41,054
State:
$42,173
(% of AGI for various income ranges: 69.7% for AGIs below $25k, 69.4% for AGIs $25k-50k, 71.4% for AGIs $50k-75k, 57.8% for AGIs $75k-100k, 61.0% for AGIs $100k-200k, 59.9% for AGIs over 200k)
Taxable interest for individuals: $1,687 (reported on 33.1% of returns)
This zip code:
$1,687
South Carolina:
$1,468
(% of AGI for various income ranges: 1.4% for AGIs below $25k, 2.3% for AGIs $25k-50k, 1.1% for AGIs $50k-75k, 0.5% for AGIs $75k-100k, 1.0% for AGIs $100k-200k, 0.4% for AGIs over 200k)
Ordinary dividends: $5,171 (reported on 20.3% of returns)
Here:
$5,171
State:
$6,511
(% of AGI for various income ranges: 1.8% for AGIs below $25k, 1.5% for AGIs $25k-50k, 1.0% for AGIs $50k-75k, 2.9% for AGIs $75k-100k, 4.2% for AGIs $100k-200k)
Net capital gain/loss in AGI: +$3,270 (reported on 16.9% of returns)
Here:
+$3,270
State:
+$13,061
(% of AGI for various income ranges: 0.4% for AGIs below $25k, 1.3% for AGIs $25k-50k, 0.3% for AGIs $50k-75k, 0.9% for AGIs $75k-100k, 2.7% for AGIs $100k-200k)
Profit/loss from business: +$6,833 (reported on 17.8% of returns)
Here:
+$6,833
State:
+$10,167
(% of AGI for various income ranges: 9.7% for AGIs below $25k, 3.4% for AGIs $25k-50k, 3.2% for AGIs $50k-75k, 0.3% for AGIs $75k-100k, 1.3% for AGIs $100k-200k)
Taxable individual retirement arrangement distribution: $18,135 (reported on 14.4% of returns)
29643:
$18,135
South Carolina:
$17,019
(% of AGI for various income ranges: 4.8% for AGIs below $25k, 4.7% for AGIs $25k-50k, 2.5% for AGIs $50k-75k, 7.4% for AGIs $75k-100k, 9.6% for AGIs $100k-200k)
Total itemized deductions: $21,818 (24% of AGI, reported on 28.8% of returns)
Here:
$21,818
State:
$22,890
Here:
23.7% of AGI
State:
21.4% of AGI
(% of AGI for various income ranges: 10.4% for AGIs below $25k, 9.2% for AGIs $25k-50k, 9.3% for AGIs $50k-75k, 16.2% for AGIs $75k-100k, 15.9% for AGIs $100k-200k, 14.9% for AGIs over 200k)
Charity contributions: $4,700 (reported on 23.7% of returns)
Here:
$4,700
State:
$5,169
(% of AGI for various income ranges: 1.4% for AGIs below $25k, 2.0% for AGIs $25k-50k, 1.7% for AGIs $50k-75k, 3.1% for AGIs $75k-100k, 2.8% for AGIs $100k-200k, 2.3% for AGIs over 200k)
Taxes paid: $6,736 (reported on 28.0% of returns)
29643:
$6,736
State:
$7,644
(% of AGI for various income ranges: 1.5% for AGIs below $25k, 1.5% for AGIs $25k-50k, 2.6% for AGIs $50k-75k, 4.4% for AGIs $75k-100k, 5.6% for AGIs $100k-200k, 6.8% for AGIs over 200k)
Earned income credit: $2,050 (reported on 22.0% of returns)
Here:
$2,050
State:
$2,418
(% of AGI for various income ranges: 6.9% for AGIs below $25k, 1.3% for AGIs $25k-50k)
Percentage of individuals using paid preparers for their 2012 taxes: 63.6%
Here:
64%
State:
57%
(% for various income ranges: 59.6% for AGIs below $25k, 69.0% for AGIs $25k-50k, 68.8% for AGIs $50k-75k, 58.3% for AGIs $75k-100k, 81.8% for AGIs $100k-200k)
Averages for the 2004 tax year for zip code 29643, filed in 2005:
Average Adjusted Gross Income (AGI) in 2004: $42,040 (Individual Income Tax Returns)
Here:
$42,040
State:
$41,965
Salary/wage: $36,204 (reported on 81.7% of returns)
Here:
$36,204
State:
$35,695
(% of AGI for various income ranges: 137.8% for AGIs below $10k, 68.2% for AGIs $10k-25k, 78.6% for AGIs $25k-50k, 70.1% for AGIs $50k-75k, 65.0% for AGIs $75k-100k, 64.7% for AGIs over 100k)
Taxable interest for individuals: $1,411 (reported on 40.1% of returns)
This zip code:
$1,411
South Carolina:
$1,623
(% of AGI for various income ranges: 4.2% for AGIs below $10k, 1.8% for AGIs $10k-25k, 1.7% for AGIs $25k-50k, 1.9% for AGIs $50k-75k, 0.9% for AGIs $75k-100k, 0.6% for AGIs over 100k)
Taxable dividends: $2,890 (reported on 20.0% of returns)
Here:
$2,890
State:
$3,999
(% of AGI for various income ranges: 3.1% for AGIs below $10k, 1.4% for AGIs $10k-25k, 0.4% for AGIs $25k-50k, 2.1% for AGIs $50k-75k, 1.8% for AGIs $75k-100k, 1.3% for AGIs over 100k)
Net capital gain/loss: +$5,131 (reported on 16.9% of returns)
Here:
+$5,131
State:
+$13,100
(% of AGI for various income ranges: -3.7% for AGIs below $10k, -0.1% for AGIs $10k-25k, 1.3% for AGIs $25k-50k, 0.9% for AGIs $50k-75k, 4.4% for AGIs $75k-100k, 3.2% for AGIs over 100k)
Profit/loss from business: +$8,413 (reported on 18.1% of returns)
Here:
+$8,413
State:
+$9,144
(% of AGI for various income ranges: -3.1% for AGIs below $10k, 6.9% for AGIs $10k-25k, 4.3% for AGIs $25k-50k, 2.3% for AGIs $50k-75k, -0.1% for AGIs $75k-100k, 5.4% for AGIs over 100k)
IRA payment deduction: $3,842 (reported on 1.8% of returns)
29643:
$3,842
South Carolina:
$2,972
Total itemized deductions: $17,859 (24% of AGI, reported on 33.4% of returns)
Here:
$17,859
State:
$19,039
Here:
24.2% of AGI
State:
22.8% of AGI
(% of AGI for various income ranges: 12.2% for AGIs $10k-25k, 11.8% for AGIs $25k-50k, 15.0% for AGIs $50k-75k, 17.7% for AGIs $75k-100k, 14.8% for AGIs over 100k)
Charity contributions deductions: $3,213 (4% of AGI, reported on 29.2% of returns)
Here:
$3,213
State:
$4,305
Here:
4.2% of AGI
State:
5.0% of AGI
(% of AGI for various income ranges: 1.7% for AGIs $10k-25k, 1.7% for AGIs $25k-50k, 3.0% for AGIs $50k-75k, 2.4% for AGIs $75k-100k, 2.3% for AGIs over 100k)
Total tax: $5,734 (reported on 74.7% of returns)
29643:
$5,734
State:
$6,497
(% of AGI for various income ranges: 4.3% for AGIs below $10k, 4.2% for AGIs $10k-25k, 6.4% for AGIs $25k-50k, 9.0% for AGIs $50k-75k, 9.4% for AGIs $75k-100k, 16.7% for AGIs over 100k)
Earned income credit: $1,617 (reported on 15.5% of returns)
Here:
$1,617
State:
$1,882
Percentage of individuals using paid preparers for their 2004 taxes: 69.5%
Here:
70%
State:
66%
(% for various income ranges: 64.5% for AGIs below $10k, 73.5% for AGIs $10k-25k, 66.4% for AGIs $25k-50k, 70.6% for AGIs $50k-75k, 71.8% for AGIs $75k-100k, 75.6% for AGIs over 100k)
Likely homosexual households (counted as self-reported same-sex unmarried-partner households)
Lesbian couples: 0.6% of all households
Gay men: 0.0% of all households
Household received Food Stamps/SNAP in the past 12 months: 73 Household did not receive Food Stamps/SNAP in the past 12 months: 1,153
Women who had a birth in the past 12 months: 33 (35 now married, 0 unmarried) Women who did not have a birth in the past 12 months: 525 (266 now married, 261 unmarried)
Housing units in zip code 29643 with a mortgage: 676 (74 second mortgage, 75 both second mortgage and home equity loan) Median monthly owner costs for units with a mortgage: $1,597 Median monthly owner costs for units without a mortgage: $388
Residents with income below the poverty level in 2022:
This zip code:
10.6%
Whole state:
14.0%
Residents with income below 50% of the poverty level in 2022:
This zip code:
8.4%
Whole state:
7.3%
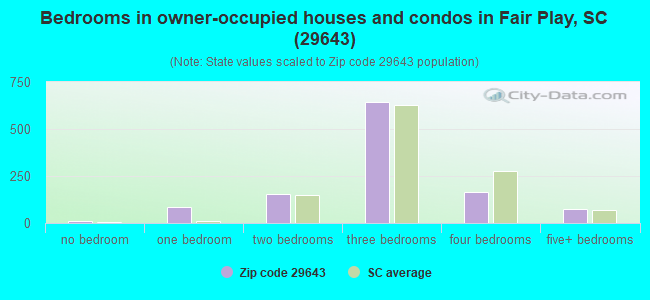
Median number of rooms in houses and condos:
Here:
6.5
State:
6.4
Median number of rooms in apartments:
Here:
5.1
State:
4.5
Notable locations in this zip code not listed on our city pages
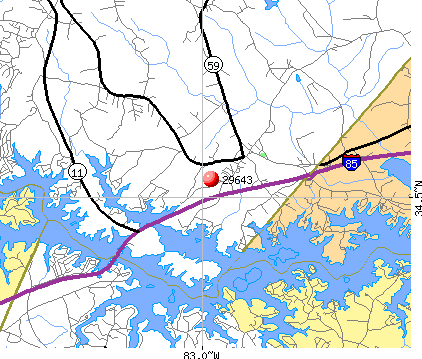
Churches in zip code 29643 include: Rock Hill Church (A), Fair Play Presbyterian Church (B), Saint Annes Church (C), Beaverdam Baptist Church (D), Snow Hill Baptist Church (E). Display/hide their locations on the map
Size of family households: 634 2-persons, 85 3-persons, 104 4-persons, 191 5-persons
Size of nonfamily households: 170 1-person, 35 2-persons, 13 5-persons
538 married couples with children.
10 single-parent households (10 men).
95.9% of residents of 29643 zip code speak English at home.
1.6% of residents speak Spanish at home (76% very well, 24% well).
2.8% of residents speak other Indo-European language at home (77% very well, 23% well).
0.3% of residents speak Asian or Pacific Island language at home (100% very well).
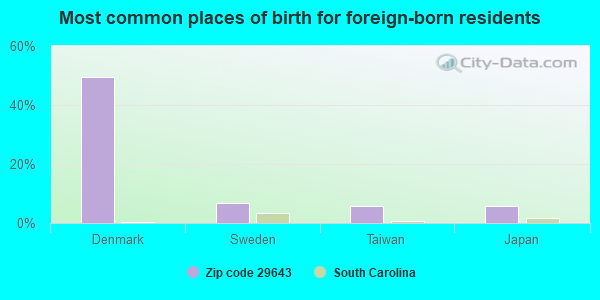
Foreign born population: 108 (3.6%) (80.9% of them are naturalized citizens)
This zip code:
3.6%
Whole state:
5.2%
50%Denmark
7%Sweden
6%Taiwan
6%Japan
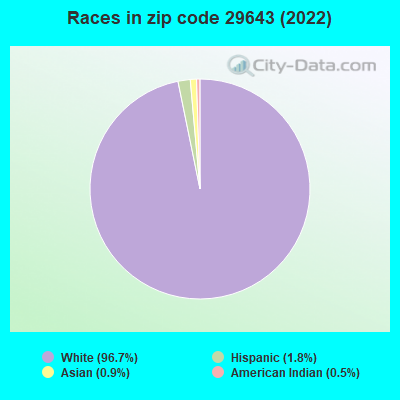
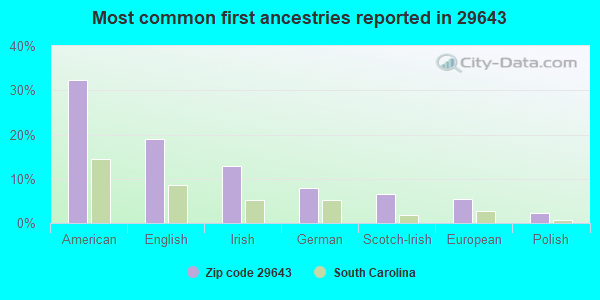
32%American
19%English
13%Irish
8%German
7%Scotch-Irish
5%European
2%Polish
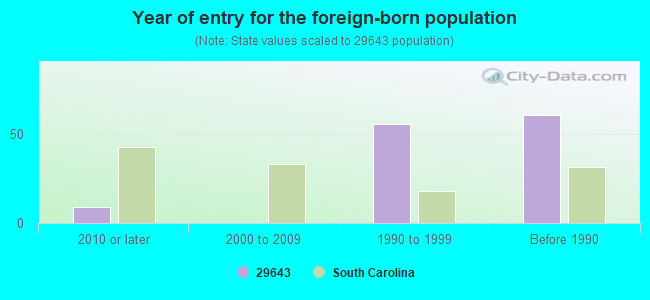
Year of entry for the foreign-born population
92010 or later
02000 to 2009
561990 to 1999
61Before 1990
Facilities with environmental interests located in this zip code:
CHICKASAW POINTE SD (ON CHICKASAW POINT in FAIR PLAY, SC)
National Pollutant Discharge Elimination System NON-MAJOR (Tracking pollutant discharge elimination systems) - permit Business SIC classification: OPERATORS OF DWELLINGS OTHER THAN APARTMENT BUILDINGS
Housing units lacking complete kitchen facilities: 2.4%
77.0%Electricity
15.9%Bottled, tank, or LP gas
7.1%Utility gas
Population in 1990: 6,110.
Place of birth for U.S.-born residents:
This state: 1,284
Northeast: 336
Midwest: 505
South: 695
West: 53
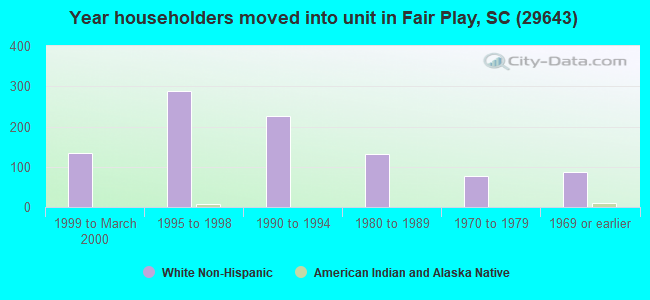
58% of the 29643 zip code residents lived in the same house 5 years ago. Out of people who lived in different houses, 45% lived in this county. Out of people who lived in different counties, 50% lived in South Carolina.
86% of the 29643 zip code residents lived in the same house 1 year ago. Out of people who lived in different houses, 12% moved from this county. Out of people who lived in different houses, 2% moved from different county within same state. Out of people who lived in different houses, 99% moved from different state.
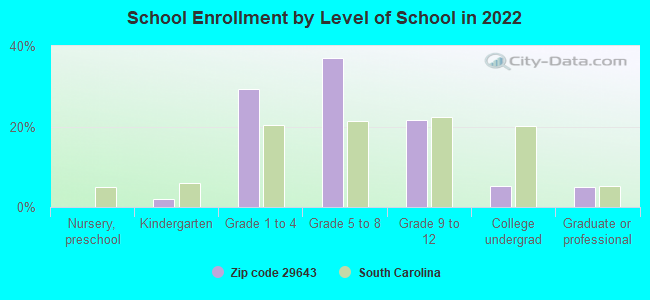
Private vs. public school enrollment:
Students in private schools in grades 1 to 8 (elementary and middle school): 110
Here:
29.3%
South Carolina:
14.4%
Students in private schools in grades 9 to 12 (high school):
Here:
0.0%
South Carolina:
11.1%
Students in private undergraduate colleges:
Here:
0.0%
South Carolina:
21.9%
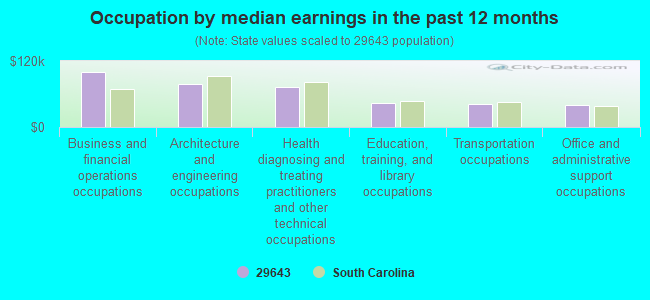
Occupation by median earnings in the past 12 months ($)
99,589Business and financial operations occupations
78,389Architecture and engineering occupations
72,188Health diagnosing and treating practitioners and other technical occupations
43,733Education, training, and library occupations
41,581Transportation occupations
40,572Office and administrative support occupations
Companies with federal contracts located in this zip code:
AMERICAN PHOTOGRAPHIC SERVICE (901 E FAIR PLAY BLVD in FAIR PLAY, SC; small business) : $62,676 in 3 contractsfrom 2003 to 2006
$46,535 with Army for Photographic Developing and Finishing Equipment. Signed on 2003-08-25. Completion date: 2003-10-14.
$10,141 with Army for Photographic Equipment and Accessories. Signed on 2006-02-06. Completion date: 2006-12-31.
$6,000 with Army for Photographic Developing and Finishing Equipment. Signed on 2004-08-11. Completion date: 2005-09-01.
HART CONSOLIDATED INDUSTRIES I (198 CONNER BLVD in FAIR PLAY, SC; small business)
$30,071 with Army for Prefabricated and Portable Buildings. Taking place in GA. Signed on 2000-09-28. Completion date: 2000-07-31.
FAIR PLAY EQUIPMENT SLS & SVC (1175 HIGHWAY 182 in FAIR PLAY, SC; small business) : $30,000 in 2 contractsfrom 2004 to 2005
$21,600 with Defense Logistics Agency for Winches, Hoists, Cranes, and Derricks. Taking place in NJ. Signed on 2004-10-25. Completion date: 2005-03-04.
$8,400 with Defense Logistics Agency for Winches, Hoists, Cranes, and Derricks. Taking place in FL. Signed on 2005-02-03. Completion date: 2005-03-19.
Top industries in this zip code by the number of employees in 2005:
Construction: Poured Concrete Foundation and Structure Contractors (50-99 employees: 1 establishment, 20-49 employees: 1 establishment)
Educational Services: Elementary and Secondary Schools (20-49: 1)
Construction: New Single-Family Housing Construction (except Operative Builders) (10-19: 1, 1-4: 3)
Health Care and Social Assistance: Homes for the Elderly (10-19: 1)
Wholesale Trade: Photographic Equipment and Supplies Merchant Wholesalers (10-19: 1)
Accommodation and Food Services: RV (Recreational Vehicle) Parks and Campgrounds (10-19: 1)
Wholesale Trade: Motor Vehicle Supplies and New Parts Merchant Wholesalers (10-19: 1)
People in group quarters in 2010:
28 people in group homes for juveniles (non-correctional)
14 people in nursing facilities/skilled-nursing facilities
Fatal accident statistics in 2012:
Fatal accident count: 2
Vehicles involved in fatal accidents: 3
Fatal accidents caused by drunken drivers: 1
Fatalities: 2
Persons involved in fatal accidents: 3
Pedestrians involved in fatal accidents: 0
Fatal accident statistics in 2010:
Fatal accident count: 3
Vehicles involved in fatal accidents: 6
Fatal accidents caused by drunken drivers: 1
Fatalities: 3
Persons involved in fatal accidents: 5
Pedestrians involved in fatal accidents: 1
2002 - 2018 National Fire Incident Reporting System (NFIRS) incidents
Based on the data from the years 2002 - 2018 the average number of fires per year is 42. The highest number of fires - 94 took place in 2016, and the least - 20 in 2012. The data has a decreasing trend.
When looking into fire subcategories, the most incidents belonged to: Outside Fires (34.2%), and Structure Fires (31.4%).
Fire incident types reported to NFIRS in Zip Code 29643


 Nearest zip codes: 30553, 29689, 29678, 30516, 30643, 30557.


 Based on the data from the years 2002 - 2018 the average number of fires per year is 42. The highest number of fires - 94 took place in 2016, and the least - 20 in 2012. The data has a decreasing trend.
 When looking into fire subcategories, the most incidents belonged to: Outside Fires (34.2%), and Structure Fires (31.4%).