Estimated zip code population in 2022: 350
Zip code population in 2010: 127
Zip code population in 2000: 52
March 2022 cost of living index in zip code 29665: 75.9
(low, U.S. average is 100)
Land area: 0.2
sq. mi.
Water area: 0.0
sq. mi.
| Population density: 1,665 people per square mile | | (low). |
![Age and Sex of Residents in zip code 29665]()
- OSM Map
- General Map
- Google Map
- MSN Map
- OSM Map
- General Map
- Google Map
- MSN Map
- OSM Map
- General Map
- Google Map
- MSN Map
- OSM Map
- General Map
- Google Map
- MSN Map
Please wait while loading the map...
Real estate property taxes paid for housing units in 2022:
| This zip code: | 0.3% ($483) |
| South Carolina: | 0.5% ($1,185) |
$503 (0.4%)
Business Search - 14 Million verified businesses
| Males: 200 |  (57.3%) (57.3%) |
| Females: 149 |  (42.7%) (42.7%) |
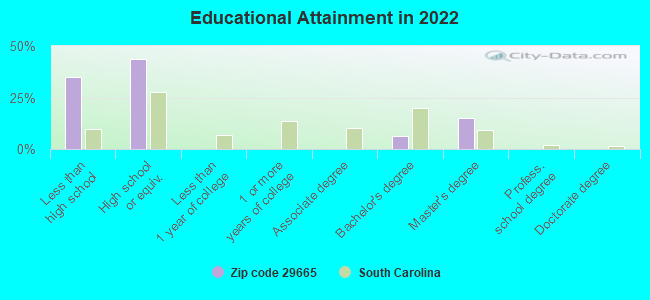
For population 25 years and over in 29665:
- High school or higher: 65.5%
- Bachelor's degree or higher: 21.6%
- Graduate or professional degree: 15.2%
- Mean travel time to work (commute): 82.4 minutes
For population 15 years and over in 29665:
- Never married: 25.4%
- Now married: 72.1%
- Separated: 0.0%
- Widowed: 2.5%
- Divorced: 0.0%
Zip code 29665 compared to state average:
- Median house value below state average.
- Unemployed percentage significantly below state average.
- Black race population percentage significantly below state average.
- Hispanic race population percentage significantly above state average.
- Median age significantly above state average.
- Foreign-born population percentage significantly above state average.
- Renting percentage significantly below state average.
- Length of stay since moving in significantly above state average.
- House age significantly above state average.
- Number of college students significantly below state average.

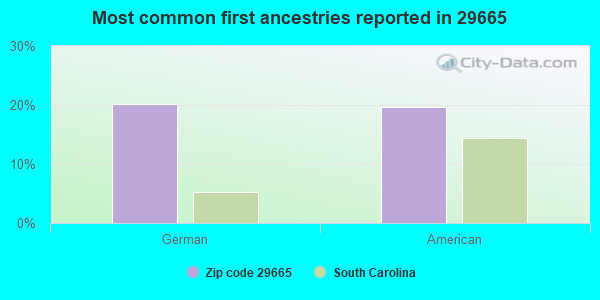
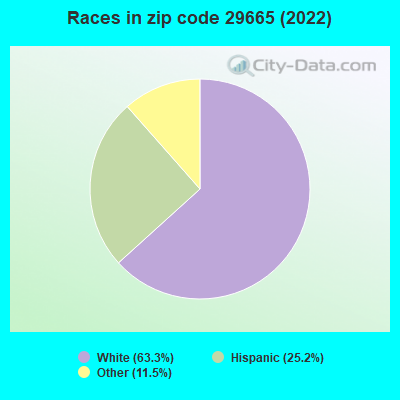
- 22163.3%White
- 8825.2%Hispanic or Latino
- 4011.5%Some other race
Data:
100%
rural population.
Estimated median house/condo value in 2022: $159,331
| 29665: | $159,331 |
| South Carolina: | $254,600 |
Median resident age:| This zip code: | 58.7 years |
| South Carolina median age: | 40.5 years |
Average household size:| This zip code: | 2.2 people |
| South Carolina: | 2.4 people |
Averages for the 2004 tax year for zip code 29665, filed in 2005:
Average Adjusted Gross Income (AGI) in 2004: $26,013 (Individual Income Tax Returns)
| Here: | $26,013 |
| State: | $41,965 |
Salary/wage: $26,132 (reported on 90.7% of returns)
| Here: | $26,132 |
| State: | $35,695 |
(% of AGI for various income ranges: 68.6% for AGIs below $10k, 83.3% for AGIs $10k-25k, 100.1% for AGIs $25k-50k, 90.0% for AGIs $50k-75k)
Taxable interest for individuals: $71 (reported on 18.7% of returns)
| This zip code: | $71 |
| South Carolina: | $1,623 |
Total tax: $2,273 (reported on 73.3% of returns)
Earned income credit: $1,350 (reported on 26.7% of returns)
Percentage of individuals using paid preparers for their 2004 taxes: 60.0%
Estimated median household income in 2022: | This zip code: | $42,879 |
| South Carolina: | $64,115 |
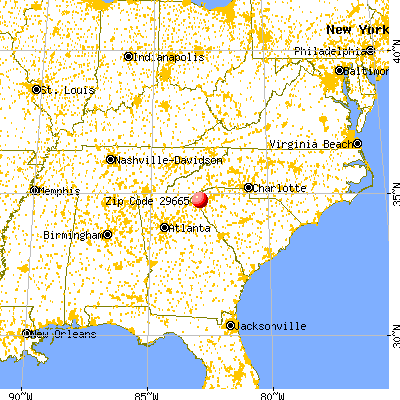
![Newry, SC (29665) map]() Nearest zip codes: 29672
Nearest zip codes: 29672,
29634,
29678,
29631,
29696,
29630.
Newry Zip Code Map
Percentage of family households:| This zip code: | 40.9% |
| South Carolina: | 44.7% |
Percentage of households with unmarried partners:| This zip code: | 0.0% |
| South Carolina: | 47.7% |
No gay or lesbian households reported
Household received Food Stamps/SNAP in the past 12 months: 50
Household did not receive Food Stamps/SNAP in the past 12 months: 111
Women who did not have a birth in the past 12 months: 54 (30 now married, 24 unmarried)
Housing units in zip code 29665 with a mortgage: 10
Residents with income below the poverty level in 2022:
| This zip code: | 25.1% |
| Whole state: | 14.0% |
Median number of rooms in houses and condos:

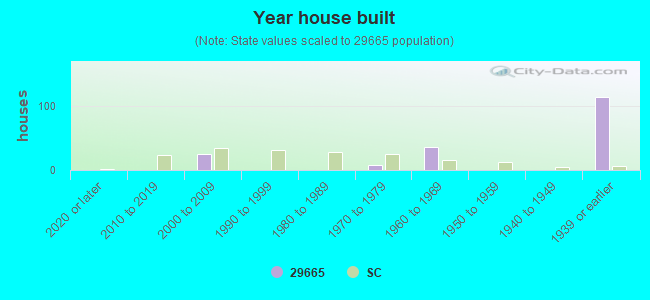
- Year house built (houses)
- 02020 or later
- 02010 to 2019
- 252000 to 2009
- 01990 to 1999
- 01980 to 1989
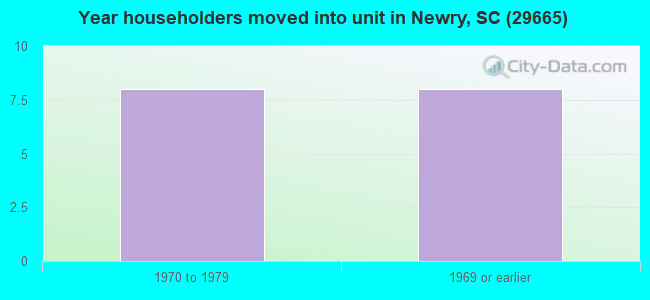
- 81970 to 1979
- 361960 to 1969
- 01950 to 1959
- 01940 to 1949
- 1141939 or earlier
![Zip code 29665 satellite photo by USGS]()
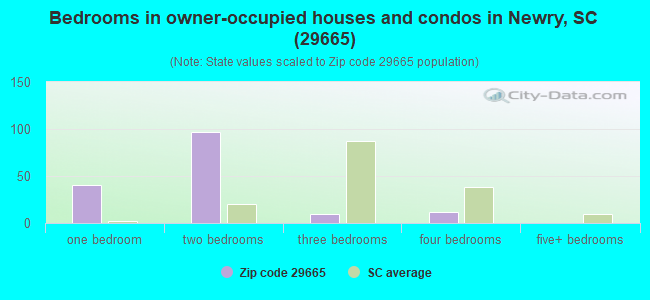
- Bedrooms in owner-occupied houses and condos in Newry, SC (29665)
- 0no bedroom
- 411 bedroom
- 972 bedrooms
- 103 bedrooms
- 114 bedrooms
- 05+ bedrooms
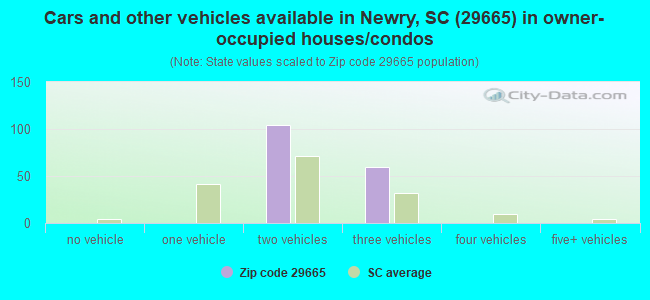
- Cars and other vehicles available in Newry, SC (29665) in owner-occupied houses/condos
- 0no vehicle
- 01 vehicle
- 1042 vehicles
- 603 vehicles
- 04 vehicles
- 05+ vehicles
Zip code 29665 household income distribution in 2022
![Zip code 29665 household income distribution in 2022]()
- 38Less than $10,000
- 37$25,000 to $29,999
- 55$40,000 to $44,999
- 10$50,000 to $59,999
- 18$60,000 to $74,999
Estimate of home value of owner-occupied houses/condos in 2022 in zip code 29665
![Estimate of home value of owner-occupied houses/condos in 2022 in zip code 29665]()
- 9$25,000 to $29,999
- 33$50,000 to $59,999
- 6$90,000 to $99,999
- 25$125,000 to $149,999
- 16$200,000 to $249,999
- 52$750,000 to $999,999
Estimated median house (or condo) value in 2022 for:
- White Non-Hispanic householders: $159,331
Estimated median house or condo value in 2022: $159,331
| 29665: | $159,331 |
| South Carolina: | $254,600 |
Mean price in 2022:
Detached houses: $18,002| Here: | $18,002 |
| State: | $368,255 |
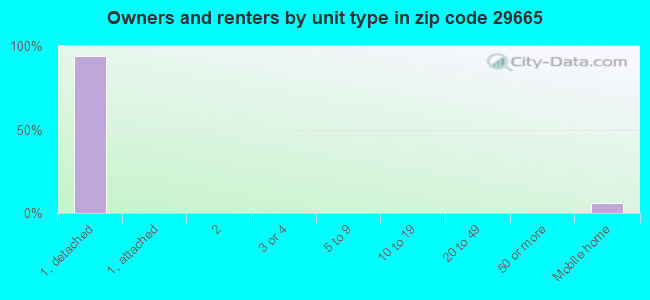
Housing units in structures:
- One, detached: 173
- 3 or 4: 14
- Mobile homes: 8
Means of transportation to work in zip code 29665
![Means of transportation to work in zip code 29665]()
- 50.9%17Drove a car alone
- 44.9%15Carpooled
Travel time to work (commute) in zip code 29665
![Travel time to work (commute) in zip code 29665]()
- 510 to 14 minutes
- 1720 to 24 minutes
- 1025 to 29 minutes
Percentage of zip code residents living and working in this county: 45.5%
Household type by relationship:
Households: 350
- Male householders: 121 (50 living alone), Female householders: 38 (0 living alone)
133 spouses (133 opposite-sex spouses), 0 unmarried partners, (0 opposite-sex unmarried partners), 63 children (38 natural, 0 adopted, 26 stepchildren), 0 grandchildren, 0 brothers or sisters, 0 parents, 0 foster children, 0 other relatives, 0 non-relatives
Size of family households: 84 2-persons, 17 3-persons, 11 7-or-more-persons
Size of nonfamily households: 50 1-person
40 married couples with children.
0 single-parent households ().
90.6% of residents of 29665 zip code speak English at home.
11.1% of residents speak Spanish at home (100% very well).
Foreign born population: 94 (26.9%)
(100.0%
of them are naturalized citizens)
| This zip code: | 26.9% |
| Whole state: | 5.2% |
- Year of entry for the foreign-born population
- 02010 or later
- 02000 to 2009
- 311990 to 1999
- 48Before 1990
10.7%
Housing units lacking complete kitchen facilities: 10.0%
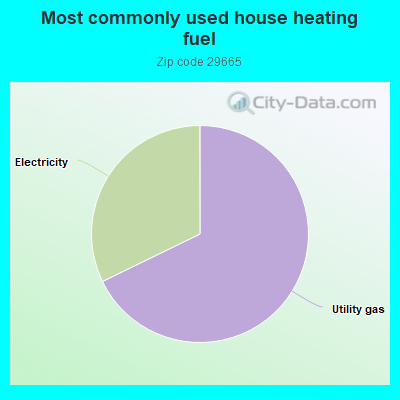
- 68.4%Utility gas
- 32.5%Electricity
Place of birth for U.S.-born residents:
81% of the 29665 zip code residents lived in the same house 5 years ago.
Out of people who lived in different houses, 100% lived in this county.
97% of the 29665 zip code residents lived in the same house 1 year ago.
Out of people who lived in different houses, 78% moved from this county.
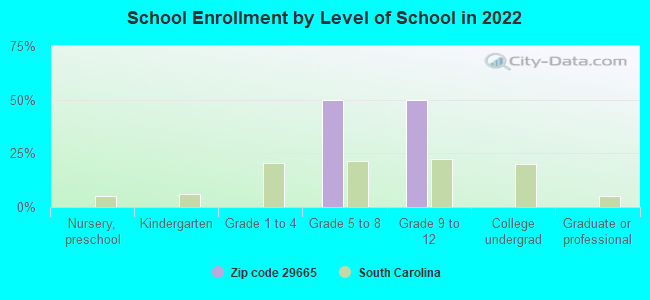
Private vs. public school enrollment:
Students in private schools in grades 1 to 8 (elementary and middle school):
| Here: | 0.0% |
| South Carolina: | 14.4% |
| Here: | 0.0% |
| South Carolina: | 11.1% |
Top industries in this zip code by the number of employees in 2005:
- Other Services (except Public Administration): Religious Organizations (1-4 employees: 1 establishment)
- Construction: Finish Carpentry Contractors (1-4: 1)
| Most common first names in zip code 29665 among deceased individuals |
| Name | Count | Lived (average) |
|---|
| William | 7 | 72.9 years |
| James | 6 | 75.8 years |
| Charles | 3 | 52.4 years |
| Mary | 3 | 74.6 years |
| Ruby | 3 | 79.3 years |
| Albert | 2 | 83.0 years |
| Corrie | 2 | 73.5 years |
| Clifton | 2 | 81.5 years |
| Gladys | 2 | 85.5 years |
| Eva | 2 | 68.0 years |
| Most common last names in zip code 29665 among deceased individuals |
| Last name | Count | Lived (average) |
|---|
| Williams | 8 | 79.1 years |
| Goss | 7 | 78.3 years |
| Carver | 5 | 73.0 years |
| Chambers | 5 | 63.0 years |
| Alexander | 4 | 84.7 years |
| Long | 4 | 79.0 years |
| Butts | 4 | 83.8 years |
| Taylor | 4 | 79.0 years |
| Davis | 3 | 81.3 years |
| Blackwell | 3 | 78.0 years |


 Nearest zip codes: 29672, 29634, 29678, 29631, 29696, 29630.