Estimated median house/condo value in 2022: $274,973
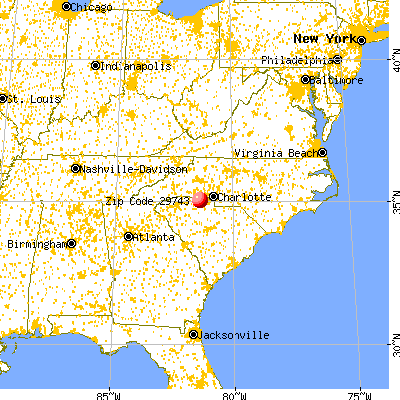
29743:
$274,973
South Carolina:
$254,600
Median resident age:
This zip code:
31.0 years
South Carolina median age:
40.5 years
Average household size:
This zip code:
2.8 people
South Carolina:
2.4 people
Averages for the 2020 tax year for zip code 29743, filed in 2021:
Average Adjusted Gross Income (AGI) in 2020: $54,993 (Individual Income Tax Returns)
Here:
$54,993
State:
$65,754
Salary/wage: $49,402 (reported on 83.3% of returns)
Here:
$49,402
State:
$52,566
(% of AGI for various income ranges: 1046.2% for AGIs below $25k, 3752.0% for AGIs $25k-50k, 7245.0% for AGIs $50k-75k, 10180.0% for AGIs $75k-100k, 15490.0% for AGIs $100k-200k)
Taxable interest for individuals: $308 (reported on 20.0% of returns)
This zip code:
$308
South Carolina:
$1,749
(% of AGI for various income ranges: 9.3% for AGIs $25k-50k, 6.7% for AGIs $50k-75k, 31.7% for AGIs $100k-200k)
Ordinary dividends: $814 (reported on 11.7% of returns)
Here:
$814
State:
$8,783
(% of AGI for various income ranges: 10.8% for AGIs below $25k, 36.7% for AGIs $50k-75k, 35.0% for AGIs $100k-200k)
Net capital gain/loss in AGI: +$2,383 (reported on 10.0% of returns)
Here:
+$2,383
State:
+$24,194
(% of AGI for various income ranges: 18.3% for AGIs $50k-75k, 220.0% for AGIs $100k-200k)
Profit/loss from business: +$8,875 (reported on 13.3% of returns)
Here:
+$8,875
State:
+$11,253
(% of AGI for various income ranges: 227.7% for AGIs below $25k, 229.3% for AGIs $25k-50k, 175.0% for AGIs $75k-100k)
Taxable individual retirement arrangement distribution: $14,950 (reported on 6.7% of returns)
29743:
$14,950
South Carolina:
$21,604
(% of AGI for various income ranges: 996.7% for AGIs $50k-75k)
Total itemized deductions: $21,750 (reported on 3.3% of returns)
Here:
$21,750
State:
$35,199
(% of AGI for various income ranges: 290.0% for AGIs $25k-50k)
Earned income credit: $2,117 (reported on 20.0% of returns)
Here:
$2,117
State:
$2,397
(% of AGI for various income ranges: 103.8% for AGIs below $25k, 79.3% for AGIs $25k-50k)
Percentage of individuals using paid preparers for their 2020 taxes: 95.0%
Here:
95%
State:
93%
(% for various income ranges: 94.4% for AGIs below $25k, 94.4% for AGIs $25k-50k, 88.9% for AGIs $50k-75k, 100.0% for AGIs $75k-100k, 100.0% for AGIs $100k-200k)
Averages for the 2012 tax year for zip code 29743, filed in 2013:
Average Adjusted Gross Income (AGI) in 2012: $40,231 (Individual Income Tax Returns)
Here:
$40,231
State:
$51,133
Salary/wage: $38,355 (reported on 85.7% of returns)
Here:
$38,355
State:
$42,173
(% of AGI for various income ranges: 63.7% for AGIs below $25k, 85.2% for AGIs $25k-50k, 89.9% for AGIs $50k-75k, 81.0% for AGIs $75k-100k, 79.4% for AGIs $100k-200k)
Taxable interest for individuals: $555 (reported on 22.4% of returns)
This zip code:
$555
South Carolina:
$1,468
(% of AGI for various income ranges: 0.6% for AGIs below $25k, 0.3% for AGIs $25k-50k, 0.4% for AGIs $50k-75k, 0.3% for AGIs $75k-100k)
Ordinary dividends: $533 (reported on 12.2% of returns)
Here:
$533
State:
$6,511
Net capital gain/loss in AGI: +$525 (reported on 8.2% of returns)
Here:
+$525
State:
+$13,061
Profit/loss from business: +$6,033 (reported on 12.2% of returns)
Here:
+$6,033
State:
+$10,167
Taxable individual retirement arrangement distribution: $5,900 (reported on 6.1% of returns)
29743:
$5,900
South Carolina:
$17,019
(% of AGI for various income ranges: 7.1% for AGIs below $25k)
Total itemized deductions: $17,680 (21% of AGI, reported on 20.4% of returns)
Here:
$17,680
State:
$22,890
Here:
21.5% of AGI
State:
21.4% of AGI
(% of AGI for various income ranges: 6.1% for AGIs $25k-50k, 8.7% for AGIs $50k-75k, 14.6% for AGIs $75k-100k, 14.7% for AGIs $100k-200k)
Charity contributions: $3,212 (reported on 16.3% of returns)
Here:
$3,212
State:
$5,169
(% of AGI for various income ranges: 1.2% for AGIs below $25k, 1.3% for AGIs $50k-75k, 2.8% for AGIs $75k-100k, 2.1% for AGIs $100k-200k)
Taxes paid: $6,010 (reported on 20.4% of returns)
29743:
$6,010
State:
$7,644
(% of AGI for various income ranges: 1.1% for AGIs $25k-50k, 2.9% for AGIs $50k-75k, 5.2% for AGIs $75k-100k, 6.2% for AGIs $100k-200k)
Earned income credit: $2,354 (reported on 26.5% of returns)
Here:
$2,354
State:
$2,418
(% of AGI for various income ranges: 8.6% for AGIs below $25k, 1.6% for AGIs $25k-50k)
Percentage of individuals using paid preparers for their 2012 taxes: 69.4%
Here:
69%
State:
57%
(% for various income ranges: 61.9% for AGIs below $25k, 73.3% for AGIs $25k-50k, 85.7% for AGIs $50k-75k, 133.3% for AGIs $75k-100k)
Averages for the 2004 tax year for zip code 29743, filed in 2005:
Average Adjusted Gross Income (AGI) in 2004: $34,325 (Individual Income Tax Returns)
Here:
$34,325
State:
$41,965
Salary/wage: $31,440 (reported on 88.2% of returns)
Here:
$31,440
State:
$35,695
(% of AGI for various income ranges: 101.2% for AGIs below $10k, 82.5% for AGIs $10k-25k, 82.9% for AGIs $25k-50k, 87.1% for AGIs $50k-75k, 78.1% for AGIs $75k-100k, 67.2% for AGIs over 100k)
Taxable interest for individuals: $813 (reported on 30.5% of returns)
This zip code:
$813
South Carolina:
$1,623
(% of AGI for various income ranges: 1.9% for AGIs below $10k, 1.2% for AGIs $10k-25k, 0.8% for AGIs $25k-50k, 0.2% for AGIs $50k-75k, 0.4% for AGIs $75k-100k, 0.9% for AGIs over 100k)
Taxable dividends: $638 (reported on 11.8% of returns)
Here:
$638
State:
$3,999
(% of AGI for various income ranges: 1.2% for AGIs below $10k, 0.2% for AGIs $25k-50k, 0.3% for AGIs $50k-75k, 0.3% for AGIs over 100k)
Net capital gain/loss: +$3,381 (reported on 8.5% of returns)
Here:
+$3,381
State:
+$13,100
Profit/loss from business: +$4,772 (reported on 11.6% of returns)
Here:
+$4,772
State:
+$9,144
(% of AGI for various income ranges: 13.5% for AGIs below $10k, 4.7% for AGIs $10k-25k, 2.6% for AGIs $25k-50k, -0.6% for AGIs $50k-75k)
Total itemized deductions: $15,680 (24% of AGI, reported on 20.3% of returns)
Here:
$15,680
State:
$19,039
Here:
23.6% of AGI
State:
22.8% of AGI
(% of AGI for various income ranges: 27.5% for AGIs below $10k, 7.9% for AGIs $25k-50k, 7.6% for AGIs $50k-75k, 15.0% for AGIs $75k-100k, 13.7% for AGIs over 100k)
Charity contributions deductions: $3,487 (5% of AGI, reported on 15.9% of returns)
Here:
$3,487
State:
$4,305
Here:
4.6% of AGI
State:
5.0% of AGI
(% of AGI for various income ranges: 0.8% for AGIs $25k-50k, 1.4% for AGIs $50k-75k, 3.7% for AGIs $75k-100k, 3.4% for AGIs over 100k)
Total tax: $4,255 (reported on 67.7% of returns)
29743:
$4,255
State:
$6,497
(% of AGI for various income ranges: 2.8% for AGIs below $10k, 3.4% for AGIs $10k-25k, 6.2% for AGIs $25k-50k, 8.2% for AGIs $50k-75k, 10.7% for AGIs $75k-100k, 14.9% for AGIs over 100k)
Earned income credit: $1,667 (reported on 21.3% of returns)
Here:
$1,667
State:
$1,882
Percentage of individuals using paid preparers for their 2004 taxes: 69.3%
Here:
69%
State:
66%
(% for various income ranges: 56.1% for AGIs below $10k, 69.8% for AGIs $10k-25k, 74.2% for AGIs $25k-50k, 79.4% for AGIs $50k-75k, 77.3% for AGIs $75k-100k, 63.6% for AGIs over 100k)
Household received Food Stamps/SNAP in the past 12 months: 1 Household did not receive Food Stamps/SNAP in the past 12 months: 699
Women who did not have a birth in the past 12 months: 493 (268 now married, 227 unmarried)
Housing units in zip code 29743 with a mortgage: 325 Median monthly owner costs for units with a mortgage: $1,941 Median monthly owner costs for units without a mortgage: $339
Residents with income below the poverty level in 2022:
This zip code:
3.5%
Whole state:
14.0%
Residents with income below 50% of the poverty level in 2022:
This zip code:
1.5%
Whole state:
7.3%
Median number of rooms in houses and condos:
Here:
5.4
State:
6.4
Median number of rooms in apartments:
Here:
6.1
State:
4.5
Notable locations in this zip code not listed on our city pages
Churches in zip code 29743 include: New Zion Methodist Church (A), Smyrna Associate Reformed Presbyterian Church (B), Mount Enon Church (C), Ebenezer Methodist Church (D), Broad River Baptist Church (E), Mount Sinai Church (F). Display/hide their locations on the map
Size of family households: 299 2-persons, 70 3-persons, 53 4-persons, 89 5-persons, 9 7-or-more-persons
Size of nonfamily households: 136 1-person, 45 2-persons
142 married couples with children.
22 single-parent households (3 men, 19 women).
73.8% of residents of 29743 zip code speak English at home.
18.8% of residents speak Spanish at home (48% very well, 35% well, 17% not well).
6.6% of residents speak other Indo-European language at home (100% very well).
0.3% of residents speak Asian or Pacific Island language at home (100% very well).
Foreign born population: 306 (15.6%) (25.3% of them are naturalized citizens)
This zip code:
15.6%
Whole state:
5.2%
83%Honduras
9%France
23%German
21%American
13%English
11%Irish
3%Scotch-Irish
1%Italian
1%Scottish
Year of entry for the foreign-born population
992010 or later
02000 to 2009
1661990 to 1999
44Before 1990
Facilities with environmental interests located in this zip code:
EAGLE CONST/CARL PARKER PIT (4511 BLACK HWY in SMYRNA, SC)
National Pollutant Discharge Elimination System NON-MAJOR (Tracking pollutant discharge elimination systems) - permit Business SIC classification: MISCELLANEOUS NONMETALLIC MINERALS, EXCEPT FUELS
Housing units lacking complete plumbing facilities: 3.9% Housing units lacking complete kitchen facilities: 4.1%
91.1%Electricity
4.5%Bottled, tank, or LP gas
2.0%Wood
1.5%Fuel oil, kerosene, etc.
1.4%Utility gas
Population in 1990: 877. Population change in the 1990s: +241 (+27.5%).
Place of birth for U.S.-born residents:
This state: 624
Northeast: 63
Midwest: 24
South: 900
West: 20
61% of the 29743 zip code residents lived in the same house 5 years ago. Out of people who lived in different houses, 63% lived in this county. Out of people who lived in different counties, 50% lived in South Carolina.
96% of the 29743 zip code residents lived in the same house 1 year ago. Out of people who lived in different houses, 74% moved from different county within same state. Out of people who lived in different houses, 30% moved from different state.
Private vs. public school enrollment:
Students in private schools in grades 1 to 8 (elementary and middle school):
Here:
0.0%
South Carolina:
14.4%
Students in private schools in grades 9 to 12 (high school): 8
Here:
22.8%
South Carolina:
11.1%
Occupation by median earnings in the past 12 months ($)
49,140Management occupations
46,681Office and administrative support occupations
39,583Production occupations
36,594Transportation occupations
29,092Law enforcement workers including supervisors
27,953Installation, maintenance, and repair occupations
Top industries in this zip code by the number of employees in 2005:
Construction: Water and Sewer Line and Related Structures Construction (1-4 employees: 2 establishments)
Construction: Electrical Contractors (1-4: 1)
Other Services (except Public Administration): Commercial and Industrial Machinery and Equipment (except Automotive and Electronic) Repair and Maintenance (1-4: 1)
Other Services (except Public Administration): Religious Organizations (1-4: 1)
Construction: Industrial Building Construction (1-4: 1)
Administrative and Support and Waste Management and Remediation Services: Landscaping Services (1-4: 1)
Construction: New Single-Family Housing Construction (except Operative Builders) (1-4: 1)
Construction: Plumbing, Heating, and Air-Conditioning Contractors (1-4: 1)
Home Mortgage Disclosure Act Aggregated Statistics For Year 2009 (Based on 2 partial tracts)
A) FHA, FSA/RHS & VA Home Purchase Loans
B) Conventional Home Purchase Loans
C) Refinancings
D) Home Improvement Loans
F) Non-occupant Loans on < 5 Family Dwellings (A B C & D)
G) Loans On Manufactured Home Dwelling (A B C & D)
Number
Average Value
Number
Average Value
Number
Average Value
Number
Average Value
Number
Average Value
Number
Average Value
LOANS ORIGINATED
4
$133,062
5
$98,468
29
$141,261
3
$21,673
3
$112,997
4
$60,310
APPLICATIONS APPROVED, NOT ACCEPTED
0
$0
1
$49,320
4
$130,485
0
$0
0
$0
1
$49,320
APPLICATIONS DENIED
1
$122,860
3
$117,033
18
$126,648
2
$24,215
0
$0
4
$82,730
APPLICATIONS WITHDRAWN
1
$163,670
1
$122,860
12
$142,180
0
$0
0
$0
2
$90,130
FILES CLOSED FOR INCOMPLETENESS
0
$0
0
$0
2
$165,685
0
$0
0
$0
1
$24,660
Aggregated Statistics For Year 2008 (Based on 2 partial tracts)
A) FHA, FSA/RHS & VA Home Purchase Loans
B) Conventional Home Purchase Loans
C) Refinancings
D) Home Improvement Loans
F) Non-occupant Loans on < 5 Family Dwellings (A B C & D)
G) Loans On Manufactured Home Dwelling (A B C & D)
Number
Average Value
Number
Average Value
Number
Average Value
Number
Average Value
Number
Average Value
Number
Average Value
LOANS ORIGINATED
4
$155,482
9
$91,224
24
$137,603
4
$45,625
4
$80,488
6
$52,015
APPLICATIONS APPROVED, NOT ACCEPTED
0
$0
2
$75,555
4
$116,135
0
$0
0
$0
2
$69,500
APPLICATIONS DENIED
2
$94,610
4
$41,028
18
$138,854
2
$76,675
0
$0
5
$68,606
APPLICATIONS WITHDRAWN
0
$0
1
$265,900
6
$140,723
0
$0
0
$0
0
$0
FILES CLOSED FOR INCOMPLETENESS
0
$0
0
$0
0
$0
0
$0
0
$0
0
$0
Aggregated Statistics For Year 2007 (Based on 2 partial tracts)
A) FHA, FSA/RHS & VA Home Purchase Loans
B) Conventional Home Purchase Loans
C) Refinancings
D) Home Improvement Loans
F) Non-occupant Loans on < 5 Family Dwellings (A B C & D)
G) Loans On Manufactured Home Dwelling (A B C & D)
Number
Average Value
Number
Average Value
Number
Average Value
Number
Average Value
Number
Average Value
Number
Average Value
LOANS ORIGINATED
3
$122,563
16
$110,391
33
$121,965
8
$44,784
6
$59,862
12
$59,338
APPLICATIONS APPROVED, NOT ACCEPTED
0
$0
3
$120,920
3
$169,347
0
$0
0
$0
1
$123,310
APPLICATIONS DENIED
1
$130,480
13
$133,520
27
$109,360
5
$31,118
3
$168,747
8
$69,221
APPLICATIONS WITHDRAWN
0
$0
4
$140,012
9
$120,819
0
$0
0
$0
1
$92,820
FILES CLOSED FOR INCOMPLETENESS
0
$0
2
$217,700
2
$251,330
0
$0
0
$0
0
$0
Aggregated Statistics For Year 2006 (Based on 2 partial tracts)
A) FHA, FSA/RHS & VA Home Purchase Loans
B) Conventional Home Purchase Loans
C) Refinancings
D) Home Improvement Loans
F) Non-occupant Loans on < 5 Family Dwellings (A B C & D)
G) Loans On Manufactured Home Dwelling (A B C & D)
Number
Average Value
Number
Average Value
Number
Average Value
Number
Average Value
Number
Average Value
Number
Average Value
LOANS ORIGINATED
4
$127,905
20
$93,828
28
$118,490
6
$43,420
3
$38,413
12
$62,440
APPLICATIONS APPROVED, NOT ACCEPTED
0
$0
1
$255,590
7
$102,171
1
$40,800
0
$0
1
$67,260
APPLICATIONS DENIED
0
$0
8
$96,238
30
$112,519
5
$44,570
2
$170,170
9
$68,107
APPLICATIONS WITHDRAWN
1
$147,520
4
$67,708
13
$135,693
0
$0
0
$0
2
$114,565
FILES CLOSED FOR INCOMPLETENESS
0
$0
0
$0
3
$125,253
0
$0
0
$0
0
$0
Aggregated Statistics For Year 2005 (Based on 2 partial tracts)
A) FHA, FSA/RHS & VA Home Purchase Loans
B) Conventional Home Purchase Loans
C) Refinancings
D) Home Improvement Loans
F) Non-occupant Loans on < 5 Family Dwellings (A B C & D)
G) Loans On Manufactured Home Dwelling (A B C & D)
Number
Average Value
Number
Average Value
Number
Average Value
Number
Average Value
Number
Average Value
Number
Average Value
LOANS ORIGINATED
2
$113,670
23
$79,893
31
$109,178
6
$21,373
6
$74,135
13
$45,633
APPLICATIONS APPROVED, NOT ACCEPTED
0
$0
5
$145,730
7
$145,730
0
$0
1
$88,330
1
$82,060
APPLICATIONS DENIED
1
$117,480
12
$90,315
33
$103,852
4
$39,460
2
$55,825
15
$76,587
APPLICATIONS WITHDRAWN
1
$142,140
3
$55,750
17
$124,814
1
$105,820
0
$0
3
$78,320
FILES CLOSED FOR INCOMPLETENESS
0
$0
2
$191,690
4
$102,010
0
$0
1
$52,460
1
$71,740
Aggregated Statistics For Year 2004 (Based on 2 partial tracts)
A) FHA, FSA/RHS & VA Home Purchase Loans
B) Conventional Home Purchase Loans
C) Refinancings
D) Home Improvement Loans
F) Non-occupant Loans on < 5 Family Dwellings (A B C & D)
G) Loans On Manufactured Home Dwelling (A B C & D)
Number
Average Value
Number
Average Value
Number
Average Value
Number
Average Value
Number
Average Value
Number
Average Value
LOANS ORIGINATED
0
$0
16
$86,429
34
$96,762
7
$14,029
3
$48,127
11
$54,705
APPLICATIONS APPROVED, NOT ACCEPTED
1
$52,910
2
$86,095
7
$109,026
1
$11,210
0
$0
4
$66,812
APPLICATIONS DENIED
1
$111,650
9
$82,257
35
$100,134
2
$41,925
0
$0
14
$69,246
APPLICATIONS WITHDRAWN
0
$0
3
$139,603
12
$110,456
1
$18,830
0
$0
2
$92,595
FILES CLOSED FOR INCOMPLETENESS
0
$0
1
$55,150
1
$151,560
0
$0
0
$0
0
$0
Aggregated Statistics For Year 2003 (Based on 2 partial tracts)
A) FHA, FSA/RHS & VA Home Purchase Loans
B) Conventional Home Purchase Loans
C) Refinancings
D) Home Improvement Loans
F) Non-occupant Loans on < 5 Family Dwellings (A B C & D)
Number
Average Value
Number
Average Value
Number
Average Value
Number
Average Value
Number
Average Value
LOANS ORIGINATED
0
$0
18
$97,701
61
$100,103
10
$19,954
3
$169,643
APPLICATIONS APPROVED, NOT ACCEPTED
0
$0
4
$105,710
10
$98,738
0
$0
1
$195,050
APPLICATIONS DENIED
1
$92,370
11
$53,930
30
$98,917
3
$27,203
0
$0
APPLICATIONS WITHDRAWN
0
$0
1
$90,580
11
$101,297
0
$0
0
$0
FILES CLOSED FOR INCOMPLETENESS
0
$0
0
$0
3
$128,840
0
$0
0
$0
Aggregated Statistics For Year 2002 (Based on 2 partial tracts)
A) FHA, FSA/RHS & VA Home Purchase Loans
B) Conventional Home Purchase Loans
C) Refinancings
D) Home Improvement Loans
F) Non-occupant Loans on < 5 Family Dwellings (A B C & D)
Number
Average Value
Number
Average Value
Number
Average Value
Number
Average Value
Number
Average Value
LOANS ORIGINATED
3
$79,817
19
$67,708
40
$94,545
6
$14,348
4
$62,102
APPLICATIONS APPROVED, NOT ACCEPTED
0
$0
4
$34,640
13
$86,575
0
$0
0
$0
APPLICATIONS DENIED
0
$0
10
$54,884
34
$83,983
2
$6,280
1
$91,920
APPLICATIONS WITHDRAWN
0
$0
0
$0
9
$73,837
0
$0
0
$0
FILES CLOSED FOR INCOMPLETENESS
0
$0
0
$0
5
$74,972
0
$0
0
$0
Aggregated Statistics For Year 2001 (Based on 2 partial tracts)
A) FHA, FSA/RHS & VA Home Purchase Loans
B) Conventional Home Purchase Loans
C) Refinancings
D) Home Improvement Loans
F) Non-occupant Loans on < 5 Family Dwellings (A B C & D)
Number
Average Value
Number
Average Value
Number
Average Value
Number
Average Value
Number
Average Value
LOANS ORIGINATED
2
$71,520
19
$70,541
52
$87,007
6
$11,583
4
$26,342
APPLICATIONS APPROVED, NOT ACCEPTED
0
$0
9
$66,263
7
$68,349
0
$0
0
$0
APPLICATIONS DENIED
0
$0
21
$52,164
32
$73,173
2
$10,535
0
$0
APPLICATIONS WITHDRAWN
0
$0
4
$82,058
13
$94,923
0
$0
0
$0
FILES CLOSED FOR INCOMPLETENESS
0
$0
0
$0
3
$44,540
0
$0
0
$0
Aggregated Statistics For Year 2000 (Based on 2 partial tracts)
A) FHA, FSA/RHS & VA Home Purchase Loans
B) Conventional Home Purchase Loans
C) Refinancings
D) Home Improvement Loans
F) Non-occupant Loans on < 5 Family Dwellings (A B C & D)
Number
Average Value
Number
Average Value
Number
Average Value
Number
Average Value
Number
Average Value
LOANS ORIGINATED
4
$77,460
22
$65,874
29
$68,729
11
$11,822
1
$20,630
APPLICATIONS APPROVED, NOT ACCEPTED
0
$0
7
$59,957
11
$54,705
1
$20,630
0
$0
APPLICATIONS DENIED
0
$0
29
$52,618
43
$65,998
5
$15,784
1
$31,840
APPLICATIONS WITHDRAWN
0
$0
4
$93,268
17
$66,389
0
$0
1
$60,090
FILES CLOSED FOR INCOMPLETENESS
0
$0
0
$0
2
$74,435
0
$0
0
$0
Aggregated Statistics For Year 1999 (Based on 1 full and 1 partial tracts)
A) FHA, FSA/RHS & VA Home Purchase Loans
B) Conventional Home Purchase Loans
C) Refinancings
D) Home Improvement Loans
F) Non-occupant Loans on < 5 Family Dwellings (A B C & D)


 Nearest zip codes: 29717, 29702, 29742, 29745, 29710, 29340.


