Estimated zip code population in 2022: 4,555 Zip code population in 2010: 4,146 Zip code population in 2000: 4,335
Houses and condos: 2,121 Renter-occupied apartments: 351
% of renters here:
17%
State:
28%
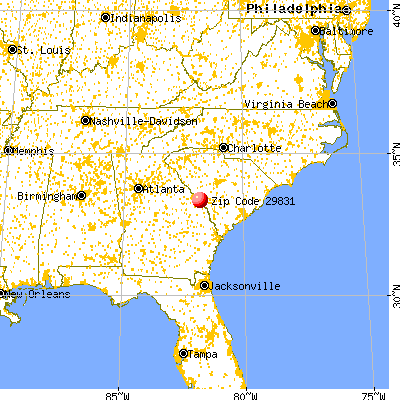
March 2022 cost of living index in zip code 29831: 79.9 (low, U.S. average is 100)
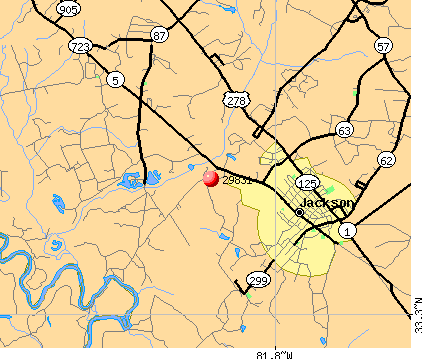
Land area: 115.2 sq. mi. Water area: 2.1 sq. mi.
Population density: 40 people per square mile
(very low).
OSM Map
General Map
Google Map
MSN Map
OSM Map
General Map
Google Map
MSN Map
OSM Map
General Map
Google Map
MSN Map
OSM Map
General Map
Google Map
MSN Map
Please wait while loading the map...
Real estate property taxes paid for housing units in 2022:
This zip code:
0.5% ($850)
South Carolina:
0.5% ($1,185)
Median real estate property taxes paid for housing units with mortgages in 2022: $1,033 (0.6%) Median real estate property taxes paid for housing units with no mortgage in 2022: $485 (0.4%)
Estimated median house/condo value in 2022: $166,986
29831:
$166,986
South Carolina:
$254,600
According to our research of South Carolina and other state lists, there was 1 registered sex offender living in 29831 zip code as of May 28, 2024. The ratio of all residents to sex offenders in zip code 29831 is 3,950 to 1. The ratio of registered sex offenders to all residents in this zip code is much lower than the state average.
Median resident age:
This zip code:
41.9 years
South Carolina median age:
40.5 years
Average household size:
This zip code:
2.3 people
South Carolina:
2.4 people
Averages for the 2020 tax year for zip code 29831, filed in 2021:
Average Adjusted Gross Income (AGI) in 2020: $50,536 (Individual Income Tax Returns)
Here:
$50,536
State:
$65,754
Salary/wage: $45,375 (reported on 83.0% of returns)
Here:
$45,375
State:
$52,566
(% of AGI for various income ranges: 1194.8% for AGIs below $25k, 3647.2% for AGIs $25k-50k, 6443.0% for AGIs $50k-75k, 10029.1% for AGIs $75k-100k, 18110.0% for AGIs $100k-200k)
Taxable interest for individuals: $709 (reported on 19.3% of returns)
This zip code:
$709
South Carolina:
$1,749
(% of AGI for various income ranges: 6.0% for AGIs below $25k, 6.1% for AGIs $25k-50k, 13.5% for AGIs $50k-75k, 28.2% for AGIs $75k-100k, 125.0% for AGIs $100k-200k)
Ordinary dividends: $2,161 (reported on 10.5% of returns)
Here:
$2,161
State:
$8,783
(% of AGI for various income ranges: 18.8% for AGIs below $25k, 20.3% for AGIs $25k-50k, 30.0% for AGIs $50k-75k, 45.5% for AGIs $75k-100k, 116.0% for AGIs $100k-200k)
Net capital gain/loss in AGI: +$4,667 (reported on 8.8% of returns)
Here:
+$4,667
State:
+$24,194
(% of AGI for various income ranges: 29.5% for AGIs $50k-75k, 40.9% for AGIs $75k-100k, 602.0% for AGIs $100k-200k)
Profit/loss from business: +$3,446 (reported on 14.0% of returns)
Here:
+$3,446
State:
+$11,253
(% of AGI for various income ranges: 71.0% for AGIs below $25k, 67.5% for AGIs $50k-75k, 40.9% for AGIs $75k-100k, 417.0% for AGIs $100k-200k)
Taxable individual retirement arrangement distribution: $13,350 (reported on 7.0% of returns)
29831:
$13,350
South Carolina:
$21,604
(% of AGI for various income ranges: 29.2% for AGIs below $25k, 64.4% for AGIs $25k-50k, 163.0% for AGIs $50k-75k, 331.8% for AGIs $75k-100k, 539.0% for AGIs $100k-200k)
Total itemized deductions: $26,667 (reported on 5.3% of returns)
Here:
$26,667
State:
$35,199
(% of AGI for various income ranges: 565.0% for AGIs $50k-75k, 1270.0% for AGIs $100k-200k)
Charity contributions: $10,450 (reported on 4.7% of returns)
Here:
$10,450
State:
$14,319
(% of AGI for various income ranges: 187.5% for AGIs $50k-75k, 461.0% for AGIs $100k-200k)
Taxes paid: $6,278 (reported on 5.3% of returns)
29831:
$6,278
State:
$7,486
(% of AGI for various income ranges: 108.0% for AGIs $50k-75k, 349.0% for AGIs $100k-200k)
Earned income credit: $2,481 (reported on 21.6% of returns)
Here:
$2,481
State:
$2,397
(% of AGI for various income ranges: 120.2% for AGIs below $25k, 94.7% for AGIs $25k-50k)
Percentage of individuals using paid preparers for their 2020 taxes: 93.6%
Here:
94%
State:
93%
(% for various income ranges: 93.3% for AGIs below $25k, 95.6% for AGIs $25k-50k, 92.9% for AGIs $50k-75k, 94.1% for AGIs $75k-100k, 94.4% for AGIs $100k-200k, 66.7% for AGIs over 200k)
Averages for the 2012 tax year for zip code 29831, filed in 2013:
Average Adjusted Gross Income (AGI) in 2012: $42,982 (Individual Income Tax Returns)
Here:
$42,982
State:
$51,133
Salary/wage: $38,442 (reported on 83.9% of returns)
Here:
$38,442
State:
$42,173
(% of AGI for various income ranges: 76.2% for AGIs below $25k, 73.4% for AGIs $25k-50k, 80.5% for AGIs $50k-75k, 77.9% for AGIs $75k-100k, 70.2% for AGIs $100k-200k)
Taxable interest for individuals: $972 (reported on 23.2% of returns)
This zip code:
$972
South Carolina:
$1,468
(% of AGI for various income ranges: 0.6% for AGIs below $25k, 0.9% for AGIs $25k-50k, 0.2% for AGIs $50k-75k, 0.2% for AGIs $75k-100k, 0.6% for AGIs $100k-200k)
Ordinary dividends: $2,260 (reported on 11.9% of returns)
Here:
$2,260
State:
$6,511
(% of AGI for various income ranges: 1.0% for AGIs below $25k, 0.9% for AGIs $25k-50k, 0.9% for AGIs $50k-75k, 0.4% for AGIs $75k-100k, 0.2% for AGIs $100k-200k)
Net capital gain/loss in AGI: +$1,308 (reported on 7.1% of returns)
Here:
+$1,308
State:
+$13,061
(% of AGI for various income ranges: 0.3% for AGIs below $25k, 0.7% for AGIs $100k-200k)
Profit/loss from business: +$2,929 (reported on 12.5% of returns)
Here:
+$2,929
State:
+$10,167
(% of AGI for various income ranges: 5.5% for AGIs below $25k, 0.2% for AGIs $50k-75k, 0.6% for AGIs $75k-100k)
Taxable individual retirement arrangement distribution: $13,360 (reported on 8.9% of returns)
29831:
$13,360
South Carolina:
$17,019
(% of AGI for various income ranges: 2.0% for AGIs below $25k, 2.9% for AGIs $25k-50k, 2.4% for AGIs $50k-75k, 2.1% for AGIs $75k-100k, 3.8% for AGIs $100k-200k)
Total itemized deductions: $17,495 (21% of AGI, reported on 24.4% of returns)
Here:
$17,495
State:
$22,890
Here:
21.5% of AGI
State:
21.4% of AGI
(% of AGI for various income ranges: 5.5% for AGIs below $25k, 8.1% for AGIs $25k-50k, 9.2% for AGIs $50k-75k, 10.7% for AGIs $75k-100k, 13.4% for AGIs $100k-200k)
Charity contributions: $4,881 (reported on 21.4% of returns)
Here:
$4,881
State:
$5,169
(% of AGI for various income ranges: 1.3% for AGIs below $25k, 2.0% for AGIs $25k-50k, 1.9% for AGIs $50k-75k, 2.8% for AGIs $75k-100k, 3.5% for AGIs $100k-200k)
Taxes paid: $5,293 (reported on 24.4% of returns)
29831:
$5,293
State:
$7,644
(% of AGI for various income ranges: 0.5% for AGIs below $25k, 1.4% for AGIs $25k-50k, 2.6% for AGIs $50k-75k, 3.4% for AGIs $75k-100k, 5.4% for AGIs $100k-200k)
Earned income credit: $2,439 (reported on 26.2% of returns)
Here:
$2,439
State:
$2,418
(% of AGI for various income ranges: 9.3% for AGIs below $25k, 1.4% for AGIs $25k-50k)
Percentage of individuals using paid preparers for their 2012 taxes: 64.9%
Here:
65%
State:
57%
(% for various income ranges: 59.7% for AGIs below $25k, 63.6% for AGIs $25k-50k, 69.6% for AGIs $50k-75k, 80.0% for AGIs $75k-100k, 71.4% for AGIs $100k-200k)
Averages for the 2004 tax year for zip code 29831, filed in 2005:
Average Adjusted Gross Income (AGI) in 2004: $35,397 (Individual Income Tax Returns)
Here:
$35,397
State:
$41,965
Salary/wage: $33,357 (reported on 85.7% of returns)
Here:
$33,357
State:
$35,695
(% of AGI for various income ranges: 99.4% for AGIs below $10k, 76.1% for AGIs $10k-25k, 78.1% for AGIs $25k-50k, 84.4% for AGIs $50k-75k, 84.7% for AGIs $75k-100k, 77.9% for AGIs over 100k)
Taxable interest for individuals: $1,065 (reported on 33.5% of returns)
This zip code:
$1,065
South Carolina:
$1,623
(% of AGI for various income ranges: 3.0% for AGIs below $10k, 1.3% for AGIs $10k-25k, 1.2% for AGIs $25k-50k, 0.9% for AGIs $50k-75k, 0.7% for AGIs $75k-100k, 0.7% for AGIs over 100k)
Taxable dividends: $1,317 (reported on 15.1% of returns)
Here:
$1,317
State:
$3,999
(% of AGI for various income ranges: 0.7% for AGIs below $10k, 0.8% for AGIs $10k-25k, 0.9% for AGIs $25k-50k, 0.3% for AGIs $50k-75k, 0.3% for AGIs $75k-100k, 0.4% for AGIs over 100k)
Net capital gain/loss: +$4,844 (reported on 9.6% of returns)
Here:
+$4,844
State:
+$13,100
(% of AGI for various income ranges: -0.7% for AGIs below $10k, 0.1% for AGIs $10k-25k, 0.1% for AGIs $25k-50k, 0.1% for AGIs $50k-75k, 0.8% for AGIs $75k-100k, 6.3% for AGIs over 100k)
IRA payment deduction: $1,077 (reported on 0.7% of returns)
29831:
$1,077
South Carolina:
$2,972
Total itemized deductions: $15,316 (23% of AGI, reported on 26.2% of returns)
Here:
$15,316
State:
$19,039
Here:
22.6% of AGI
State:
22.8% of AGI
(% of AGI for various income ranges: 7.3% for AGIs $10k-25k, 10.1% for AGIs $25k-50k, 11.0% for AGIs $50k-75k, 14.9% for AGIs $75k-100k, 15.2% for AGIs over 100k)
Charity contributions deductions: $3,586 (5% of AGI, reported on 24.3% of returns)
Here:
$3,586
State:
$4,305
Here:
5.2% of AGI
State:
5.0% of AGI
(% of AGI for various income ranges: 1.2% for AGIs $10k-25k, 2.2% for AGIs $25k-50k, 2.7% for AGIs $50k-75k, 3.5% for AGIs $75k-100k, 3.0% for AGIs over 100k)
Total tax: $4,129 (reported on 69.6% of returns)
29831:
$4,129
State:
$6,497
(% of AGI for various income ranges: 2.3% for AGIs below $10k, 2.7% for AGIs $10k-25k, 5.7% for AGIs $25k-50k, 8.9% for AGIs $50k-75k, 10.2% for AGIs $75k-100k, 13.9% for AGIs over 100k)
Earned income credit: $2,055 (reported on 25.0% of returns)
Here:
$2,055
State:
$1,882
Percentage of individuals using paid preparers for their 2004 taxes: 71.9%
Here:
72%
State:
66%
(% for various income ranges: 68.0% for AGIs below $10k, 73.0% for AGIs $10k-25k, 72.2% for AGIs $25k-50k, 71.7% for AGIs $50k-75k, 76.1% for AGIs $75k-100k, 72.6% for AGIs over 100k)
Likely homosexual households (counted as self-reported same-sex unmarried-partner households)
Lesbian couples: 0.2% of all households
Gay men: 0.5% of all households
Household received Food Stamps/SNAP in the past 12 months: 207 Household did not receive Food Stamps/SNAP in the past 12 months: 1,816
Women who had a birth in the past 12 months: 51 (39 now married, 12 unmarried) Women who did not have a birth in the past 12 months: 801 (395 now married, 407 unmarried)
Housing units in zip code 29831 with a mortgage: 958 (26 second mortgage, 17 both second mortgage and home equity loan) Houses without a mortgage: 36
Median monthly owner costs for units with a mortgage: $1,111 Median monthly owner costs for units without a mortgage: $380
Residents with income below the poverty level in 2022:
This zip code:
13.1%
Whole state:
14.0%
Residents with income below 50% of the poverty level in 2022:
This zip code:
4.8%
Whole state:
7.3%
Median number of rooms in houses and condos:
Here:
6.5
State:
6.4
Median number of rooms in apartments:
Here:
4.0
State:
4.5
Notable locations in this zip code not listed on our city pages
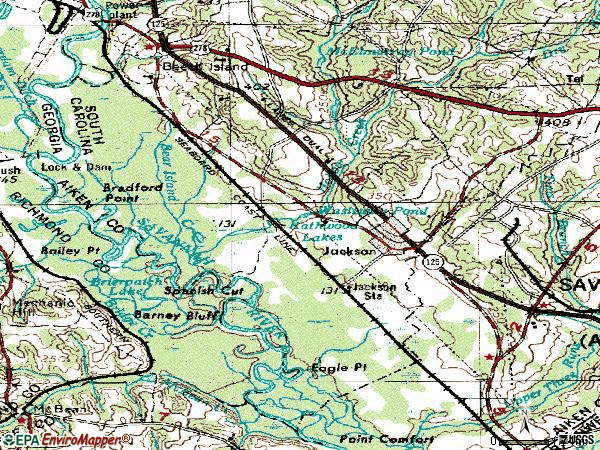
Notable locations in zip code 29831: Sand Bar Ferry Landing (A), Substation Number 1 (B), Cassels Fire Tower (C), Jackson Fire Department (D), Savannah River Laboratory (E), Savannah River Ecology Laboratory (F), Pump House Number 3 (G), Pump House Number 1 (H). Display/hide their locations on the map
Churches in zip code 29831 include: Susan Union Church (A), Thomas Grove Church (B), Bean Pond Church (C), Matlock Baptist Church (D), Assembly of the Lord Church (E), Green Pond Baptist Church (F), Mount Moriah Church (G), Mount Pleasant Church (H), Wesley Chapel (I). Display/hide their locations on the map
Lakes and reservoirs: Wasteway Pond (A), Horseshoe Lake (B), Island Lake (C), House Lake (D), Kathwood Lakes (E), Bent Lake (F), Clarkes Lake (G), Coleman Lake (H). Display/hide their locations on the map
Streams, rivers, and creeks: Badger Branch (A), Pine Creek (B), Neal Creek (C), Musterfield Branch (D), Upper Three Runs (E), Island Creek (F), Hollow Creek (G), Dead River (H), Curry Branch (I). Display/hide their locations on the map
In group quarters: 2 (-1 institutionalized population)
Size of family households: 710 2-persons, 444 3-persons, 92 4-persons, 61 5-persons, 20 6-persons, 59 7-or-more-persons
Size of nonfamily households: 573 1-person, 70 2-persons
478 married couples with children.
174 single-parent households (68 men, 106 women).
97.5% of residents of 29831 zip code speak English at home.
2.5% of residents speak Spanish at home (95% very well, 5% well).
Foreign born population: 104 (2.3%) (61.0% of them are naturalized citizens)
This zip code:
2.3%
Whole state:
5.2%
59%France
33%Honduras
5%Japan
3%Belize
1%Malaysia
57%American
10%English
4%German
4%Scottish
3%Irish
2%Italian
1%Scotch-Irish
Year of entry for the foreign-born population
592010 or later
102000 to 2009
701990 to 1999
20Before 1990
Facilities with environmental interests located in this zip code:
DEPOT FOOD STORE 115 (101 ATOMIC RD in JACKSON, SC)
(Resource Conservation and Recovery Act (tracking hazardous waste)) STATE MASTER (South Carolina database) - HAZARDOUS WASTE PROGRAM Organizations: THE PANTRY INC (CONTACT/OWNER)
Housing units lacking complete plumbing facilities: 1.3% Housing units lacking complete kitchen facilities: 1.1%
72.2%Electricity
22.1%Utility gas
2.7%Bottled, tank, or LP gas
1.4%No fuel used
0.8%Fuel oil, kerosene, etc.
0.7%Wood
Population in 1990: 2,810. Population change in the 1990s: +1,525 (+54.3%).
Place of birth for U.S.-born residents:
This state: 1,643
Northeast: 151
Midwest: 135
South: 2,332
West: 133
63% of the 29831 zip code residents lived in the same house 5 years ago. Out of people who lived in different houses, 65% lived in this county. Out of people who lived in different counties, 50% lived in South Carolina.
93% of the 29831 zip code residents lived in the same house 1 year ago. Out of people who lived in different houses, 48% moved from this county. Out of people who lived in different houses, 32% moved from different county within same state. Out of people who lived in different houses, 15% moved from different state.
Private vs. public school enrollment:
Students in private schools in grades 1 to 8 (elementary and middle school):
Here:
0.0%
South Carolina:
14.4%
Students in private schools in grades 9 to 12 (high school): 4
Here:
2.5%
South Carolina:
11.1%
Students in private undergraduate colleges: 8
Here:
6.9%
South Carolina:
21.9%
Occupation by median earnings in the past 12 months ($)
89,185Architecture and engineering occupations
77,366Life, physical, and social science occupations
76,636Installation, maintenance, and repair occupations
63,964Business and financial operations occupations
51,280Fire fighting and prevention, and other protective service workers including supervisors
47,892Production occupations
Top industries in this zip code by the number of employees in 2005:
Construction: Power and Communication Line and Related Structures Construction (20-49 employees: 1 establishment)
Other Services (except Public Administration): Civic and Social Organizations (20-49: 1)
Other Services (except Public Administration): Religious Organizations (5-9: 2, 1-4: 2)
Real Estate and Rental and Leasing: Offices of Real Estate Agents and Brokers (5-9: 1)
Construction: Site Preparation Contractors (1-4: 3)
People in group quarters in 2000:
4 people in homes for the mentally retarded
Fatal accident statistics in 2014:
Fatal accident count: 3
Vehicles involved in fatal accidents: 5
Fatal accidents caused by drunken drivers: 0
Fatalities: 3
Persons involved in fatal accidents: 6
Pedestrians involved in fatal accidents: 0
Fatal accident statistics in 2013:
Fatal accident count: 1
Vehicles involved in fatal accidents: 2
Fatal accidents caused by drunken drivers: 0
Fatalities: 2
Persons involved in fatal accidents: 3
Pedestrians involved in fatal accidents: 0
Home Mortgage Disclosure Act Aggregated Statistics For Year 2009 (Based on 4 partial tracts)
A) FHA, FSA/RHS & VA Home Purchase Loans
B) Conventional Home Purchase Loans
C) Refinancings
D) Home Improvement Loans
F) Non-occupant Loans on < 5 Family Dwellings (A B C & D)
G) Loans On Manufactured Home Dwelling (A B C & D)
Number
Average Value
Number
Average Value
Number
Average Value
Number
Average Value
Number
Average Value
Number
Average Value
LOANS ORIGINATED
16
$128,694
19
$117,064
93
$154,838
11
$20,070
7
$77,684
19
$50,142
APPLICATIONS APPROVED, NOT ACCEPTED
1
$80,000
5
$79,668
9
$151,399
2
$36,460
0
$0
7
$80,361
APPLICATIONS DENIED
6
$88,543
17
$58,155
54
$148,716
3
$32,740
4
$144,255
15
$55,115
APPLICATIONS WITHDRAWN
6
$86,462
4
$103,045
29
$125,170
1
$98,630
3
$42,693
5
$85,116
FILES CLOSED FOR INCOMPLETENESS
1
$33,980
1
$428,340
7
$137,101
1
$7,790
1
$19,050
1
$7,790
Aggregated Statistics For Year 2008 (Based on 4 partial tracts)
A) FHA, FSA/RHS & VA Home Purchase Loans
B) Conventional Home Purchase Loans
C) Refinancings
D) Home Improvement Loans
E) Loans on Dwellings For 5+ Families
F) Non-occupant Loans on < 5 Family Dwellings (A B C & D)
G) Loans On Manufactured Home Dwelling (A B C & D)
Number
Average Value
Number
Average Value
Number
Average Value
Number
Average Value
Number
Average Value
Number
Average Value
Number
Average Value
LOANS ORIGINATED
22
$107,073
40
$133,562
68
$111,397
7
$307,306
0
$0
10
$73,223
33
$66,489
APPLICATIONS APPROVED, NOT ACCEPTED
1
$43,710
6
$92,207
9
$76,273
2
$18,010
0
$0
2
$76,435
3
$55,320
APPLICATIONS DENIED
3
$86,623
14
$72,864
57
$137,362
13
$60,762
1
$60,890
6
$150,332
15
$64,585
APPLICATIONS WITHDRAWN
5
$73,572
7
$129,169
20
$148,744
1
$88,500
0
$0
2
$57,475
5
$60,746
FILES CLOSED FOR INCOMPLETENESS
0
$0
1
$206,030
3
$137,533
0
$0
0
$0
0
$0
0
$0
Aggregated Statistics For Year 2007 (Based on 4 partial tracts)
A) FHA, FSA/RHS & VA Home Purchase Loans
B) Conventional Home Purchase Loans
C) Refinancings
D) Home Improvement Loans
F) Non-occupant Loans on < 5 Family Dwellings (A B C & D)
G) Loans On Manufactured Home Dwelling (A B C & D)
Number
Average Value
Number
Average Value
Number
Average Value
Number
Average Value
Number
Average Value
Number
Average Value
LOANS ORIGINATED
17
$110,057
50
$143,010
87
$103,799
21
$45,900
20
$113,592
30
$58,413
APPLICATIONS APPROVED, NOT ACCEPTED
1
$51,560
20
$86,405
16
$110,024
5
$19,978
6
$42,218
9
$67,848
APPLICATIONS DENIED
4
$97,975
17
$114,981
81
$118,485
25
$57,352
7
$72,216
25
$71,333
APPLICATIONS WITHDRAWN
1
$52,120
8
$74,545
39
$123,182
4
$96,022
1
$84,960
7
$56,006
FILES CLOSED FOR INCOMPLETENESS
1
$60,180
2
$99,300
8
$102,411
1
$88,080
1
$10,650
1
$98,850
Aggregated Statistics For Year 2006 (Based on 4 partial tracts)
A) FHA, FSA/RHS & VA Home Purchase Loans
B) Conventional Home Purchase Loans
C) Refinancings
D) Home Improvement Loans
F) Non-occupant Loans on < 5 Family Dwellings (A B C & D)
G) Loans On Manufactured Home Dwelling (A B C & D)
Number
Average Value
Number
Average Value
Number
Average Value
Number
Average Value
Number
Average Value
Number
Average Value
LOANS ORIGINATED
14
$106,660
75
$96,364
70
$101,407
21
$38,206
9
$58,533
19
$55,179
APPLICATIONS APPROVED, NOT ACCEPTED
0
$0
12
$64,559
17
$101,147
6
$16,760
2
$84,395
4
$49,772
APPLICATIONS DENIED
4
$118,060
25
$74,040
75
$97,910
47
$52,669
7
$76,294
34
$60,056
APPLICATIONS WITHDRAWN
1
$137,360
6
$75,095
51
$103,133
5
$37,524
1
$35,310
2
$40,355
FILES CLOSED FOR INCOMPLETENESS
0
$0
4
$99,298
5
$91,892
0
$0
1
$44,600
0
$0
Aggregated Statistics For Year 2005 (Based on 4 partial tracts)
A) FHA, FSA/RHS & VA Home Purchase Loans
B) Conventional Home Purchase Loans
C) Refinancings
D) Home Improvement Loans
E) Loans on Dwellings For 5+ Families
F) Non-occupant Loans on < 5 Family Dwellings (A B C & D)
G) Loans On Manufactured Home Dwelling (A B C & D)
Number
Average Value
Number
Average Value
Number
Average Value
Number
Average Value
Number
Average Value
Number
Average Value
Number
Average Value
LOANS ORIGINATED
13
$106,013
61
$74,806
84
$88,617
16
$28,887
0
$0
12
$45,108
33
$49,103
APPLICATIONS APPROVED, NOT ACCEPTED
1
$72,220
6
$101,720
20
$81,766
5
$22,724
1
$203,900
2
$65,565
5
$55,298
APPLICATIONS DENIED
1
$139,480
26
$76,197
91
$89,807
24
$34,028
0
$0
6
$51,552
32
$59,914
APPLICATIONS WITHDRAWN
1
$179,830
13
$116,445
51
$103,248
6
$59,073
0
$0
5
$97,518
6
$63,010
FILES CLOSED FOR INCOMPLETENESS
0
$0
1
$387,280
17
$103,943
1
$38,670
0
$0
0
$0
2
$75,260
Aggregated Statistics For Year 2004 (Based on 4 partial tracts)
A) FHA, FSA/RHS & VA Home Purchase Loans
B) Conventional Home Purchase Loans
C) Refinancings
D) Home Improvement Loans
F) Non-occupant Loans on < 5 Family Dwellings (A B C & D)
G) Loans On Manufactured Home Dwelling (A B C & D)
Number
Average Value
Number
Average Value
Number
Average Value
Number
Average Value
Number
Average Value
Number
Average Value
LOANS ORIGINATED
16
$89,794
54
$86,854
85
$86,497
13
$30,442
15
$52,983
41
$54,923
APPLICATIONS APPROVED, NOT ACCEPTED
0
$0
11
$48,628
20
$63,404
3
$36,787
5
$45,522
8
$43,688
APPLICATIONS DENIED
4
$91,685
30
$74,481
121
$82,550
14
$31,436
5
$63,036
38
$64,785
APPLICATIONS WITHDRAWN
1
$101,000
8
$78,564
57
$99,159
5
$56,722
3
$85,370
9
$70,671
FILES CLOSED FOR INCOMPLETENESS
0
$0
1
$145,600
15
$124,537
1
$35,400
0
$0
2
$64,780
Aggregated Statistics For Year 2003 (Based on 4 partial tracts)
A) FHA, FSA/RHS & VA Home Purchase Loans
B) Conventional Home Purchase Loans
C) Refinancings
D) Home Improvement Loans
F) Non-occupant Loans on < 5 Family Dwellings (A B C & D)
Number
Average Value
Number
Average Value
Number
Average Value
Number
Average Value
Number
Average Value
LOANS ORIGINATED
6
$109,010
58
$75,649
165
$90,068
13
$22,394
17
$49,978
APPLICATIONS APPROVED, NOT ACCEPTED
0
$0
9
$54,638
40
$74,348
1
$11,330
1
$91,330
APPLICATIONS DENIED
2
$48,770
38
$62,589
110
$82,755
11
$21,402
3
$49,577
APPLICATIONS WITHDRAWN
3
$71,273
5
$52,684
48
$81,188
1
$73,970
3
$63,167
FILES CLOSED FOR INCOMPLETENESS
0
$0
2
$80,135
7
$84,537
0
$0
1
$21,300
Aggregated Statistics For Year 2002 (Based on 4 partial tracts)
A) FHA, FSA/RHS & VA Home Purchase Loans
B) Conventional Home Purchase Loans
C) Refinancings
D) Home Improvement Loans
F) Non-occupant Loans on < 5 Family Dwellings (A B C & D)
Number
Average Value
Number
Average Value
Number
Average Value
Number
Average Value
Number
Average Value
LOANS ORIGINATED
9
$80,888
57
$77,287
118
$89,709
17
$14,316
15
$40,332
APPLICATIONS APPROVED, NOT ACCEPTED
0
$0
20
$54,850
34
$112,186
1
$28,790
1
$21,860
APPLICATIONS DENIED
1
$29,030
46
$52,225
93
$72,346
11
$15,323
3
$48,300
APPLICATIONS WITHDRAWN
1
$39,790
8
$81,750
51
$71,795
2
$18,875
2
$32,785
FILES CLOSED FOR INCOMPLETENESS
0
$0
1
$81,420
10
$73,568
0
$0
1
$27,610
Aggregated Statistics For Year 2001 (Based on 4 partial tracts)
A) FHA, FSA/RHS & VA Home Purchase Loans
B) Conventional Home Purchase Loans
C) Refinancings
D) Home Improvement Loans
F) Non-occupant Loans on < 5 Family Dwellings (A B C & D)
Number
Average Value
Number
Average Value
Number
Average Value
Number
Average Value
Number
Average Value
LOANS ORIGINATED
7
$75,749
63
$69,346
120
$74,761
10
$18,996
7
$32,637
APPLICATIONS APPROVED, NOT ACCEPTED
3
$57,523
18
$42,803
29
$64,448
3
$12,063
1
$77,080
APPLICATIONS DENIED
1
$91,800
68
$47,913
112
$60,955
13
$20,695
9
$39,257
APPLICATIONS WITHDRAWN
1
$90,880
7
$68,026
50
$80,917
3
$21,423
1
$35,870
FILES CLOSED FOR INCOMPLETENESS
1
$79,050
1
$68,680
8
$63,310
0
$0
1
$56,640
Aggregated Statistics For Year 2000 (Based on 4 partial tracts)
A) FHA, FSA/RHS & VA Home Purchase Loans
B) Conventional Home Purchase Loans
C) Refinancings
D) Home Improvement Loans
F) Non-occupant Loans on < 5 Family Dwellings (A B C & D)
Number
Average Value
Number
Average Value
Number
Average Value
Number
Average Value
Number
Average Value
LOANS ORIGINATED
15
$74,982
76
$58,628
73
$59,818
16
$17,891
9
$32,760
APPLICATIONS APPROVED, NOT ACCEPTED
4
$62,835
26
$43,227
23
$61,210
5
$18,668
3
$40,827
APPLICATIONS DENIED
4
$65,200
79
$46,057
93
$60,506
14
$21,492
4
$43,365
APPLICATIONS WITHDRAWN
0
$0
14
$59,227
42
$57,287
3
$10,747
3
$44,307
FILES CLOSED FOR INCOMPLETENESS
1
$99,830
2
$76,465
3
$63,867
0
$0
0
$0
Aggregated Statistics For Year 1999 (Based on 2 partial tracts)
A) FHA, FSA/RHS & VA Home Purchase Loans
B) Conventional Home Purchase Loans
C) Refinancings
D) Home Improvement Loans
F) Non-occupant Loans on < 5 Family Dwellings (A B C & D)
Detailed PMIC statistics for the following Tracts:0209.00
, 0221.00
2002 - 2018 National Fire Incident Reporting System (NFIRS) incidents
According to the data from the years 2002 - 2018 the average number of fire incidents per year is 12. The highest number of fires - 28 took place in 2018, and the least - 1 in 2003. The data has a rising trend.
When looking into fire subcategories, the most incidents belonged to: Structure Fires (53.3%), and Outside Fires (34.7%).
Fire incident types reported to NFIRS in Zip Code 29831


 Nearest zip codes: 29809, 29842, 30906, 29803, 30901, 29851.


 According to the data from the years 2002 - 2018 the average number of fire incidents per year is 12. The highest number of fires - 28 took place in 2018, and the least - 1 in 2003. The data has a rising trend.
 When looking into fire subcategories, the most incidents belonged to: Structure Fires (53.3%), and Outside Fires (34.7%).