Estimated zip code population in 2022: 5,197 Zip code population in 2010: 5,480 Zip code population in 2000: 4,074
Houses and condos: 2,139 Renter-occupied apartments: 404
% of renters here:
23%
State:
28%
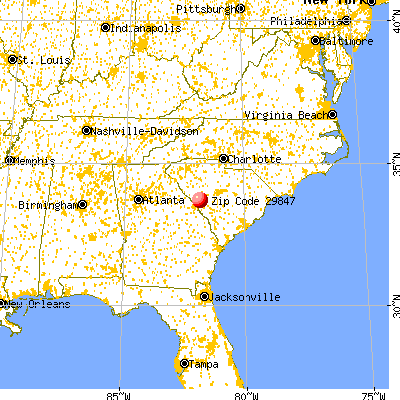
March 2022 cost of living index in zip code 29847: 79.6 (low, U.S. average is 100)
Land area: 90.8 sq. mi. Water area: 1.1 sq. mi.
Population density: 57 people per square mile
(very low).
OSM Map
General Map
Google Map
MSN Map
OSM Map
General Map
Google Map
MSN Map
OSM Map
General Map
Google Map
MSN Map
OSM Map
General Map
Google Map
MSN Map
Please wait while loading the map...
Real estate property taxes paid for housing units in 2022:
This zip code:
0.5% ($707)
South Carolina:
0.5% ($1,185)
Median real estate property taxes paid for housing units with mortgages in 2022: $870 (0.4%) Median real estate property taxes paid for housing units with no mortgage in 2022: $567 (0.7%)
Estimated median house/condo value in 2022: $131,304
29847:
$131,304
South Carolina:
$254,600
According to our research of South Carolina and other state lists, there were 2 registered sex offenders living in 29847 zip code as of May 28, 2024. The ratio of all residents to sex offenders in zip code 29847 is 2,370 to 1. The ratio of registered sex offenders to all residents in this zip code is lower than the state average.
Median resident age:
This zip code:
36.8 years
South Carolina median age:
40.5 years
Average household size:
This zip code:
2.6 people
South Carolina:
2.4 people
Averages for the 2020 tax year for zip code 29847, filed in 2021:
Average Adjusted Gross Income (AGI) in 2020: $48,938 (Individual Income Tax Returns)
Here:
$48,938
State:
$65,754
Salary/wage: $43,138 (reported on 85.3% of returns)
Here:
$43,138
State:
$52,566
(% of AGI for various income ranges: 1325.4% for AGIs below $25k, 3962.2% for AGIs $25k-50k, 6669.5% for AGIs $50k-75k, 10649.2% for AGIs $75k-100k, 18385.0% for AGIs $100k-200k)
Taxable interest for individuals: $712 (reported on 18.2% of returns)
This zip code:
$712
South Carolina:
$1,749
(% of AGI for various income ranges: 4.7% for AGIs below $25k, 9.8% for AGIs $25k-50k, 54.1% for AGIs $50k-75k, 24.2% for AGIs $75k-100k, 54.2% for AGIs $100k-200k)
Ordinary dividends: $2,465 (reported on 8.7% of returns)
Here:
$2,465
State:
$8,783
(% of AGI for various income ranges: 4.0% for AGIs below $25k, 7.8% for AGIs $25k-50k, 68.2% for AGIs $50k-75k, 15.8% for AGIs $75k-100k, 215.8% for AGIs $100k-200k)
Net capital gain/loss in AGI: +$4,424 (reported on 9.1% of returns)
Here:
+$4,424
State:
+$24,194
(% of AGI for various income ranges: 3.7% for AGIs $25k-50k, 52.3% for AGIs $50k-75k, 24.2% for AGIs $75k-100k, 651.7% for AGIs $100k-200k)
Profit/loss from business: +$5,618 (reported on 16.9% of returns)
Here:
+$5,618
State:
+$11,253
(% of AGI for various income ranges: 81.5% for AGIs below $25k, 42.9% for AGIs $25k-50k, 93.6% for AGIs $50k-75k, 1050.0% for AGIs $100k-200k)
Taxable individual retirement arrangement distribution: $14,394 (reported on 6.9% of returns)
29847:
$14,394
South Carolina:
$21,604
(% of AGI for various income ranges: 31.3% for AGIs below $25k, 61.6% for AGIs $25k-50k, 163.2% for AGIs $50k-75k, 344.2% for AGIs $75k-100k, 846.7% for AGIs $100k-200k)
Total itemized deductions: $29,290 (reported on 4.3% of returns)
Here:
$29,290
State:
$35,199
(% of AGI for various income ranges: 133.1% for AGIs $25k-50k, 375.9% for AGIs $50k-75k, 1208.3% for AGIs $100k-200k)
Charity contributions: $9,900 (reported on 3.5% of returns)
Here:
$9,900
State:
$14,319
(% of AGI for various income ranges: 30.0% for AGIs $25k-50k, 100.5% for AGIs $50k-75k, 353.3% for AGIs $100k-200k)
Taxes paid: $6,933 (reported on 3.9% of returns)
29847:
$6,933
State:
$7,486
(% of AGI for various income ranges: 15.7% for AGIs $25k-50k, 91.4% for AGIs $50k-75k, 288.3% for AGIs $100k-200k)
Earned income credit: $2,527 (reported on 23.8% of returns)
Here:
$2,527
State:
$2,397
(% of AGI for various income ranges: 150.1% for AGIs below $25k, 75.3% for AGIs $25k-50k)
Percentage of individuals using paid preparers for their 2020 taxes: 94.4%
Here:
94%
State:
93%
(% for various income ranges: 93.3% for AGIs below $25k, 95.3% for AGIs $25k-50k, 93.8% for AGIs $50k-75k, 94.7% for AGIs $75k-100k, 95.5% for AGIs $100k-200k, 100.0% for AGIs over 200k)
Averages for the 2012 tax year for zip code 29847, filed in 2013:
Average Adjusted Gross Income (AGI) in 2012: $38,974 (Individual Income Tax Returns)
Here:
$38,974
State:
$51,133
Salary/wage: $35,064 (reported on 88.3% of returns)
Here:
$35,064
State:
$42,173
(% of AGI for various income ranges: 83.1% for AGIs below $25k, 83.7% for AGIs $25k-50k, 83.4% for AGIs $50k-75k, 79.6% for AGIs $75k-100k, 70.4% for AGIs $100k-200k)
Taxable interest for individuals: $1,369 (reported on 17.0% of returns)
This zip code:
$1,369
South Carolina:
$1,468
(% of AGI for various income ranges: 0.4% for AGIs below $25k, 0.5% for AGIs $25k-50k, 0.2% for AGIs $50k-75k, 0.2% for AGIs $75k-100k, 1.3% for AGIs $100k-200k)
Ordinary dividends: $2,276 (reported on 8.3% of returns)
Here:
$2,276
State:
$6,511
(% of AGI for various income ranges: 0.2% for AGIs below $25k, 0.2% for AGIs $25k-50k, 0.9% for AGIs $50k-75k, 0.6% for AGIs $75k-100k, 0.6% for AGIs $100k-200k)
Net capital gain/loss in AGI: +$2,582 (reported on 5.3% of returns)
Here:
+$2,582
State:
+$13,061
(% of AGI for various income ranges: 0.7% for AGIs $50k-75k, 0.8% for AGIs $100k-200k)
Profit/loss from business: +$5,277 (reported on 15.0% of returns)
Here:
+$5,277
State:
+$10,167
(% of AGI for various income ranges: 5.1% for AGIs below $25k, 2.0% for AGIs $25k-50k, 0.5% for AGIs $50k-75k, 0.6% for AGIs $75k-100k, 2.0% for AGIs $100k-200k)
Taxable individual retirement arrangement distribution: $12,160 (reported on 7.3% of returns)
29847:
$12,160
South Carolina:
$17,019
(% of AGI for various income ranges: 1.2% for AGIs below $25k, 1.8% for AGIs $25k-50k, 2.0% for AGIs $50k-75k, 2.8% for AGIs $75k-100k, 3.3% for AGIs $100k-200k)
Total itemized deductions: $19,650 (23% of AGI, reported on 20.4% of returns)
Here:
$19,650
State:
$22,890
Here:
23.3% of AGI
State:
21.4% of AGI
(% of AGI for various income ranges: 3.1% for AGIs below $25k, 7.4% for AGIs $25k-50k, 11.6% for AGIs $50k-75k, 13.6% for AGIs $75k-100k, 14.7% for AGIs $100k-200k)
Charity contributions: $4,611 (reported on 18.4% of returns)
Here:
$4,611
State:
$5,169
(% of AGI for various income ranges: 0.6% for AGIs below $25k, 1.1% for AGIs $25k-50k, 2.7% for AGIs $50k-75k, 2.8% for AGIs $75k-100k, 3.6% for AGIs $100k-200k)
Taxes paid: $6,155 (reported on 20.4% of returns)
29847:
$6,155
State:
$7,644
(% of AGI for various income ranges: 0.5% for AGIs below $25k, 1.4% for AGIs $25k-50k, 3.0% for AGIs $50k-75k, 4.3% for AGIs $75k-100k, 6.2% for AGIs $100k-200k)
Earned income credit: $2,395 (reported on 30.1% of returns)
Here:
$2,395
State:
$2,418
(% of AGI for various income ranges: 9.2% for AGIs below $25k, 1.4% for AGIs $25k-50k)
Percentage of individuals using paid preparers for their 2012 taxes: 58.7%
Here:
59%
State:
57%
(% for various income ranges: 54.5% for AGIs below $25k, 57.1% for AGIs $25k-50k, 66.7% for AGIs $50k-75k, 69.2% for AGIs $75k-100k, 71.4% for AGIs $100k-200k)
Averages for the 2004 tax year for zip code 29847, filed in 2005:
Average Adjusted Gross Income (AGI) in 2004: $32,808 (Individual Income Tax Returns)
Here:
$32,808
State:
$41,965
Salary/wage: $31,470 (reported on 88.9% of returns)
Here:
$31,470
State:
$35,695
(% of AGI for various income ranges: 103.9% for AGIs below $10k, 85.1% for AGIs $10k-25k, 86.3% for AGIs $25k-50k, 87.8% for AGIs $50k-75k, 87.3% for AGIs $75k-100k, 74.6% for AGIs over 100k)
Taxable interest for individuals: $826 (reported on 25.4% of returns)
This zip code:
$826
South Carolina:
$1,623
(% of AGI for various income ranges: 0.9% for AGIs below $10k, 0.8% for AGIs $10k-25k, 0.4% for AGIs $25k-50k, 0.5% for AGIs $50k-75k, 0.5% for AGIs $75k-100k, 1.1% for AGIs over 100k)
Taxable dividends: $1,368 (reported on 9.3% of returns)
Here:
$1,368
State:
$3,999
(% of AGI for various income ranges: 0.2% for AGIs $10k-25k, 0.8% for AGIs $25k-50k, 0.2% for AGIs $50k-75k, 0.1% for AGIs $75k-100k, 0.5% for AGIs over 100k)
Net capital gain/loss: +$2,858 (reported on 7.7% of returns)
Here:
+$2,858
State:
+$13,100
(% of AGI for various income ranges: -0.0% for AGIs $10k-25k, 0.3% for AGIs $25k-50k, 1.3% for AGIs $50k-75k, 0.6% for AGIs $75k-100k, 1.4% for AGIs over 100k)
Profit/loss from business: +$1,333 (reported on 12.7% of returns)
Here:
+$1,333
State:
+$9,144
(% of AGI for various income ranges: -8.4% for AGIs below $10k, 3.1% for AGIs $10k-25k, 0.6% for AGIs $25k-50k, 0.6% for AGIs $50k-75k, -0.5% for AGIs $75k-100k, -0.2% for AGIs over 100k)
IRA payment deduction: $3,190 (reported on 1.1% of returns)
29847:
$3,190
South Carolina:
$2,972
Total itemized deductions: $16,098 (27% of AGI, reported on 28.2% of returns)
Here:
$16,098
State:
$19,039
Here:
26.6% of AGI
State:
22.8% of AGI
(% of AGI for various income ranges: 10.9% for AGIs below $10k, 7.4% for AGIs $10k-25k, 12.0% for AGIs $25k-50k, 16.9% for AGIs $50k-75k, 18.5% for AGIs $75k-100k, 16.0% for AGIs over 100k)
Charity contributions deductions: $3,946 (6% of AGI, reported on 25.3% of returns)
Here:
$3,946
State:
$4,305
Here:
6.4% of AGI
State:
5.0% of AGI
(% of AGI for various income ranges: 1.0% for AGIs below $10k, 1.3% for AGIs $10k-25k, 2.3% for AGIs $25k-50k, 3.8% for AGIs $50k-75k, 4.5% for AGIs $75k-100k, 4.3% for AGIs over 100k)
Total tax: $3,792 (reported on 64.4% of returns)
29847:
$3,792
State:
$6,497
(% of AGI for various income ranges: 2.1% for AGIs below $10k, 2.7% for AGIs $10k-25k, 5.6% for AGIs $25k-50k, 8.1% for AGIs $50k-75k, 9.5% for AGIs $75k-100k, 14.3% for AGIs over 100k)
Earned income credit: $1,965 (reported on 30.8% of returns)
Here:
$1,965
State:
$1,882
Percentage of individuals using paid preparers for their 2004 taxes: 69.7%
Here:
70%
State:
66%
(% for various income ranges: 62.7% for AGIs below $10k, 73.9% for AGIs $10k-25k, 69.4% for AGIs $25k-50k, 68.6% for AGIs $50k-75k, 67.9% for AGIs $75k-100k, 80.3% for AGIs over 100k)
Household received Food Stamps/SNAP in the past 12 months: 233 Household did not receive Food Stamps/SNAP in the past 12 months: 1,547
Women who had a birth in the past 12 months: 103 (69 now married, 34 unmarried) Women who did not have a birth in the past 12 months: 901 (461 now married, 442 unmarried)
Housing units in zip code 29847 with a mortgage: 658 (24 second mortgage, 14 both second mortgage and home equity loan) Houses without a mortgage: 1
Median monthly owner costs for units with a mortgage: $1,175 Median monthly owner costs for units without a mortgage: $354
Residents with income below the poverty level in 2022:
This zip code:
16.2%
Whole state:
14.0%
Residents with income below 50% of the poverty level in 2022:
This zip code:
8.4%
Whole state:
7.3%
Median number of rooms in houses and condos:
Here:
6.1
State:
6.4
Median number of rooms in apartments:
Here:
5.0
State:
4.5
Notable locations in this zip code not listed on our city pages
Notable locations in zip code 29847: Camp Cofitachiqui (A), Cooks Poultry Farm (B), Sage Mill Station Fire Department (C), Eureka Fire Department (D), Trenton Fire Department Trenton (E), Trenton Correctional Institution (F). Display/hide their locations on the map
Churches in zip code 29847 include: Shaws Creek Church (A), Pine Grove Church (B), Mount Sinai Baptist Church (C), Ebenezer Church (D), Eureka Church (E), Horn Creek Church (F), Mount Zion Church (G), Union Church (H), Springfield Memorial Baptist Church (I). Display/hide their locations on the map
Cemeteries: Nicholson Cemetery (1), Marsh Cemetery (2), Brown Cemetery (3), Busbee Cemetery (4), Wicker Cemetery (5). Display/hide their locations on the map
Lakes and reservoirs: Strobles Pond (A), Smiths Lake (B), Simons Lake (C), Reynolds Pond (D), Millers Pond (E), Woodwards Lake (F), Carpenters Pond (G), Eggleston Lake (H). Display/hide their locations on the map
Streams, rivers, and creeks: Paces Branch (A), Spring Branch (B), Hillyer Branch (C), Hall Branch (D), Red Hill Branch (E), Quarles Creek (F), Monday Branch (G), Gilroy Branch (H), Clearwater Branch (I). Display/hide their locations on the map
In group quarters: 514 (-1 institutionalized population)
Size of family households: 588 2-persons, 316 3-persons, 135 4-persons, 211 5-persons, 20 6-persons
Size of nonfamily households: 383 1-person, 119 2-persons
502 married couples with children.
359 single-parent households (68 men, 291 women).
99.2% of residents of 29847 zip code speak English at home.
0.2% of residents speak Spanish at home (64% very well, 36% not well).
Foreign born population: 116 (2.2%) (57.2% of them are naturalized citizens)
This zip code:
2.2%
Whole state:
5.2%
37%Honduras
20%Belize
14%Germany
13%Norway
18%American
8%African
7%English
3%German
3%Scotch-Irish
2%Scottish
1%Irish
Year of entry for the foreign-born population
472010 or later
392000 to 2009
301990 to 1999
39Before 1990
Facilities with environmental interests located in this zip code:
DOUGLAS ELEMENTARY SCHOOL (215 S. E. DIGGS ROAD in TRENTON, SC)
(National Center for Education Statistics) - STATE ID-1901003 STATE MASTER (South Carolina database) - DRINKING WATER PROGRAM Organizations: EDGEFIELD COUNTY SCHOOL DISTRICT (SCHOOL DISTRICT)
COMPONENTS MANUFACTURING CO (14 PINE HOUSE RD in TRENTON, SC)
AIR SYNTHETIC MINOR (AIRS/AFS) CRITERIA AND HAZARDOUS AIR POLLUTANT INVENTORY (Inventory of air pollution sources) Conditionally Exempt Small Quantity Generators, less than 100 kg/month of hazardous waste (Resource Conservation and Recovery Act (tracking hazardous waste)) - notification STATE MASTER (South Carolina database) - AIR PROGRAM, HAZARDOUS WASTE PROGRAM, AIR MAJOR TRI REPORTER (Tracking of toxic chemicals releasing facilities) Business SIC classification: AIR-CONDITIONING AND WARM AIR HEATING EQUIPMENT AND COMMERCIAL AND INDUSTRIAL REFRIGERATION EQUIPMENT Organizations: ENVIRONMENTAL PLANNING SPECIALISTS INC (CONTACT/ENGINEERING/CONSULTING FIRM)
, RHEEM MANUFACTURING CO (CONTACT/OWNER)
Alternative names: COMPONENTS MANUFACTURING COMPANY
BONDEX (2 MAXWELL DRIVE in TRENTON, SC)
AIR MINOR (AIRS/AFS) STATE MASTER (South Carolina database) - AIR PROGRAM Business SIC classification: TEXTILE GOODS
G L WILLIAMS/EUREKA MINE (SC HIGHWAY 191 in TRENTON, SC)
National Pollutant Discharge Elimination System NON-MAJOR (Tracking pollutant discharge elimination systems) - permit Business SIC classification: MISCELLANEOUS NONMETALLIC MINERALS, EXCEPT FUELS Alternative names: GL WILLIAMS/EUREKA MINE
Housing units lacking complete plumbing facilities: 2.8% Housing units lacking complete kitchen facilities: 3.8%
77.9%Electricity
12.1%Bottled, tank, or LP gas
5.9%No fuel used
3.1%Utility gas
1.0%Wood
Population in 1990: 2,825. Population change in the 1990s: +1,249 (+44.2%).
Place of birth for U.S.-born residents:
This state: 2,120
Northeast: 395
Midwest: 347
South: 2,077
West: 111
68% of the 29847 zip code residents lived in the same house 5 years ago. Out of people who lived in different houses, 28% lived in this county. Out of people who lived in different counties, 50% lived in South Carolina.
86% of the 29847 zip code residents lived in the same house 1 year ago. Out of people who lived in different houses, 13% moved from this county. Out of people who lived in different houses, 71% moved from different county within same state. Out of people who lived in different houses, 16% moved from different state. Out of people who lived in different houses, 4% moved from abroad.
Private vs. public school enrollment:
Students in private schools in grades 1 to 8 (elementary and middle school):
Here:
0.0%
South Carolina:
14.4%
Students in private schools in grades 9 to 12 (high school): 16
Here:
8.2%
South Carolina:
11.1%
Students in private undergraduate colleges: 75
Here:
38.2%
South Carolina:
21.9%
Occupation by median earnings in the past 12 months ($)
128,323Management occupations
105,555Installation, maintenance, and repair occupations
80,980Health diagnosing and treating practitioners and other technical occupations
73,441Transportation occupations
59,076Fire fighting and prevention, and other protective service workers including supervisors
42,010Production occupations
Top industries in this zip code by the number of employees in 2005:
Administrative and Support and Waste Management and Remediation Services: Temporary Help Services (100-249 employees: 1 establishment)
Health Care and Social Assistance: Other Individual and Family Services (20-49: 1)
Accommodation and Food Services: Full-Service Restaurants (10-19: 1)
People in group quarters in 2010:
627 people in state prisons
People in group quarters in 2000:
504 people in state prisons
Fatal accident statistics in 2014:
Fatal accident count: 1
Vehicles involved in fatal accidents: 1
Fatal accidents caused by drunken drivers: 0
Fatalities: 1
Persons involved in fatal accidents: 1
Pedestrians involved in fatal accidents: 1
Fatal accident statistics in 2012:
Fatal accident count: 1
Vehicles involved in fatal accidents: 1
Fatal accidents caused by drunken drivers: 1
Fatalities: 1
Persons involved in fatal accidents: 1
Pedestrians involved in fatal accidents: 0
Home Mortgage Disclosure Act Aggregated Statistics For Year 2009 (Based on 2 partial tracts)
A) FHA, FSA/RHS & VA Home Purchase Loans
B) Conventional Home Purchase Loans
C) Refinancings
D) Home Improvement Loans
F) Non-occupant Loans on < 5 Family Dwellings (A B C & D)
G) Loans On Manufactured Home Dwelling (A B C & D)
Number
Average Value
Number
Average Value
Number
Average Value
Number
Average Value
Number
Average Value
Number
Average Value
LOANS ORIGINATED
6
$130,762
9
$101,850
31
$120,642
0
$0
4
$101,912
5
$49,496
APPLICATIONS APPROVED, NOT ACCEPTED
0
$0
0
$0
2
$62,530
0
$0
0
$0
0
$0
APPLICATIONS DENIED
2
$53,315
7
$58,047
20
$110,402
1
$85,130
1
$117,160
9
$62,894
APPLICATIONS WITHDRAWN
1
$316,810
1
$179,910
8
$114,252
0
$0
0
$0
0
$0
FILES CLOSED FOR INCOMPLETENESS
0
$0
0
$0
4
$101,582
0
$0
0
$0
1
$82,060
Aggregated Statistics For Year 2008 (Based on 2 partial tracts)
A) FHA, FSA/RHS & VA Home Purchase Loans
B) Conventional Home Purchase Loans
C) Refinancings
D) Home Improvement Loans
F) Non-occupant Loans on < 5 Family Dwellings (A B C & D)
G) Loans On Manufactured Home Dwelling (A B C & D)
Number
Average Value
Number
Average Value
Number
Average Value
Number
Average Value
Number
Average Value
Number
Average Value
LOANS ORIGINATED
6
$129,447
13
$102,983
24
$126,850
5
$85,214
9
$86,688
7
$67,324
APPLICATIONS APPROVED, NOT ACCEPTED
1
$53,530
2
$53,315
3
$47,977
2
$18,210
1
$57,040
1
$120,670
APPLICATIONS DENIED
2
$89,735
7
$57,921
18
$102,338
9
$48,024
1
$94,340
10
$53,841
APPLICATIONS WITHDRAWN
0
$0
1
$109,260
8
$111,949
0
$0
1
$57,040
0
$0
FILES CLOSED FOR INCOMPLETENESS
0
$0
0
$0
1
$256,260
0
$0
0
$0
0
$0
Aggregated Statistics For Year 2007 (Based on 2 partial tracts)
A) FHA, FSA/RHS & VA Home Purchase Loans
B) Conventional Home Purchase Loans
C) Refinancings
D) Home Improvement Loans
F) Non-occupant Loans on < 5 Family Dwellings (A B C & D)
G) Loans On Manufactured Home Dwelling (A B C & D)
Number
Average Value
Number
Average Value
Number
Average Value
Number
Average Value
Number
Average Value
Number
Average Value
LOANS ORIGINATED
4
$128,458
19
$100,878
32
$84,935
8
$55,344
7
$67,324
10
$51,778
APPLICATIONS APPROVED, NOT ACCEPTED
0
$0
3
$66,113
9
$79,374
2
$48,925
1
$55,290
4
$46,075
APPLICATIONS DENIED
1
$129,880
7
$75,724
32
$81,960
15
$50,169
2
$84,470
9
$46,561
APPLICATIONS WITHDRAWN
0
$0
1
$284,340
15
$98,905
1
$26,330
0
$0
0
$0
FILES CLOSED FOR INCOMPLETENESS
0
$0
0
$0
2
$111,235
0
$0
0
$0
0
$0
Aggregated Statistics For Year 2006 (Based on 2 partial tracts)
A) FHA, FSA/RHS & VA Home Purchase Loans
B) Conventional Home Purchase Loans
C) Refinancings
D) Home Improvement Loans
F) Non-occupant Loans on < 5 Family Dwellings (A B C & D)
G) Loans On Manufactured Home Dwelling (A B C & D)
Number
Average Value
Number
Average Value
Number
Average Value
Number
Average Value
Number
Average Value
Number
Average Value
LOANS ORIGINATED
4
$125,715
23
$151,825
35
$91,120
7
$36,734
9
$224,080
11
$65,740
APPLICATIONS APPROVED, NOT ACCEPTED
0
$0
4
$51,888
9
$77,619
3
$59,677
1
$39,930
3
$35,837
APPLICATIONS DENIED
0
$0
14
$64,566
38
$86,501
14
$55,446
4
$82,165
14
$56,386
APPLICATIONS WITHDRAWN
0
$0
3
$86,150
16
$104,983
3
$71,670
0
$0
2
$85,345
FILES CLOSED FOR INCOMPLETENESS
0
$0
0
$0
4
$97,412
0
$0
0
$0
0
$0
Aggregated Statistics For Year 2005 (Based on 2 partial tracts)
A) FHA, FSA/RHS & VA Home Purchase Loans
B) Conventional Home Purchase Loans
C) Refinancings
D) Home Improvement Loans
F) Non-occupant Loans on < 5 Family Dwellings (A B C & D)
G) Loans On Manufactured Home Dwelling (A B C & D)
Number
Average Value
Number
Average Value
Number
Average Value
Number
Average Value
Number
Average Value
Number
Average Value
LOANS ORIGINATED
2
$89,075
24
$113,631
25
$88,971
5
$36,420
10
$106,892
7
$58,110
APPLICATIONS APPROVED, NOT ACCEPTED
0
$0
3
$87,613
11
$91,310
0
$0
0
$0
3
$47,977
APPLICATIONS DENIED
0
$0
15
$55,845
39
$96,750
13
$37,905
2
$27,425
18
$53,241
APPLICATIONS WITHDRAWN
0
$0
6
$92,148
22
$91,669
4
$129,775
2
$58,360
2
$57,700
FILES CLOSED FOR INCOMPLETENESS
0
$0
0
$0
5
$139,188
2
$40,810
0
$0
0
$0
Aggregated Statistics For Year 2004 (Based on 2 partial tracts)
A) FHA, FSA/RHS & VA Home Purchase Loans
B) Conventional Home Purchase Loans
C) Refinancings
D) Home Improvement Loans
F) Non-occupant Loans on < 5 Family Dwellings (A B C & D)
G) Loans On Manufactured Home Dwelling (A B C & D)
Number
Average Value
Number
Average Value
Number
Average Value
Number
Average Value
Number
Average Value
Number
Average Value
LOANS ORIGINATED
5
$83,548
28
$80,865
35
$83,284
4
$54,520
6
$71,670
16
$51,724
APPLICATIONS APPROVED, NOT ACCEPTED
0
$0
4
$87,430
6
$72,913
2
$27,865
0
$0
3
$53,093
APPLICATIONS DENIED
1
$93,900
12
$44,794
39
$77,173
5
$23,168
3
$47,243
14
$43,598
APPLICATIONS WITHDRAWN
0
$0
2
$125,715
19
$82,748
1
$70,650
0
$0
4
$44,428
FILES CLOSED FOR INCOMPLETENESS
0
$0
0
$0
9
$80,690
0
$0
0
$0
1
$66,260
Aggregated Statistics For Year 2003 (Based on 2 partial tracts)
A) FHA, FSA/RHS & VA Home Purchase Loans
B) Conventional Home Purchase Loans
C) Refinancings
D) Home Improvement Loans
F) Non-occupant Loans on < 5 Family Dwellings (A B C & D)
Number
Average Value
Number
Average Value
Number
Average Value
Number
Average Value
Number
Average Value
LOANS ORIGINATED
3
$72,693
21
$72,924
64
$83,605
4
$22,380
9
$45,977
APPLICATIONS APPROVED, NOT ACCEPTED
0
$0
5
$48,356
12
$82,567
0
$0
1
$24,570
APPLICATIONS DENIED
0
$0
20
$44,034
37
$84,012
3
$12,287
4
$52,985
APPLICATIONS WITHDRAWN
1
$64,940
4
$71,525
24
$68,307
0
$0
1
$38,180
FILES CLOSED FOR INCOMPLETENESS
0
$0
1
$44,760
4
$67,575
0
$0
0
$0
Aggregated Statistics For Year 2002 (Based on 2 partial tracts)
A) FHA, FSA/RHS & VA Home Purchase Loans
B) Conventional Home Purchase Loans
C) Refinancings
D) Home Improvement Loans
F) Non-occupant Loans on < 5 Family Dwellings (A B C & D)
Number
Average Value
Number
Average Value
Number
Average Value
Number
Average Value
Number
Average Value
LOANS ORIGINATED
2
$45,635
22
$73,080
52
$78,351
3
$15,797
9
$57,141
APPLICATIONS APPROVED, NOT ACCEPTED
0
$0
7
$51,026
12
$71,012
2
$29,400
1
$37,300
APPLICATIONS DENIED
1
$86,440
21
$45,489
43
$74,178
2
$13,165
5
$59,414
APPLICATIONS WITHDRAWN
1
$84,250
1
$51,340
23
$72,173
0
$0
2
$58,800
FILES CLOSED FOR INCOMPLETENESS
0
$0
1
$51,340
4
$76,680
0
$0
0
$0
Aggregated Statistics For Year 2001 (Based on 2 partial tracts)
A) FHA, FSA/RHS & VA Home Purchase Loans
B) Conventional Home Purchase Loans
C) Refinancings
D) Home Improvement Loans
F) Non-occupant Loans on < 5 Family Dwellings (A B C & D)
Number
Average Value
Number
Average Value
Number
Average Value
Number
Average Value
Number
Average Value
LOANS ORIGINATED
3
$71,963
29
$72,704
42
$70,041
7
$12,789
5
$31,068
APPLICATIONS APPROVED, NOT ACCEPTED
0
$0
10
$34,490
7
$56,981
1
$6,580
2
$30,715
APPLICATIONS DENIED
1
$25,890
38
$43,026
46
$62,529
5
$21,764
3
$33,640
APPLICATIONS WITHDRAWN
0
$0
1
$43,440
25
$59,888
0
$0
1
$44,760
FILES CLOSED FOR INCOMPLETENESS
0
$0
0
$0
3
$72,547
0
$0
0
$0
Aggregated Statistics For Year 2000 (Based on 2 partial tracts)
A) FHA, FSA/RHS & VA Home Purchase Loans
B) Conventional Home Purchase Loans
C) Refinancings
D) Home Improvement Loans
F) Non-occupant Loans on < 5 Family Dwellings (A B C & D)
Number
Average Value
Number
Average Value
Number
Average Value
Number
Average Value
Number
Average Value
LOANS ORIGINATED
4
$43,002
40
$52,766
25
$60,361
5
$14,480
7
$28,647
APPLICATIONS APPROVED, NOT ACCEPTED
2
$29,620
18
$49,219
9
$69,428
3
$27,207
0
$0
APPLICATIONS DENIED
4
$53,972
61
$41,039
43
$55,493
8
$14,700
2
$22,820
APPLICATIONS WITHDRAWN
1
$21,500
5
$68,980
19
$61,686
0
$0
1
$102,240
FILES CLOSED FOR INCOMPLETENESS
0
$0
1
$52,220
5
$51,778
0
$0
0
$0
Aggregated Statistics For Year 1999 (Based on 1 partial tract)
A) FHA, FSA/RHS & VA Home Purchase Loans
B) Conventional Home Purchase Loans
C) Refinancings
D) Home Improvement Loans
F) Non-occupant Loans on < 5 Family Dwellings (A B C & D)
Detailed PMIC statistics for the following Tracts:0203.00
2004 - 2018 National Fire Incident Reporting System (NFIRS) incidents
According to the data from the years 2004 - 2018 the average number of fires per year is 12. The highest number of reported fire incidents - 45 took place in 2017, and the least - 0 in 2011. The data has a rising trend.
When looking into fire subcategories, the most reports belonged to: Outside Fires (47.3%), and Structure Fires (41.8%).
Fire incident types reported to NFIRS in Zip Code 29847


 Nearest zip codes: 29850, 29829, 29832, 29860, 29828, 29834.


 According to the data from the years 2004 - 2018 the average number of fires per year is 12. The highest number of reported fire incidents - 45 took place in 2017, and the least - 0 in 2011. The data has a rising trend.
 When looking into fire subcategories, the most reports belonged to: Outside Fires (47.3%), and Structure Fires (41.8%).