Estimated median house/condo value in 2022: $143,669
29856:
$143,669
South Carolina:
$254,600
According to our research of South Carolina and other state lists, there was 1 registered sex offender living in 29856 zip code as of May 28, 2024. The ratio of all residents to sex offenders in zip code 29856 is 3,238 to 1. The ratio of registered sex offenders to all residents in this zip code is much lower than the state average.
Median resident age:
This zip code:
38.3 years
South Carolina median age:
40.5 years
Average household size:
This zip code:
2.9 people
South Carolina:
2.4 people
Averages for the 2020 tax year for zip code 29856, filed in 2021:
Average Adjusted Gross Income (AGI) in 2020: $43,546 (Individual Income Tax Returns)
Here:
$43,546
State:
$65,754
Salary/wage: $38,657 (reported on 78.0% of returns)
Here:
$38,657
State:
$52,566
(% of AGI for various income ranges: 1123.7% for AGIs below $25k, 3577.9% for AGIs $25k-50k, 6735.0% for AGIs $50k-75k, 9511.7% for AGIs $75k-100k, 16391.7% for AGIs $100k-200k)
Taxable interest for individuals: $391 (reported on 18.1% of returns)
This zip code:
$391
South Carolina:
$1,749
(% of AGI for various income ranges: 2.6% for AGIs below $25k, 11.7% for AGIs $25k-50k, 1.7% for AGIs $50k-75k, 26.7% for AGIs $75k-100k, 46.7% for AGIs $100k-200k)
Ordinary dividends: $4,169 (reported on 10.2% of returns)
Here:
$4,169
State:
$8,783
(% of AGI for various income ranges: 19.7% for AGIs below $25k, 38.6% for AGIs $25k-50k, 128.3% for AGIs $75k-100k, 463.3% for AGIs $100k-200k)
Net capital gain/loss in AGI: +$8,817 (reported on 9.4% of returns)
Here:
+$8,817
State:
+$24,194
(% of AGI for various income ranges: 18.9% for AGIs below $25k, 77.9% for AGIs $25k-50k, 495.0% for AGIs $75k-100k, 771.7% for AGIs $100k-200k)
Profit/loss from business: +$5,429 (reported on 22.0% of returns)
Here:
+$5,429
State:
+$11,253
(% of AGI for various income ranges: 319.7% for AGIs below $25k, 56.6% for AGIs $25k-50k, 176.7% for AGIs $50k-75k)
Taxable individual retirement arrangement distribution: $15,500 (reported on 6.3% of returns)
29856:
$15,500
South Carolina:
$21,604
(% of AGI for various income ranges: 161.0% for AGIs $25k-50k, 1288.3% for AGIs $75k-100k)
Total itemized deductions: $21,650 (reported on 3.1% of returns)
Here:
$21,650
State:
$35,199
(% of AGI for various income ranges: 721.7% for AGIs $50k-75k)
Charity contributions: $7,300 (reported on 1.6% of returns)
Here:
$7,300
State:
$14,319
(% of AGI for various income ranges: 50.3% for AGIs $25k-50k)
Taxes paid: $5,175 (reported on 3.1% of returns)
29856:
$5,175
State:
$7,486
(% of AGI for various income ranges: 172.5% for AGIs $50k-75k)
Earned income credit: $2,622 (reported on 28.3% of returns)
Here:
$2,622
State:
$2,397
(% of AGI for various income ranges: 166.3% for AGIs below $25k, 107.6% for AGIs $25k-50k)
Percentage of individuals using paid preparers for their 2020 taxes: 92.9%
Here:
93%
State:
93%
(% for various income ranges: 90.4% for AGIs below $25k, 91.9% for AGIs $25k-50k, 100.0% for AGIs $50k-75k, 90.0% for AGIs $75k-100k, 100.0% for AGIs $100k-200k)
Averages for the 2012 tax year for zip code 29856, filed in 2013:
Average Adjusted Gross Income (AGI) in 2012: $37,386 (Individual Income Tax Returns)
Here:
$37,386
State:
$51,133
Salary/wage: $34,135 (reported on 85.1% of returns)
Here:
$34,135
State:
$42,173
(% of AGI for various income ranges: 76.9% for AGIs below $25k, 80.9% for AGIs $25k-50k, 83.9% for AGIs $50k-75k, 82.4% for AGIs $75k-100k, 62.6% for AGIs $100k-200k)
Taxable interest for individuals: $429 (reported on 16.8% of returns)
This zip code:
$429
South Carolina:
$1,468
(% of AGI for various income ranges: 0.3% for AGIs below $25k, 0.1% for AGIs $25k-50k, 0.2% for AGIs $75k-100k, 0.2% for AGIs $100k-200k)
Ordinary dividends: $2,338 (reported on 7.9% of returns)
Here:
$2,338
State:
$6,511
Profit/loss from business: +$8,456 (reported on 15.8% of returns)
Here:
+$8,456
State:
+$10,167
(% of AGI for various income ranges: 13.2% for AGIs below $25k, 4.8% for AGIs $25k-50k, 0.1% for AGIs $75k-100k)
Taxable individual retirement arrangement distribution: $12,533 (reported on 5.9% of returns)
29856:
$12,533
South Carolina:
$17,019
Total itemized deductions: $17,290 (25% of AGI, reported on 20.8% of returns)
Here:
$17,290
State:
$22,890
Here:
24.7% of AGI
State:
21.4% of AGI
(% of AGI for various income ranges: 8.0% for AGIs below $25k, 7.5% for AGIs $25k-50k, 9.3% for AGIs $50k-75k, 14.7% for AGIs $75k-100k, 10.6% for AGIs $100k-200k)
Charity contributions: $4,300 (reported on 15.8% of returns)
Here:
$4,300
State:
$5,169
(% of AGI for various income ranges: 1.7% for AGIs $25k-50k, 2.1% for AGIs $50k-75k, 3.9% for AGIs $75k-100k, 1.6% for AGIs $100k-200k)
Taxes paid: $4,819 (reported on 20.8% of returns)
29856:
$4,819
State:
$7,644
(% of AGI for various income ranges: 0.6% for AGIs below $25k, 1.5% for AGIs $25k-50k, 2.5% for AGIs $50k-75k, 4.2% for AGIs $75k-100k, 5.3% for AGIs $100k-200k)
Earned income credit: $2,635 (reported on 33.7% of returns)
Here:
$2,635
State:
$2,418
(% of AGI for various income ranges: 11.4% for AGIs below $25k, 1.8% for AGIs $25k-50k)
Percentage of individuals using paid preparers for their 2012 taxes: 65.3%
Here:
65%
State:
57%
(% for various income ranges: 61.7% for AGIs below $25k, 67.7% for AGIs $25k-50k, 66.7% for AGIs $50k-75k, 71.4% for AGIs $75k-100k, 75.0% for AGIs $100k-200k)
Averages for the 2004 tax year for zip code 29856, filed in 2005:
Average Adjusted Gross Income (AGI) in 2004: $28,420 (Individual Income Tax Returns)
Here:
$28,420
State:
$41,965
Salary/wage: $28,196 (reported on 88.8% of returns)
Here:
$28,196
State:
$35,695
(% of AGI for various income ranges: 117.4% for AGIs below $10k, 82.0% for AGIs $10k-25k, 89.0% for AGIs $25k-50k, 92.0% for AGIs $50k-75k, 86.1% for AGIs $75k-100k, 79.6% for AGIs over 100k)
Taxable interest for individuals: $457 (reported on 23.4% of returns)
This zip code:
$457
South Carolina:
$1,623
(% of AGI for various income ranges: 2.4% for AGIs below $10k, 0.5% for AGIs $10k-25k, 0.4% for AGIs $25k-50k, 0.2% for AGIs $50k-75k, 0.2% for AGIs $75k-100k)
Taxable dividends: $519 (reported on 7.8% of returns)
Here:
$519
State:
$3,999
(% of AGI for various income ranges: 1.1% for AGIs below $10k, 0.1% for AGIs $10k-25k, 0.1% for AGIs $25k-50k, 0.3% for AGIs $75k-100k)
Net capital gain/loss: +$1,064 (reported on 4.7% of returns)
Here:
+$1,064
State:
+$13,100
Profit/loss from business: +$5,080 (reported on 12.6% of returns)
Here:
+$5,080
State:
+$9,144
(% of AGI for various income ranges: 10.0% for AGIs below $10k, 5.9% for AGIs $10k-25k, 2.8% for AGIs $25k-50k, -0.9% for AGIs $50k-75k)
IRA payment deduction: $3,083 (reported on 1.2% of returns)
29856:
$3,083
South Carolina:
$2,972
Total itemized deductions: $14,796 (27% of AGI, reported on 20.2% of returns)
Here:
$14,796
State:
$19,039
Here:
26.5% of AGI
State:
22.8% of AGI
(% of AGI for various income ranges: 6.2% for AGIs $10k-25k, 9.9% for AGIs $25k-50k, 14.1% for AGIs $50k-75k, 13.3% for AGIs $75k-100k, 14.6% for AGIs over 100k)
Charity contributions deductions: $3,093 (6% of AGI, reported on 17.3% of returns)
Here:
$3,093
State:
$4,305
Here:
5.5% of AGI
State:
5.0% of AGI
(% of AGI for various income ranges: 1.0% for AGIs $10k-25k, 1.5% for AGIs $25k-50k, 2.7% for AGIs $50k-75k, 2.8% for AGIs $75k-100k, 2.8% for AGIs over 100k)
Total tax: $3,276 (reported on 61.7% of returns)
29856:
$3,276
State:
$6,497
(% of AGI for various income ranges: 2.1% for AGIs below $10k, 3.3% for AGIs $10k-25k, 5.1% for AGIs $25k-50k, 8.9% for AGIs $50k-75k, 10.4% for AGIs $75k-100k, 17.6% for AGIs over 100k)
Earned income credit: $2,094 (reported on 33.3% of returns)
Here:
$2,094
State:
$1,882
Percentage of individuals using paid preparers for their 2004 taxes: 71.0%
Here:
71%
State:
66%
(% for various income ranges: 67.8% for AGIs below $10k, 72.8% for AGIs $10k-25k, 74.3% for AGIs $25k-50k, 64.8% for AGIs $50k-75k, 68.1% for AGIs $75k-100k, 76.9% for AGIs over 100k)
Household received Food Stamps/SNAP in the past 12 months: 207 Household did not receive Food Stamps/SNAP in the past 12 months: 886
Women who had a birth in the past 12 months: 86 (11 now married, 68 unmarried) Women who did not have a birth in the past 12 months: 669 (307 now married, 362 unmarried)
Housing units in zip code 29856 with a mortgage: 384 (19 second mortgage, 20 both second mortgage and home equity loan) Houses without a mortgage: 28
Median monthly owner costs for units with a mortgage: $1,148 Median monthly owner costs for units without a mortgage: $298
Residents with income below the poverty level in 2022:
This zip code:
17.2%
Whole state:
14.0%
Residents with income below 50% of the poverty level in 2022:
This zip code:
11.6%
Whole state:
7.3%
Median number of rooms in houses and condos:
Here:
6.6
State:
6.4
Median number of rooms in apartments:
Here:
5.9
State:
4.5
Notable locations in this zip code not listed on our city pages
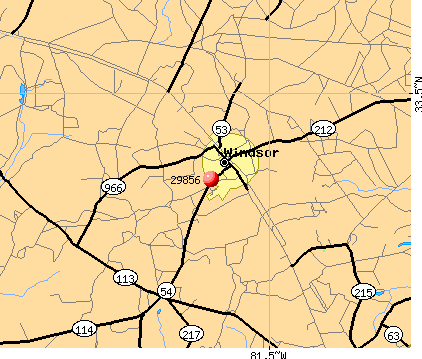
Churches in zip code 29856 include: Cedar Branch Church (A), Beulah Grove Church (B), First Baptist Church of Windsor (C), Mount Beulah Baptist Church (D), Hillcrest Church (E), Spring Branch Baptist Church (F). Display/hide their locations on the map
Streams, rivers, and creeks: Spring Branch (A), Hunter Branch (B), Cedar Creek (C), Burcalo Creek (D), Beulah Fork (E). Display/hide their locations on the map
Size of family households: 363 2-persons, 183 3-persons, 267 4-persons, 75 5-persons
Size of nonfamily households: 174 1-person, 18 2-persons
519 married couples with children.
92 single-parent households (3 men, 89 women).
73.8% of residents of 29856 zip code speak English at home.
25.5% of residents speak Spanish at home (68% very well, 24% well, 9% not well).
Foreign born population: 418 (13.3%) (39.8% of them are naturalized citizens)
This zip code:
13.3%
Whole state:
5.2%
65%Honduras
17%Guatemala
8%Costa Rica
4%El Salvador
28%American
9%English
6%Italian
4%German
2%French
2%Scottish
1%Dutch
Year of entry for the foreign-born population
1342010 or later
542000 to 2009
701990 to 1999
163Before 1990
Housing units lacking complete plumbing facilities: 1.7% Housing units lacking complete kitchen facilities: 1.8%
89.4%Electricity
5.3%Utility gas
2.6%Bottled, tank, or LP gas
1.6%No fuel used
1.4%Wood
Population in 1990: 2,264. Population change in the 1990s: +296 (+13.1%).
Place of birth for U.S.-born residents:
This state: 1,326
Northeast: 320
Midwest: 185
South: 800
West: 89
59% of the 29856 zip code residents lived in the same house 5 years ago. Out of people who lived in different houses, 70% lived in this county. Out of people who lived in different counties, 50% lived in South Carolina.
97% of the 29856 zip code residents lived in the same house 1 year ago. Out of people who lived in different houses, 2% moved from this county. Out of people who lived in different houses, 3% moved from different county within same state. Out of people who lived in different houses, 108% moved from different state.
Private vs. public school enrollment:
Students in private schools in grades 1 to 8 (elementary and middle school): 96
Here:
23.7%
South Carolina:
14.4%
Students in private schools in grades 9 to 12 (high school):
Here:
0.0%
South Carolina:
11.1%
Students in private undergraduate colleges: 14
Here:
15.7%
South Carolina:
21.9%
Occupation by median earnings in the past 12 months ($)
129,893Health diagnosing and treating practitioners and other technical occupations
58,489Architecture and engineering occupations
54,651Management occupations
49,509Production occupations
40,360Education, training, and library occupations
31,407Transportation occupations
Top industries in this zip code by the number of employees in 2005:
Administrative and Support and Waste Management and Remediation Services: Office Administrative Services (10-19 employees: 1 establishment)
Construction: Painting and Wall Covering Contractors (10-19: 1)
Construction: Drywall and Insulation Contractors (5-9: 1, 1-4: 1)
Construction: Plumbing, Heating, and Air-Conditioning Contractors (5-9: 1, 1-4: 1)
Administrative and Support and Waste Management and Remediation Services: Janitorial Services (5-9: 1)
Construction: Framing Contractors (5-9: 1)
Construction: Masonry Contractors (5-9: 1)
Wholesale Trade: Paint, Varnish, and Supplies Merchant Wholesalers (5-9: 1)
Mining: Drilling Oil and Gas Wells (1-4: 1)
Fatal accident statistics in 2010:
Fatal accident count: 1
Vehicles involved in fatal accidents: 1
Fatal accidents caused by drunken drivers: 1
Fatalities: 1
Persons involved in fatal accidents: 1
Pedestrians involved in fatal accidents: 0
Home Mortgage Disclosure Act Aggregated Statistics For Year 2009 (Based on 2 partial tracts)
A) FHA, FSA/RHS & VA Home Purchase Loans
B) Conventional Home Purchase Loans
C) Refinancings
D) Home Improvement Loans
F) Non-occupant Loans on < 5 Family Dwellings (A B C & D)
G) Loans On Manufactured Home Dwelling (A B C & D)
Number
Average Value
Number
Average Value
Number
Average Value
Number
Average Value
Number
Average Value
Number
Average Value
LOANS ORIGINATED
3
$84,730
15
$127,154
47
$171,743
3
$81,603
3
$111,743
12
$61,416
APPLICATIONS APPROVED, NOT ACCEPTED
1
$75,920
2
$52,460
5
$176,742
1
$119,420
0
$0
3
$72,503
APPLICATIONS DENIED
3
$98,093
8
$60,242
31
$117,164
3
$46,347
2
$55,445
14
$41,736
APPLICATIONS WITHDRAWN
0
$0
0
$0
18
$126,291
3
$14,500
1
$68,240
1
$24,740
FILES CLOSED FOR INCOMPLETENESS
0
$0
2
$149,275
8
$156,525
1
$8,530
0
$0
3
$52,887
Aggregated Statistics For Year 2008 (Based on 2 partial tracts)
A) FHA, FSA/RHS & VA Home Purchase Loans
B) Conventional Home Purchase Loans
C) Refinancings
D) Home Improvement Loans
F) Non-occupant Loans on < 5 Family Dwellings (A B C & D)
G) Loans On Manufactured Home Dwelling (A B C & D)
Number
Average Value
Number
Average Value
Number
Average Value
Number
Average Value
Number
Average Value
Number
Average Value
LOANS ORIGINATED
9
$132,214
21
$111,580
36
$150,862
4
$47,768
9
$114,397
20
$65,126
APPLICATIONS APPROVED, NOT ACCEPTED
1
$204,720
7
$58,247
11
$122,987
0
$0
3
$27,580
12
$66,250
APPLICATIONS DENIED
1
$39,240
20
$62,824
37
$106,879
18
$55,966
2
$43,505
30
$59,511
APPLICATIONS WITHDRAWN
2
$123,260
1
$173,160
14
$130,387
3
$89,280
0
$0
8
$96,389
FILES CLOSED FOR INCOMPLETENESS
0
$0
1
$30,710
9
$130,888
0
$0
1
$21,320
4
$132,002
Aggregated Statistics For Year 2007 (Based on 2 partial tracts)
A) FHA, FSA/RHS & VA Home Purchase Loans
B) Conventional Home Purchase Loans
C) Refinancings
D) Home Improvement Loans
F) Non-occupant Loans on < 5 Family Dwellings (A B C & D)
G) Loans On Manufactured Home Dwelling (A B C & D)
Number
Average Value
Number
Average Value
Number
Average Value
Number
Average Value
Number
Average Value
Number
Average Value
LOANS ORIGINATED
3
$96,103
48
$136,000
51
$157,103
9
$31,371
15
$154,734
34
$51,606
APPLICATIONS APPROVED, NOT ACCEPTED
0
$0
8
$88,072
6
$153,682
3
$87,290
1
$89,560
6
$74,780
APPLICATIONS DENIED
1
$127,100
22
$87,743
37
$145,379
25
$39,272
3
$72,790
32
$55,338
APPLICATIONS WITHDRAWN
0
$0
4
$295,565
15
$186,807
2
$82,315
3
$59,427
2
$31,990
FILES CLOSED FOR INCOMPLETENESS
0
$0
4
$74,638
8
$133,495
0
$0
2
$11,515
1
$25,590
Aggregated Statistics For Year 2006 (Based on 2 partial tracts)
A) FHA, FSA/RHS & VA Home Purchase Loans
B) Conventional Home Purchase Loans
C) Refinancings
D) Home Improvement Loans
F) Non-occupant Loans on < 5 Family Dwellings (A B C & D)
G) Loans On Manufactured Home Dwelling (A B C & D)
Number
Average Value
Number
Average Value
Number
Average Value
Number
Average Value
Number
Average Value
Number
Average Value
LOANS ORIGINATED
5
$138,186
44
$109,494
48
$141,171
15
$41,683
3
$103,780
26
$56,035
APPLICATIONS APPROVED, NOT ACCEPTED
1
$38,380
9
$75,159
12
$93,617
5
$32,756
1
$51,180
8
$31,668
APPLICATIONS DENIED
1
$49,470
22
$124,848
36
$81,864
21
$43,584
3
$211,260
27
$48,147
APPLICATIONS WITHDRAWN
0
$0
9
$171,548
19
$137,333
3
$78,477
0
$0
3
$37,817
FILES CLOSED FOR INCOMPLETENESS
0
$0
1
$360,820
5
$185,612
0
$0
0
$0
0
$0
Aggregated Statistics For Year 2005 (Based on 2 partial tracts)
A) FHA, FSA/RHS & VA Home Purchase Loans
B) Conventional Home Purchase Loans
C) Refinancings
D) Home Improvement Loans
F) Non-occupant Loans on < 5 Family Dwellings (A B C & D)
G) Loans On Manufactured Home Dwelling (A B C & D)
Number
Average Value
Number
Average Value
Number
Average Value
Number
Average Value
Number
Average Value
Number
Average Value
LOANS ORIGINATED
3
$112,027
35
$103,335
39
$90,265
13
$41,928
8
$47,021
25
$50,225
APPLICATIONS APPROVED, NOT ACCEPTED
0
$0
9
$75,443
8
$41,584
4
$40,945
2
$16,635
9
$53,739
APPLICATIONS DENIED
1
$57,150
26
$58,496
49
$72,557
21
$37,613
5
$116,860
41
$49,869
APPLICATIONS WITHDRAWN
1
$27,300
5
$140,062
26
$81,396
2
$75,490
1
$129,660
4
$61,202
FILES CLOSED FOR INCOMPLETENESS
0
$0
0
$0
3
$62,837
0
$0
0
$0
0
$0
Aggregated Statistics For Year 2004 (Based on 2 partial tracts)
A) FHA, FSA/RHS & VA Home Purchase Loans
B) Conventional Home Purchase Loans
C) Refinancings
D) Home Improvement Loans
F) Non-occupant Loans on < 5 Family Dwellings (A B C & D)
G) Loans On Manufactured Home Dwelling (A B C & D)
Number
Average Value
Number
Average Value
Number
Average Value
Number
Average Value
Number
Average Value
Number
Average Value
LOANS ORIGINATED
4
$79,542
55
$97,893
57
$96,494
6
$24,595
14
$83,289
43
$46,379
APPLICATIONS APPROVED, NOT ACCEPTED
0
$0
7
$67,996
10
$92,380
1
$17,060
0
$0
9
$50,611
APPLICATIONS DENIED
2
$88,285
20
$47,342
59
$84,779
10
$22,349
3
$20,473
35
$52,423
APPLICATIONS WITHDRAWN
1
$41,800
5
$112,766
24
$92,728
0
$0
0
$0
7
$79,207
FILES CLOSED FOR INCOMPLETENESS
0
$0
3
$284,333
4
$74,210
0
$0
0
$0
1
$51,180
Aggregated Statistics For Year 2003 (Based on 2 partial tracts)
A) FHA, FSA/RHS & VA Home Purchase Loans
B) Conventional Home Purchase Loans
C) Refinancings
D) Home Improvement Loans
F) Non-occupant Loans on < 5 Family Dwellings (A B C & D)
Number
Average Value
Number
Average Value
Number
Average Value
Number
Average Value
Number
Average Value
LOANS ORIGINATED
2
$65,255
55
$89,844
96
$102,271
7
$14,501
13
$61,875
APPLICATIONS APPROVED, NOT ACCEPTED
1
$48,620
12
$62,056
19
$81,394
3
$37,247
0
$0
APPLICATIONS DENIED
0
$0
38
$36,499
73
$71,302
6
$26,727
2
$41,795
APPLICATIONS WITHDRAWN
1
$68,240
8
$73,465
27
$87,796
1
$5,120
2
$38,385
FILES CLOSED FOR INCOMPLETENESS
0
$0
2
$34,120
7
$85,666
0
$0
0
$0
Aggregated Statistics For Year 2002 (Based on 2 partial tracts)
A) FHA, FSA/RHS & VA Home Purchase Loans
B) Conventional Home Purchase Loans
C) Refinancings
D) Home Improvement Loans
F) Non-occupant Loans on < 5 Family Dwellings (A B C & D)
Number
Average Value
Number
Average Value
Number
Average Value
Number
Average Value
Number
Average Value
LOANS ORIGINATED
5
$87,176
39
$86,350
90
$96,664
2
$2,130
4
$56,938
APPLICATIONS APPROVED, NOT ACCEPTED
1
$73,360
20
$68,198
19
$79,823
1
$10,240
1
$65,680
APPLICATIONS DENIED
0
$0
34
$53,388
55
$70,535
1
$13,650
3
$60,280
APPLICATIONS WITHDRAWN
0
$0
3
$164,343
33
$94,554
3
$23,600
0
$0
FILES CLOSED FOR INCOMPLETENESS
0
$0
0
$0
9
$92,692
0
$0
0
$0
Aggregated Statistics For Year 2001 (Based on 2 partial tracts)
A) FHA, FSA/RHS & VA Home Purchase Loans
B) Conventional Home Purchase Loans
C) Refinancings
D) Home Improvement Loans
F) Non-occupant Loans on < 5 Family Dwellings (A B C & D)
Number
Average Value
Number
Average Value
Number
Average Value
Number
Average Value
Number
Average Value
LOANS ORIGINATED
1
$67,390
43
$67,466
61
$78,546
7
$13,283
4
$33,055
APPLICATIONS APPROVED, NOT ACCEPTED
1
$64,830
18
$38,480
9
$57,340
2
$8,530
1
$25,590
APPLICATIONS DENIED
0
$0
72
$45,541
70
$62,172
9
$12,890
2
$7,675
APPLICATIONS WITHDRAWN
0
$0
3
$45,493
24
$63,300
3
$10,520
0
$0
FILES CLOSED FOR INCOMPLETENESS
0
$0
0
$0
3
$52,033
0
$0
0
$0
Aggregated Statistics For Year 2000 (Based on 2 partial tracts)
A) FHA, FSA/RHS & VA Home Purchase Loans
B) Conventional Home Purchase Loans
C) Refinancings
D) Home Improvement Loans
F) Non-occupant Loans on < 5 Family Dwellings (A B C & D)
Number
Average Value
Number
Average Value
Number
Average Value
Number
Average Value
Number
Average Value
LOANS ORIGINATED
2
$49,475
63
$63,027
38
$65,659
5
$8,360
2
$27,295
APPLICATIONS APPROVED, NOT ACCEPTED
3
$30,140
21
$39,197
13
$59,251
3
$6,540
1
$27,300
APPLICATIONS DENIED
4
$52,245
117
$78,702
57
$59,411
13
$22,375
3
$62,553
APPLICATIONS WITHDRAWN
1
$62,270
7
$68,606
23
$69,760
2
$30,710
1
$29,860
FILES CLOSED FOR INCOMPLETENESS
0
$0
0
$0
6
$59,852
0
$0
0
$0
Aggregated Statistics For Year 1999 (Based on 1 partial tract)
A) FHA, FSA/RHS & VA Home Purchase Loans
B) Conventional Home Purchase Loans
C) Refinancings
D) Home Improvement Loans
F) Non-occupant Loans on < 5 Family Dwellings (A B C & D)
Detailed PMIC statistics for the following Tracts:0219.00
2005 - 2018 National Fire Incident Reporting System (NFIRS) incidents
According to the data from the years 2005 - 2018 the average number of fire incidents per year is 30. The highest number of fire incidents - 49 took place in 2011, and the least - 11 in 2013. The data has a growing trend.
When looking into fire subcategories, the most incidents belonged to: Outside Fires (61.8%), and Structure Fires (32.0%).
Fire incident types reported to NFIRS in Zip Code 29856

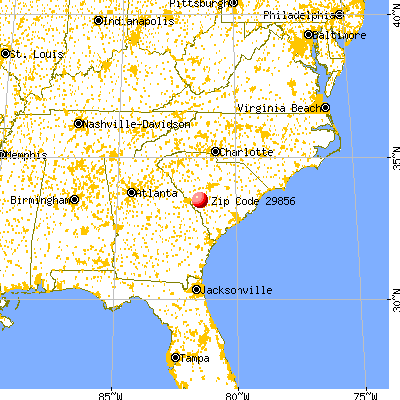


 Nearest zip codes: 29853, 29826, 29805, 29809, 29164, 29801.


 According to the data from the years 2005 - 2018 the average number of fire incidents per year is 30. The highest number of fire incidents - 49 took place in 2011, and the least - 11 in 2013. The data has a growing trend.
 When looking into fire subcategories, the most incidents belonged to: Outside Fires (61.8%), and Structure Fires (32.0%).