Estimated zip code population in 2022: 1,515 Zip code population in 2010: 1,725 Zip code population in 2000: 1,754
Houses and condos: 700 Renter-occupied apartments: 203
% of renters here:
34%
State:
28%
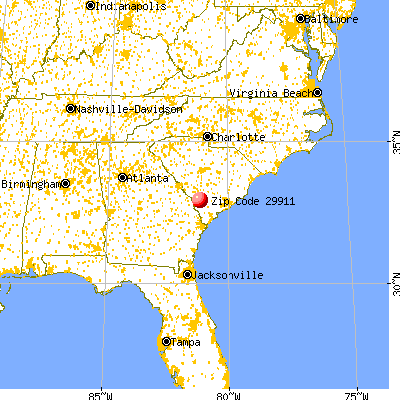
March 2022 cost of living index in zip code 29911: 80.9 (low, U.S. average is 100)
Land area: 75.1 sq. mi. Water area: 0.3 sq. mi.
Population density: 20 people per square mile
(very low).
OSM Map
General Map
Google Map
MSN Map
OSM Map
General Map
Google Map
MSN Map
OSM Map
General Map
Google Map
MSN Map
OSM Map
General Map
Google Map
MSN Map
Please wait while loading the map...
Real estate property taxes paid for housing units in 2022:
This zip code:
0.5% ($600)
South Carolina:
0.5% ($1,185)
Median real estate property taxes paid for housing units with mortgages in 2022: $1,017 (0.5%) Median real estate property taxes paid for housing units with no mortgage in 2022: $529 (0.5%)
Business Search- 14 Million verified businesses
Males: 736
(48.6%)
Females: 778
(51.4%)
For population 25 years and over in 29911:
High school or higher: 82.9%
Bachelor's degree or higher: 12.0%
Graduate or professional degree: 2.8%
Unemployed: 10.5%
Mean travel time to work (commute): 35.5 minutes
For population 15 years and over in 29911:
Never married: 42.3%
Now married: 40.4%
Separated: 1.8%
Widowed: 5.5%
Divorced: 10.0%
Zip code 29911 compared to state average:
Median household income below state average.
Median house value below state average.
Unemployed percentage above state average.
Median age above state average.
Foreign-born population percentage significantly below state average.
Length of stay since moving in significantly above state average.
Number of college students below state average.
Percentage of population with a bachelor's degree or higher significantly below state average.
Estimated median house/condo value in 2022: $115,524
29911:
$115,524
South Carolina:
$254,600
Median resident age:
This zip code:
47.3 years
South Carolina median age:
40.5 years
Average household size:
This zip code:
2.5 people
South Carolina:
2.4 people
Averages for the 2020 tax year for zip code 29911, filed in 2021:
Average Adjusted Gross Income (AGI) in 2020: $40,718 (Individual Income Tax Returns)
Here:
$40,718
State:
$65,754
Salary/wage: $34,740 (reported on 83.3% of returns)
Here:
$34,740
State:
$52,566
(% of AGI for various income ranges: 1194.5% for AGIs below $25k, 3860.0% for AGIs $25k-50k, 7410.0% for AGIs $50k-75k, 10203.3% for AGIs $75k-100k, 21545.0% for AGIs $100k-200k)
Taxable interest for individuals: $280 (reported on 15.2% of returns)
This zip code:
$280
South Carolina:
$1,749
(% of AGI for various income ranges: 1.8% for AGIs below $25k, 5.7% for AGIs $25k-50k, 12.0% for AGIs $50k-75k, 50.0% for AGIs $100k-200k)
Ordinary dividends: $4,050 (reported on 6.1% of returns)
Here:
$4,050
State:
$8,783
(% of AGI for various income ranges: 5.5% for AGIs below $25k, 300.0% for AGIs $50k-75k)
Net capital gain/loss in AGI: +$4,067 (reported on 4.5% of returns)
Here:
+$4,067
State:
+$24,194
(% of AGI for various income ranges: 55.5% for AGIs below $25k)
Profit/loss from business: +$2,440 (reported on 15.2% of returns)
Here:
+$2,440
State:
+$11,253
(% of AGI for various income ranges: 100.9% for AGIs below $25k, 44.0% for AGIs $50k-75k)
Taxable individual retirement arrangement distribution: $8,167 (reported on 9.1% of returns)
29911:
$8,167
South Carolina:
$21,604
(% of AGI for various income ranges: 126.4% for AGIs below $25k, 424.0% for AGIs $50k-75k)
Total itemized deductions: $23,950 (reported on 3.0% of returns)
Here:
$23,950
State:
$35,199
(% of AGI for various income ranges: 342.1% for AGIs $25k-50k)
Taxes paid: $5,650 (reported on 3.0% of returns)
29911:
$5,650
State:
$7,486
(% of AGI for various income ranges: 80.7% for AGIs $25k-50k)
Earned income credit: $2,525 (reported on 30.3% of returns)
Here:
$2,525
State:
$2,397
(% of AGI for various income ranges: 156.4% for AGIs below $25k, 115.0% for AGIs $25k-50k)
Percentage of individuals using paid preparers for their 2020 taxes: 90.9%
Here:
91%
State:
93%
(% for various income ranges: 93.1% for AGIs below $25k, 94.4% for AGIs $25k-50k, 88.9% for AGIs $50k-75k, 80.0% for AGIs $75k-100k, 80.0% for AGIs $100k-200k)
Averages for the 2012 tax year for zip code 29911, filed in 2013:
Average Adjusted Gross Income (AGI) in 2012: $40,192 (Individual Income Tax Returns)
Here:
$40,192
State:
$51,133
Salary/wage: $33,317 (reported on 87.1% of returns)
Here:
$33,317
State:
$42,173
(% of AGI for various income ranges: 77.8% for AGIs below $25k, 81.7% for AGIs $25k-50k, 83.2% for AGIs $50k-75k, 72.9% for AGIs $75k-100k, 48.5% for AGIs $100k-200k)
Taxable interest for individuals: $742 (reported on 19.4% of returns)
This zip code:
$742
South Carolina:
$1,468
(% of AGI for various income ranges: 0.4% for AGIs below $25k, 0.7% for AGIs $25k-50k, 0.7% for AGIs $75k-100k)
Ordinary dividends: $4,280 (reported on 8.1% of returns)
Here:
$4,280
State:
$6,511
Net capital gain/loss in AGI: +$4,667 (reported on 4.8% of returns)
Here:
+$4,667
State:
+$13,061
Profit/loss from business: +$4,478 (reported on 14.5% of returns)
Here:
+$4,478
State:
+$10,167
(% of AGI for various income ranges: 6.6% for AGIs below $25k, 1.6% for AGIs $25k-50k, 1.2% for AGIs $50k-75k)
Taxable individual retirement arrangement distribution: $6,725 (reported on 6.5% of returns)
29911:
$6,725
South Carolina:
$17,019
Total itemized deductions: $22,230 (24% of AGI, reported on 16.1% of returns)
Here:
$22,230
State:
$22,890
Here:
24.4% of AGI
State:
21.4% of AGI
(% of AGI for various income ranges: 7.3% for AGIs $25k-50k, 8.1% for AGIs $50k-75k, 11.7% for AGIs $75k-100k, 15.0% for AGIs $100k-200k)
Charity contributions: $9,138 (reported on 12.9% of returns)
Here:
$9,138
State:
$5,169
(% of AGI for various income ranges: 1.4% for AGIs $25k-50k, 2.7% for AGIs $50k-75k, 8.9% for AGIs $100k-200k)
Taxes paid: $6,390 (reported on 16.1% of returns)
29911:
$6,390
State:
$7,644
(% of AGI for various income ranges: 1.3% for AGIs $25k-50k, 2.2% for AGIs $50k-75k, 3.8% for AGIs $75k-100k, 4.9% for AGIs $100k-200k)
Earned income credit: $2,419 (reported on 33.9% of returns)
Here:
$2,419
State:
$2,418
(% of AGI for various income ranges: 10.6% for AGIs below $25k, 1.9% for AGIs $25k-50k)
Percentage of individuals using paid preparers for their 2012 taxes: 72.6%
Here:
73%
State:
57%
(% for various income ranges: 72.4% for AGIs below $25k, 70.6% for AGIs $25k-50k, 75.0% for AGIs $50k-75k, 60.0% for AGIs $75k-100k, 100.0% for AGIs $100k-200k)
Averages for the 2004 tax year for zip code 29911, filed in 2005:
Average Adjusted Gross Income (AGI) in 2004: $32,012 (Individual Income Tax Returns)
Here:
$32,012
State:
$41,965
Salary/wage: $29,836 (reported on 88.5% of returns)
Here:
$29,836
State:
$35,695
(% of AGI for various income ranges: 96.7% for AGIs below $10k, 83.8% for AGIs $10k-25k, 89.0% for AGIs $25k-50k, 89.7% for AGIs $50k-75k, 82.0% for AGIs $75k-100k, 51.7% for AGIs over 100k)
Taxable interest for individuals: $978 (reported on 26.8% of returns)
This zip code:
$978
South Carolina:
$1,623
(% of AGI for various income ranges: 1.6% for AGIs below $10k, 0.5% for AGIs $10k-25k, 0.9% for AGIs $25k-50k, 0.2% for AGIs $50k-75k, 0.3% for AGIs $75k-100k, 2.5% for AGIs over 100k)
Taxable dividends: $3,123 (reported on 9.7% of returns)
Here:
$3,123
State:
$3,999
(% of AGI for various income ranges: 0.1% for AGIs $10k-25k, 0.4% for AGIs $25k-50k, 0.1% for AGIs $50k-75k, 5.9% for AGIs over 100k)
Net capital gain/loss: +$6,385 (reported on 5.8% of returns)
Here:
+$6,385
State:
+$13,100
Profit/loss from business: +$2,294 (reported on 12.7% of returns)
Here:
+$2,294
State:
+$9,144
(% of AGI for various income ranges: 5.9% for AGIs below $10k, 2.2% for AGIs $10k-25k, 1.4% for AGIs $25k-50k, -0.3% for AGIs $75k-100k)
IRA payment deduction: $2,000 (reported on 1.8% of returns)
29911:
$2,000
South Carolina:
$2,972
Total itemized deductions: $15,778 (24% of AGI, reported on 20.2% of returns)
Here:
$15,778
State:
$19,039
Here:
24.1% of AGI
State:
22.8% of AGI
(% of AGI for various income ranges: 6.1% for AGIs $10k-25k, 9.5% for AGIs $25k-50k, 10.5% for AGIs $50k-75k, 14.0% for AGIs $75k-100k, 12.7% for AGIs over 100k)
Charity contributions deductions: $3,192 (5% of AGI, reported on 18.0% of returns)
Here:
$3,192
State:
$4,305
Here:
4.7% of AGI
State:
5.0% of AGI
(% of AGI for various income ranges: 0.8% for AGIs $10k-25k, 1.1% for AGIs $25k-50k, 2.4% for AGIs $50k-75k, 2.2% for AGIs $75k-100k, 3.4% for AGIs over 100k)
Total tax: $3,933 (reported on 62.2% of returns)
29911:
$3,933
State:
$6,497
(% of AGI for various income ranges: 1.9% for AGIs below $10k, 2.6% for AGIs $10k-25k, 5.0% for AGIs $25k-50k, 8.1% for AGIs $50k-75k, 10.8% for AGIs $75k-100k, 16.3% for AGIs over 100k)
Earned income credit: $1,878 (reported on 33.1% of returns)
Here:
$1,878
State:
$1,882
Percentage of individuals using paid preparers for their 2004 taxes: 73.3%
Here:
73%
State:
66%
(% for various income ranges: 68.2% for AGIs below $10k, 77.2% for AGIs $10k-25k, 71.1% for AGIs $25k-50k, 72.3% for AGIs $50k-75k, 76.3% for AGIs $75k-100k, 90.0% for AGIs over 100k)
Household received Food Stamps/SNAP in the past 12 months: 122 Household did not receive Food Stamps/SNAP in the past 12 months: 477
Women who had a birth in the past 12 months: 8 (0 now married, 7 unmarried) Women who did not have a birth in the past 12 months: 319 (65 now married, 251 unmarried)
Housing units in zip code 29911 with a mortgage: 159 (22 second mortgage, 5 both second mortgage and home equity loan) Median monthly owner costs for units with a mortgage: $1,072 Median monthly owner costs for units without a mortgage: $348
Residents with income below the poverty level in 2022:
This zip code:
10.5%
Whole state:
14.0%
Residents with income below 50% of the poverty level in 2022:
This zip code:
7.1%
Whole state:
7.3%
Median number of rooms in houses and condos:
Here:
6.4
State:
6.4
Median number of rooms in apartments:
Here:
5.1
State:
4.5
Notable locations in this zip code not listed on our city pages
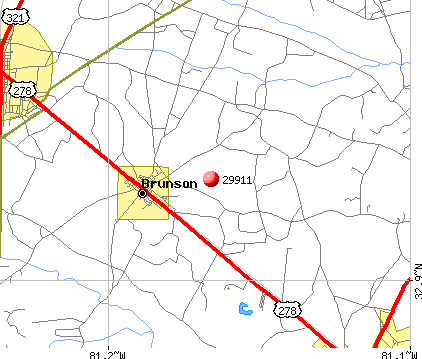
Notable locations in zip code 29911: Jenny and Platts Sawmill (A), Harrison Sawmill (B), Brunson Town Hall (C), Brunson Fire Department Station 10 (D). Display/hide their locations on the map
Churches in zip code 29911 include: Shady Grove Church (A), Browning Church (B), Enon Church (C), Second Baptist Church (D), Mount Carmel Holiness Church (E), Brunson Baptist Church (F), Macedonia Church (G), Jackson Branch Church (H), Harmony Church (I). Display/hide their locations on the map
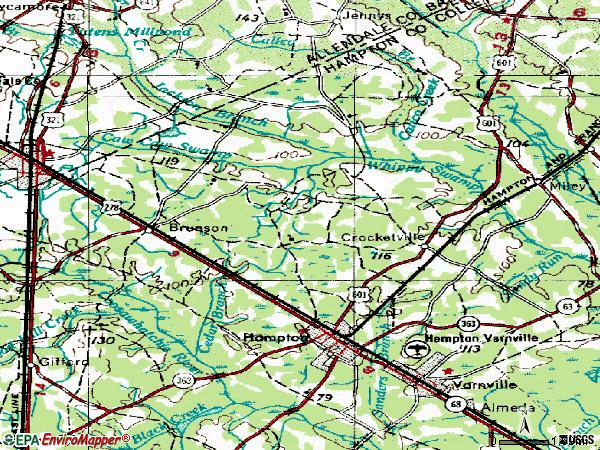
Streams, rivers, and creeks: Hog Branch (A), Calico Branch (B), Caw Caw Swamp (C), Jackson Branch (D), Blood Hill Creek (E). Display/hide their locations on the map
In group quarters: 10 (-1 institutionalized population)
Size of family households: 193 2-persons, 62 3-persons, 83 4-persons, 46 5-persons
Size of nonfamily households: 190 1-person, 19 2-persons
129 married couples with children.
101 single-parent households (101 women).
97.9% of residents of 29911 zip code speak English at home.
2.0% of residents speak Spanish at home (100% very well).
0.3% of residents speak other Indo-European language at home (100% very well).
Foreign born population: 11 (0.8%) (75.6% of them are naturalized citizens)
This zip code:
0.8%
Whole state:
5.2%
100%France
17%American
7%Irish
3%European
3%German
2%English
2%French
2%African
Year of entry for the foreign-born population
02010 or later
12000 to 2009
01990 to 1999
15Before 1990
Facilities with environmental interests located in this zip code:
BRUNSON TOWN OF (1991 DEER DRIVE in BRUNSON, SC)
CRITERIA AND HAZARDOUS AIR POLLUTANT INVENTORY (Inventory of air pollution sources) National Pollutant Discharge Elimination System NON-MAJOR (Tracking pollutant discharge elimination systems) - permit STATE MASTER (South Carolina database) - National Pollutant Discharge Elimination System Permit, LABORATORY CERTIFICATION, DRINKING WATER SYSTEM COMMUNITY WATER SYSTEM (SDWIS) - SDWIS-SC2510004 101T, WATER TREATMENT PLANT Business SIC classification: SEWERAGE SYSTEMS Organizations: BRUNSON, TOWN OF (CONTACT/OWNER)
Alternative names: TOWN OF BRUNSON
BRUNSON ELEMENTARY SCHOOL (34 COLLEGE STREET in BRUNSON, SC)
(National Center for Education Statistics) - STATE ID-2501004 STATE MASTER (South Carolina database) - DRINKING WATER PROGRAM Organizations: HAMPTON COUNTY SCHOOL DISTRICT 01 (SCHOOL DISTRICT)
BOWERS AUTO INC (HWY 278 in BRUNSON, SC)
(Resource Conservation and Recovery Act (tracking hazardous waste)) STATE MASTER (South Carolina database) - HAZARDOUS WASTE PROGRAM Organizations: OPERNAME (CONTACT/OPERATOR)
, BOWERS WILLIAM L (CONTACT/OWNER)
BRUNSON LAUNDRY (3 MAIN STREET in BRUNSON, SC)
AIR MINOR (AIRS/AFS) STATE MASTER (South Carolina database) - National Pollutant Discharge Elimination System Permit, AIR PROGRAM Business SIC classification: SCRAP AND WASTE MATERIALS; POWER LAUNDRIES, FAMILY AND COMMERCIAL Alternative names: BRUNSON LAUNDRY & RENTAL
Housing units lacking complete plumbing facilities: 2.1% Housing units lacking complete kitchen facilities: 5.1%
83.8%Electricity
10.5%Utility gas
4.8%Bottled, tank, or LP gas
0.7%Wood
0.5%Fuel oil, kerosene, etc.
Population in 1990: 1,422. Population change in the 1990s: +332 (+23.3%).
Place of birth for U.S.-born residents:
This state: 1,251
Northeast: 53
Midwest: 3
South: 159
78% of the 29911 zip code residents lived in the same house 5 years ago. Out of people who lived in different houses, 55% lived in this county. Out of people who lived in different counties, 50% lived in South Carolina.
93% of the 29911 zip code residents lived in the same house 1 year ago. Out of people who lived in different houses, 55% moved from this county. Out of people who lived in different houses, 23% moved from different county within same state. Out of people who lived in different houses, 15% moved from different state.
Private vs. public school enrollment:
Students in private schools in grades 1 to 8 (elementary and middle school): 32
Here:
33.9%
South Carolina:
14.4%
Students in private schools in grades 9 to 12 (high school): 52
Here:
45.9%
South Carolina:
11.1%
Students in private undergraduate colleges:
Here:
0.0%
South Carolina:
21.9%
Occupation by median earnings in the past 12 months ($)
93,747Sales and related occupations
67,083Farming, fishing, and forestry occupations
60,078Installation, maintenance, and repair occupations
58,533Construction and extraction occupations
46,226Management occupations
39,060Transportation occupations
Top industries in this zip code by the number of employees in 2005:
Other Services (except Public Administration): Drycleaning and Laundry Services (except Coin-Operated) (20-49 employees: 1 establishment)
Other Services (except Public Administration): Religious Organizations (1-4: 2)
Other Services (except Public Administration): General Automotive Repair (1-4: 1)
Construction: Other Foundation, Structure, and Building Exterior Contractors (1-4: 1)
Other Services (except Public Administration): Automotive Body, Paint, and Interior Repair and Maintenance (1-4: 1)
Construction: Plumbing, Heating, and Air-Conditioning Contractors (1-4: 1)
Wholesale Trade: Other Grocery and Related Products Merchant Wholesalers (1-4: 1)
2003 - 2018 National Fire Incident Reporting System (NFIRS) incidents
Based on the data from the years 2003 - 2018 the average number of fire incidents per year is 9. The highest number of reported fires - 20 took place in 2011, and the least - 0 in 2008. The data has an increasing trend.
When looking into fire subcategories, the most reports belonged to: Outside Fires (55.4%), and Structure Fires (33.8%).
Fire incident types reported to NFIRS in Zip Code 29911


 Nearest zip codes: 29924, 29827, 29923, 29081, 29944, 29849.


 Based on the data from the years 2003 - 2018 the average number of fire incidents per year is 9. The highest number of reported fires - 20 took place in 2011, and the least - 0 in 2008. The data has an increasing trend.
 When looking into fire subcategories, the most reports belonged to: Outside Fires (55.4%), and Structure Fires (33.8%).