Estimated zip code population in 2022: 3,614 Zip code population in 2010: 3,018 Zip code population in 2000: 2,201
Houses and condos: 1,635 Renter-occupied apartments: 131
% of renters here:
9%
State:
34%
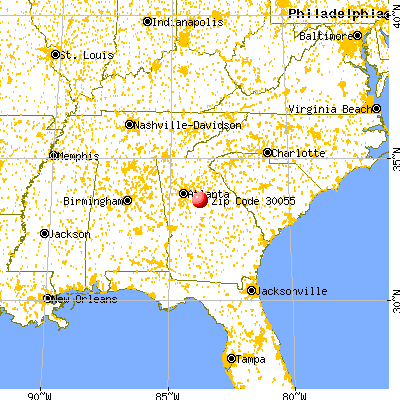
March 2022 cost of living index in zip code 30055: 89.9 (less than average, U.S. average is 100)
Land area: 51.3 sq. mi. Water area: 1.1 sq. mi.
Population density: 70 people per square mile
(very low).
OSM Map
General Map
Google Map
MSN Map
OSM Map
General Map
Google Map
MSN Map
OSM Map
General Map
Google Map
MSN Map
OSM Map
General Map
Google Map
MSN Map
Please wait while loading the map...
Real estate property taxes paid for housing units in 2022:
This zip code:
0.7% ($2,415)
Georgia:
0.7% ($2,160)
Median real estate property taxes paid for housing units with mortgages in 2022: $2,245 (0.7%) Median real estate property taxes paid for housing units with no mortgage in 2022: $2,638 (0.7%)
Business Search- 14 Million verified businesses
Males: 1,950
(54.0%)
Females: 1,663
(46.0%)
For population 25 years and over in 30055:
High school or higher: 85.6%
Bachelor's degree or higher: 19.4%
Graduate or professional degree: 4.0%
Unemployed: 5.2%
Mean travel time to work (commute): 36.1 minutes
For population 15 years and over in 30055:
Never married: 16.9%
Now married: 64.8%
Separated: 1.8%
Widowed: 6.0%
Divorced: 10.5%
Zip code 30055 compared to state average:
Black race population percentage significantly below state average.
Median age above state average.
Foreign-born population percentage significantly below state average.
Renting percentage significantly below state average.
Length of stay since moving in above state average.
Number of college students below state average.
Percentage of population with a bachelor's degree or higher below state average.
Estimated median house/condo value in 2022: $335,860
30055:
$335,860
Georgia:
$297,400
According to our research of Georgia and other state lists, there were 8 registered sex offenders living in 30055 zip code as of May 28, 2024. The ratio of all residents to sex offenders in zip code 30055 is 352 to 1. The ratio of registered sex offenders to all residents in this zip code is near the state average.
Median resident age:
This zip code:
43.1 years
Georgia median age:
37.6 years
Average household size:
This zip code:
2.5 people
Georgia:
2.6 people
Averages for the 2020 tax year for zip code 30055, filed in 2021:
Average Adjusted Gross Income (AGI) in 2020: $71,350 (Individual Income Tax Returns)
Here:
$71,350
State:
$70,847
Salary/wage: $62,334 (reported on 79.8% of returns)
Here:
$62,334
State:
$59,126
(% of AGI for various income ranges: 1091.1% for AGIs below $25k, 3619.6% for AGIs $25k-50k, 6404.4% for AGIs $50k-75k, 10106.9% for AGIs $75k-100k, 17794.1% for AGIs $100k-200k, 62625.0% for AGIs over 200k)
Taxable interest for individuals: $2,300 (reported on 26.4% of returns)
This zip code:
$2,300
Georgia:
$2,011
(% of AGI for various income ranges: 6.6% for AGIs below $25k, 39.3% for AGIs $25k-50k, 33.9% for AGIs $50k-75k, 76.2% for AGIs $75k-100k, 126.5% for AGIs $100k-200k, 2425.0% for AGIs over 200k)
Ordinary dividends: $4,970 (reported on 14.1% of returns)
Here:
$4,970
State:
$8,996
(% of AGI for various income ranges: 8.0% for AGIs below $25k, 10.0% for AGIs $25k-50k, 87.8% for AGIs $50k-75k, 138.5% for AGIs $75k-100k, 181.8% for AGIs $100k-200k, 2205.0% for AGIs over 200k)
Net capital gain/loss in AGI: +$13,635 (reported on 14.1% of returns)
Here:
+$13,635
State:
+$28,402
(% of AGI for various income ranges: 8.3% for AGIs below $25k, 20.7% for AGIs $25k-50k, 70.0% for AGIs $50k-75k, 145.4% for AGIs $75k-100k, 388.2% for AGIs $100k-200k, 10380.0% for AGIs over 200k)
Profit/loss from business: +$4,676 (reported on 22.7% of returns)
Here:
+$4,676
State:
+$6,707
(% of AGI for various income ranges: 146.9% for AGIs below $25k, 137.0% for AGIs $25k-50k, 38.9% for AGIs $50k-75k, 58.5% for AGIs $75k-100k, 411.8% for AGIs $100k-200k)
Taxable individual retirement arrangement distribution: $17,154 (reported on 8.0% of returns)
30055:
$17,154
Georgia:
$20,525
(% of AGI for various income ranges: 57.1% for AGIs below $25k, 165.6% for AGIs $25k-50k, 170.6% for AGIs $50k-75k, 321.5% for AGIs $75k-100k, 504.7% for AGIs $100k-200k)
Total itemized deductions: $27,443 (reported on 12.9% of returns)
Here:
$27,443
State:
$34,001
(% of AGI for various income ranges: 160.9% for AGIs below $25k, 415.0% for AGIs $50k-75k, 541.5% for AGIs $75k-100k, 1472.4% for AGIs $100k-200k, 6230.0% for AGIs over 200k)
Charity contributions: $8,521 (reported on 11.7% of returns)
Here:
$8,521
State:
$14,164
(% of AGI for various income ranges: 34.6% for AGIs below $25k, 97.2% for AGIs $50k-75k, 123.8% for AGIs $75k-100k, 388.8% for AGIs $100k-200k, 2505.0% for AGIs over 200k)
Taxes paid: $7,955 (reported on 12.3% of returns)
30055:
$7,955
State:
$7,540
(% of AGI for various income ranges: 24.0% for AGIs below $25k, 106.7% for AGIs $50k-75k, 160.0% for AGIs $75k-100k, 466.5% for AGIs $100k-200k, 1570.0% for AGIs over 200k)
Earned income credit: $2,246 (reported on 17.2% of returns)
Here:
$2,246
State:
$2,530
(% of AGI for various income ranges: 107.4% for AGIs below $25k, 93.7% for AGIs $25k-50k)
Percentage of individuals using paid preparers for their 2020 taxes: 94.5%
Here:
94%
State:
93%
(% for various income ranges: 93.6% for AGIs below $25k, 94.3% for AGIs $25k-50k, 92.0% for AGIs $50k-75k, 95.0% for AGIs $75k-100k, 96.6% for AGIs $100k-200k, 100.0% for AGIs over 200k)
Averages for the 2012 tax year for zip code 30055, filed in 2013:
Average Adjusted Gross Income (AGI) in 2012: $51,060 (Individual Income Tax Returns)
Here:
$51,060
State:
$56,131
Salary/wage: $44,787 (reported on 81.6% of returns)
Here:
$44,787
State:
$47,942
(% of AGI for various income ranges: 69.2% for AGIs below $25k, 75.3% for AGIs $25k-50k, 76.5% for AGIs $50k-75k, 79.1% for AGIs $75k-100k, 64.5% for AGIs $100k-200k)
Taxable interest for individuals: $1,525 (reported on 29.4% of returns)
This zip code:
$1,525
Georgia:
$1,706
(% of AGI for various income ranges: 1.5% for AGIs below $25k, 0.5% for AGIs $25k-50k, 1.2% for AGIs $50k-75k, 0.4% for AGIs $75k-100k, 1.0% for AGIs $100k-200k)
Ordinary dividends: $3,910 (reported on 14.7% of returns)
Here:
$3,910
State:
$7,265
(% of AGI for various income ranges: 1.2% for AGIs below $25k, 0.5% for AGIs $25k-50k, 1.1% for AGIs $50k-75k, 0.4% for AGIs $75k-100k, 1.7% for AGIs $100k-200k)
Net capital gain/loss in AGI: +$2,435 (reported on 12.5% of returns)
Here:
+$2,435
State:
+$16,323
(% of AGI for various income ranges: 0.9% for AGIs $50k-75k, 1.0% for AGIs $75k-100k, 0.8% for AGIs $100k-200k)
Profit/loss from business: +$4,881 (reported on 19.1% of returns)
Here:
+$4,881
State:
+$7,583
(% of AGI for various income ranges: 11.6% for AGIs below $25k, 4.2% for AGIs $25k-50k, 0.2% for AGIs $100k-200k)
Taxable individual retirement arrangement distribution: $15,362 (reported on 11.8% of returns)
30055:
$15,362
Georgia:
$17,199
(% of AGI for various income ranges: 5.8% for AGIs below $25k, 2.0% for AGIs $25k-50k, 4.9% for AGIs $50k-75k, 4.6% for AGIs $100k-200k)
Total itemized deductions: $20,698 (26% of AGI, reported on 44.9% of returns)
Here:
$20,698
State:
$23,886
Here:
25.9% of AGI
State:
21.5% of AGI
(% of AGI for various income ranges: 17.6% for AGIs below $25k, 18.9% for AGIs $25k-50k, 20.4% for AGIs $50k-75k, 17.4% for AGIs $75k-100k, 17.2% for AGIs $100k-200k)
Charity contributions: $4,102 (reported on 38.2% of returns)
Here:
$4,102
State:
$5,507
(% of AGI for various income ranges: 1.4% for AGIs below $25k, 3.1% for AGIs $25k-50k, 3.5% for AGIs $50k-75k, 2.4% for AGIs $75k-100k, 3.6% for AGIs $100k-200k)
Taxes paid: $6,023 (reported on 44.9% of returns)
30055:
$6,023
State:
$7,838
(% of AGI for various income ranges: 3.4% for AGIs below $25k, 4.1% for AGIs $25k-50k, 5.3% for AGIs $50k-75k, 5.5% for AGIs $75k-100k, 6.2% for AGIs $100k-200k)
Earned income credit: $2,437 (reported on 19.9% of returns)
Here:
$2,437
State:
$2,589
(% of AGI for various income ranges: 7.9% for AGIs below $25k, 1.2% for AGIs $25k-50k)
Percentage of individuals using paid preparers for their 2012 taxes: 57.4%
Here:
57%
State:
55%
(% for various income ranges: 52.8% for AGIs below $25k, 59.4% for AGIs $25k-50k, 66.7% for AGIs $50k-75k, 57.1% for AGIs $75k-100k, 56.2% for AGIs $100k-200k)
Averages for the 2004 tax year for zip code 30055, filed in 2005:
Average Adjusted Gross Income (AGI) in 2004: $46,340 (Individual Income Tax Returns)
Here:
$46,340
State:
$47,553
Salary/wage: $42,734 (reported on 84.9% of returns)
Here:
$42,734
State:
$42,178
(% of AGI for various income ranges: 166.4% for AGIs below $10k, 75.9% for AGIs $10k-25k, 80.9% for AGIs $25k-50k, 81.0% for AGIs $50k-75k, 80.2% for AGIs $75k-100k, 70.0% for AGIs over 100k)
Taxable interest for individuals: $1,666 (reported on 39.5% of returns)
This zip code:
$1,666
Georgia:
$1,772
(% of AGI for various income ranges: 5.4% for AGIs below $10k, 4.8% for AGIs $10k-25k, 2.0% for AGIs $25k-50k, 1.1% for AGIs $50k-75k, 0.5% for AGIs $75k-100k, 0.9% for AGIs over 100k)
Taxable dividends: $1,435 (reported on 17.9% of returns)
Here:
$1,435
State:
$4,283
(% of AGI for various income ranges: 1.4% for AGIs below $10k, 1.1% for AGIs $10k-25k, 0.5% for AGIs $25k-50k, 0.5% for AGIs $50k-75k, 0.6% for AGIs $75k-100k, 0.4% for AGIs over 100k)
Net capital gain/loss: +$12,467 (reported on 15.2% of returns)
Here:
+$12,467
State:
+$16,461
(% of AGI for various income ranges: 16.5% for AGIs below $10k, 1.9% for AGIs $10k-25k, 0.4% for AGIs $25k-50k, 0.6% for AGIs $50k-75k, 3.8% for AGIs $75k-100k, 8.9% for AGIs over 100k)
Profit/loss from business: +$7,817 (reported on 19.6% of returns)
Here:
+$7,817
State:
+$8,201
(% of AGI for various income ranges: 15.9% for AGIs below $10k, 9.6% for AGIs $10k-25k, 5.6% for AGIs $25k-50k, 0.8% for AGIs $50k-75k, 0.8% for AGIs $75k-100k, 3.1% for AGIs over 100k)
IRA payment deduction: $2,958 (reported on 2.2% of returns)
30055:
$2,958
Georgia:
$2,969
Total itemized deductions: $18,321 (25% of AGI, reported on 45.8% of returns)
Here:
$18,321
State:
$19,944
Here:
24.7% of AGI
State:
22.6% of AGI
(% of AGI for various income ranges: 22.2% for AGIs below $10k, 15.7% for AGIs $10k-25k, 19.5% for AGIs $25k-50k, 20.1% for AGIs $50k-75k, 19.5% for AGIs $75k-100k, 15.4% for AGIs over 100k)
Charity contributions deductions: $3,463 (4% of AGI, reported on 39.9% of returns)
Here:
$3,463
State:
$4,354
Here:
4.4% of AGI
State:
4.7% of AGI
(% of AGI for various income ranges: 1.5% for AGIs below $10k, 1.5% for AGIs $10k-25k, 2.4% for AGIs $25k-50k, 3.0% for AGIs $50k-75k, 3.3% for AGIs $75k-100k, 3.6% for AGIs over 100k)
Total tax: $6,547 (reported on 75.1% of returns)
30055:
$6,547
State:
$8,223
(% of AGI for various income ranges: 5.3% for AGIs below $10k, 3.9% for AGIs $10k-25k, 5.7% for AGIs $25k-50k, 8.2% for AGIs $50k-75k, 9.0% for AGIs $75k-100k, 18.2% for AGIs over 100k)
Earned income credit: $1,524 (reported on 19.0% of returns)
Here:
$1,524
State:
$1,986
Percentage of individuals using paid preparers for their 2004 taxes: 61.6%
Here:
62%
State:
62%
(% for various income ranges: 47.7% for AGIs below $10k, 59.7% for AGIs $10k-25k, 67.6% for AGIs $25k-50k, 63.4% for AGIs $50k-75k, 66.7% for AGIs $75k-100k, 71.9% for AGIs over 100k)
Likely homosexual households (counted as self-reported same-sex unmarried-partner households)
Lesbian couples: 0.2% of all households
Gay men: 0.0% of all households
Household received Food Stamps/SNAP in the past 12 months: 161 Household did not receive Food Stamps/SNAP in the past 12 months: 1,297
Women who had a birth in the past 12 months: 5 (4 now married, 1 unmarried) Women who did not have a birth in the past 12 months: 583 (354 now married, 227 unmarried)
Housing units in zip code 30055 with a mortgage: 664 (76 second mortgage, 77 both second mortgage and home equity loan) Houses without a mortgage: 3
Median monthly owner costs for units with a mortgage: $1,427 Median monthly owner costs for units without a mortgage: $472
Residents with income below the poverty level in 2022:
This zip code:
6.2%
Whole state:
12.7%
Residents with income below 50% of the poverty level in 2022:
This zip code:
4.8%
Whole state:
6.3%
Median number of rooms in houses and condos:
Here:
6.4
State:
6.8
Median number of rooms in apartments:
Here:
5.2
State:
4.6
Notable locations in this zip code not listed on our city pages
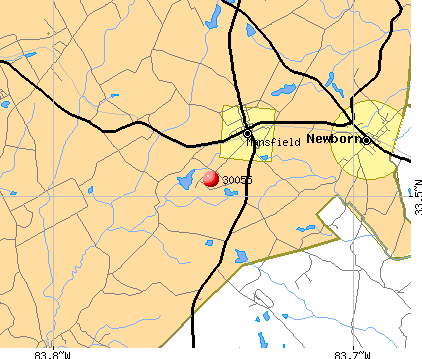
Notable locations in zip code 30055: Franklin Crossroads (A), Pony Express (B), Jasper County Emergency Services Station 6 North Alcovy (C). Display/hide their locations on the map
Churches in zip code 30055 include: Mount Zion Church (A), Pine Grove Church (B), Poplar Grove Church (C), Gaithers Church (D), Rocky Creek Church (E), Rocky Springs Church (F), Sewell Church (G), Shoal Creek Church (H), Mount Carmel Church (I). Display/hide their locations on the map
Cemeteries: Allen Cemetery (1), New Rocky Creek Cemetery (2), Prospect Cemetery (3), Tabernacle Cemetery (4), Cunard Cemetery (5), Perry Family Cemetery (6), Sewell Cemetery (7). Display/hide their locations on the map
Reservoirs: Richardson Lake (A), Hays Pond (B), Sheppard Lake (C), Murder Creek Lake (D), Boyle Lake Number Three (E), Boyle Lake Number One (F), Boyle Lake Number Five (G), Boyle Lake Number Two (H). Display/hide their locations on the map
Size of family households: 431 2-persons, 369 3-persons, 147 4-persons, 106 5-persons, 5 6-persons
Size of nonfamily households: 322 1-person, 57 2-persons, 22 3-persons
608 married couples with children.
97 single-parent households (6 men, 91 women).
91.9% of residents of 30055 zip code speak English at home.
7.0% of residents speak Spanish at home (73% very well, 27% well).
0.3% of residents speak other Indo-European language at home (100% very well).
0.4% of residents speak Asian or Pacific Island language at home (100% well).
Foreign born population: 151 (4.2%) (30.4% of them are naturalized citizens)
This zip code:
4.2%
Whole state:
10.7%
47%Honduras
25%Barbados
14%Uruguay
10%Burma (Myanmar)
1%Azores Islands
35%American
15%English
9%Irish
4%Italian
4%German
2%European
2%Belgian
Year of entry for the foreign-born population
1312010 or later
152000 to 2009
241990 to 1999
39Before 1990
Facilities with environmental interests located in this zip code:
BEAVER MANUFACTURING CO INC (12 ED NEEDHAM DR in MANSFIELD, GA)
AIR MINOR (AIRS/AFS) COMPLIANCE ACTIVITY (Tracking inspections of insecticide, fungicide, and rodenticide, and toxic substances) CRITERIA AND HAZARDOUS AIR POLLUTANT INVENTORY (Inventory of air pollution sources) HAZARDOUS WASTE BIENNIAL REPORTER (Resource Conservation and Recovery Act (tracking hazardous waste)) Large Quantity Generators, more that 1000 kg of hazardous waste/month (Resource Conservation and Recovery Act (tracking hazardous waste)) TRI REPORTER (Tracking of toxic chemicals releasing facilities) Business SIC classification: COATED FABRICS, NOT RUBBERIZED; MANMADE ORGANIC FIBERS, EXCEPT CELLULOSIC Business NAICS classification: TEXTILE AND FABRIC FINISHING (EXCEPT BROADWOVEN FABRIC) MILLS.
MANSFIELD ELEMENTARY SCHOOL (45 EAST THIRD AVENUE in MANSFIELD, GA)
(Geographic Names Information System) (National Center for Education Statistics) - STATE ID-4050 Organizations: NEWTON COUNTY (SCHOOL DISTRICT)
MANSFIELD, TOWN OF (401 LOYD ROAD in MANSFIELD, GA)
National Pollutant Discharge Elimination System NON-MAJOR (Tracking pollutant discharge elimination systems) - permit Business SIC classification: SEWERAGE SYSTEMS Organizations: CITY OF MANSFIELD (CONTACT/OWNER)
Alternative names: MANSFIELD, CITY OF
Housing units lacking complete plumbing facilities: 1.1% Housing units lacking complete kitchen facilities: 1.1%
80.1%Electricity
9.2%Utility gas
8.7%Bottled, tank, or LP gas
1.3%Wood
0.9%Other fuel
Place of birth for U.S.-born residents:
This state: 2,691
Northeast: 127
Midwest: 84
South: 357
West: 130
53% of the 30055 zip code residents lived in the same house 5 years ago. Out of people who lived in different houses, 31% lived in this county. Out of people who lived in different counties, 50% lived in Georgia.
87% of the 30055 zip code residents lived in the same house 1 year ago. Out of people who lived in different houses, 24% moved from this county. Out of people who lived in different houses, 56% moved from different county within same state. Out of people who lived in different houses, 13% moved from different state. Out of people who lived in different houses, 6% moved from abroad.
Private vs. public school enrollment:
Students in private schools in grades 1 to 8 (elementary and middle school): 81
Here:
17.2%
Georgia:
12.1%
Students in private schools in grades 9 to 12 (high school): 11
Here:
19.8%
Georgia:
10.8%
Students in private undergraduate colleges: 25
Here:
38.0%
Georgia:
17.1%
Occupation by median earnings in the past 12 months ($)
148,344Fire fighting and prevention, and other protective service workers including supervisors
78,990Production occupations
78,899Transportation occupations
73,326Health diagnosing and treating practitioners and other technical occupations
72,610Management occupations
62,079Construction and extraction occupations
Companies with federal contracts located in this zip code:
HY-LINE INTERNATIONAL (4432 HIGHWAY 213 in MANSFIELD, GA) : $39,000 in 16 contractsfrom 1999 to 2000
Contracts for Meat, Poultry, and Fish by Centers for Disease Control and Prevention Signed by year:2000: $21,000; 2001: $0; 2002: $0; 2003: $0; 2004: $0; 2005: $0; 2006: $0.
Biggest contracts:
$16,000 with Centers for Disease Control and Prevention for Meat, Poultry, and Fish. Taking place in IN. Signed on 1999-11-15. Completion date: 1999-12-15.
$4,000, same as above.Signed on 2000-06-15. Completion date: 2000-06-15.
$3,000, same as above.Signed on 2000-08-15. Completion date: 2000-09-15.
$3,000, same as above.Signed on 2000-02-15. Completion date: 2000-03-15.
Top industries in this zip code by the number of employees in 2005:
Construction: New Single-Family Housing Construction (except Operative Builders) (20-49 employees: 1 establishment)
Other Services (except Public Administration): Industrial Launderers (20-49: 1)
Construction: Water and Sewer Line and Related Structures Construction (5-9: 3, 1-4: 2)
Construction: Plumbing, Heating, and Air-Conditioning Contractors (5-9: 2, 1-4: 2)
Construction: Site Preparation Contractors (10-19: 1, 1-4: 1)
Administrative and Support and Waste Management and Remediation Services: Office Administrative Services (10-19: 1)
Arts, Entertainment, and Recreation: All Other Amusement and Recreation Industries (10-19: 1)
Arts, Entertainment, and Recreation: Fitness and Recreational Sports Centers (10-19: 1)
People in group quarters in 2000:
63 people in nursing homes
Fatal accident statistics in 2014:
Fatal accident count: 1
Vehicles involved in fatal accidents: 2
Fatal accidents caused by drunken drivers: 0
Fatalities: 1
Persons involved in fatal accidents: 2
Pedestrians involved in fatal accidents: 0
Fatal accident statistics in 2013:
Fatal accident count: 1
Vehicles involved in fatal accidents: 1
Fatal accidents caused by drunken drivers: 0
Fatalities: 1
Persons involved in fatal accidents: 1
Pedestrians involved in fatal accidents: 0
Home Mortgage Disclosure Act Aggregated Statistics For Year 2009 (Based on 2 partial tracts)
A) FHA, FSA/RHS & VA Home Purchase Loans
B) Conventional Home Purchase Loans
C) Refinancings
D) Home Improvement Loans
E) Loans on Dwellings For 5+ Families
F) Non-occupant Loans on < 5 Family Dwellings (A B C & D)
G) Loans On Manufactured Home Dwelling (A B C & D)
Number
Average Value
Number
Average Value
Number
Average Value
Number
Average Value
Number
Average Value
Number
Average Value
Number
Average Value
LOANS ORIGINATED
32
$182,628
25
$211,126
140
$187,371
6
$51,223
1
$1,295,880
10
$227,468
0
$0
APPLICATIONS APPROVED, NOT ACCEPTED
2
$126,720
3
$153,480
16
$169,655
1
$2,290
0
$0
1
$75,690
0
$0
APPLICATIONS DENIED
1
$235,670
6
$94,420
76
$193,749
4
$32,255
0
$0
2
$291,860
2
$43,865
APPLICATIONS WITHDRAWN
6
$187,788
4
$207,715
59
$191,214
2
$120,415
0
$0
1
$135,320
0
$0
FILES CLOSED FOR INCOMPLETENESS
1
$245,420
2
$159,405
17
$201,365
0
$0
0
$0
2
$131,020
0
$0
Aggregated Statistics For Year 2008 (Based on 2 partial tracts)
A) FHA, FSA/RHS & VA Home Purchase Loans
B) Conventional Home Purchase Loans
C) Refinancings
D) Home Improvement Loans
F) Non-occupant Loans on < 5 Family Dwellings (A B C & D)
G) Loans On Manufactured Home Dwelling (A B C & D)
Number
Average Value
Number
Average Value
Number
Average Value
Number
Average Value
Number
Average Value
Number
Average Value
LOANS ORIGINATED
18
$149,848
63
$204,522
107
$191,430
13
$103,874
18
$140,802
3
$54,090
APPLICATIONS APPROVED, NOT ACCEPTED
0
$0
5
$262,274
14
$164,443
3
$42,430
1
$185,210
1
$37,270
APPLICATIONS DENIED
5
$156,768
22
$306,482
89
$212,126
11
$44,673
8
$297,021
2
$100,345
APPLICATIONS WITHDRAWN
5
$179,016
13
$190,942
41
$220,535
2
$48,165
1
$321,100
1
$57,340
FILES CLOSED FOR INCOMPLETENESS
0
$0
3
$262,427
7
$252,460
0
$0
1
$56,770
0
$0
Aggregated Statistics For Year 2007 (Based on 2 partial tracts)
A) FHA, FSA/RHS & VA Home Purchase Loans
B) Conventional Home Purchase Loans
C) Refinancings
D) Home Improvement Loans
F) Non-occupant Loans on < 5 Family Dwellings (A B C & D)
G) Loans On Manufactured Home Dwelling (A B C & D)
Number
Average Value
Number
Average Value
Number
Average Value
Number
Average Value
Number
Average Value
Number
Average Value
LOANS ORIGINATED
9
$153,161
113
$212,259
136
$173,411
19
$41,375
24
$188,099
2
$79,990
APPLICATIONS APPROVED, NOT ACCEPTED
1
$76,840
11
$179,526
24
$178,208
5
$187,044
2
$220,470
1
$51,030
APPLICATIONS DENIED
3
$93,657
26
$306,857
118
$197,381
16
$52,430
7
$298,741
1
$1,720
APPLICATIONS WITHDRAWN
2
$224,485
16
$212,768
47
$186,074
1
$127,290
3
$107,990
1
$158,260
FILES CLOSED FOR INCOMPLETENESS
0
$0
5
$372,480
9
$256,373
2
$30,105
1
$149,080
0
$0
Aggregated Statistics For Year 2006 (Based on 2 partial tracts)
A) FHA, FSA/RHS & VA Home Purchase Loans
B) Conventional Home Purchase Loans
C) Refinancings
D) Home Improvement Loans
F) Non-occupant Loans on < 5 Family Dwellings (A B C & D)
G) Loans On Manufactured Home Dwelling (A B C & D)
Number
Average Value
Number
Average Value
Number
Average Value
Number
Average Value
Number
Average Value
Number
Average Value
LOANS ORIGINATED
14
$157,234
158
$164,294
170
$164,421
26
$82,437
43
$162,299
5
$66,744
APPLICATIONS APPROVED, NOT ACCEPTED
0
$0
17
$180,925
24
$127,940
1
$67,660
5
$155,048
1
$7,450
APPLICATIONS DENIED
1
$146,220
36
$220,313
97
$168,343
22
$31,329
9
$164,884
2
$56,195
APPLICATIONS WITHDRAWN
2
$136,470
22
$155,365
71
$167,925
2
$130,450
3
$79,510
1
$37,840
FILES CLOSED FOR INCOMPLETENESS
0
$0
3
$256,120
17
$168,141
1
$48,740
1
$43,010
0
$0
Aggregated Statistics For Year 2005 (Based on 2 partial tracts)
A) FHA, FSA/RHS & VA Home Purchase Loans
B) Conventional Home Purchase Loans
C) Refinancings
D) Home Improvement Loans
F) Non-occupant Loans on < 5 Family Dwellings (A B C & D)
G) Loans On Manufactured Home Dwelling (A B C & D)
Number
Average Value
Number
Average Value
Number
Average Value
Number
Average Value
Number
Average Value
Number
Average Value
LOANS ORIGINATED
17
$138,257
157
$165,490
199
$151,611
21
$69,272
32
$125,145
1
$29,240
APPLICATIONS APPROVED, NOT ACCEPTED
0
$0
10
$111,813
23
$141,405
4
$76,980
1
$83,720
0
$0
APPLICATIONS DENIED
2
$156,250
27
$213,793
115
$163,599
22
$47,879
7
$221,169
5
$59,978
APPLICATIONS WITHDRAWN
2
$156,540
17
$186,524
76
$142,890
12
$120,462
3
$128,060
1
$51,610
FILES CLOSED FOR INCOMPLETENESS
0
$0
3
$182,150
32
$161,860
2
$91,745
0
$0
0
$0
Aggregated Statistics For Year 2004 (Based on 2 partial tracts)
A) FHA, FSA/RHS & VA Home Purchase Loans
B) Conventional Home Purchase Loans
C) Refinancings
D) Home Improvement Loans
F) Non-occupant Loans on < 5 Family Dwellings (A B C & D)
G) Loans On Manufactured Home Dwelling (A B C & D)
Number
Average Value
Number
Average Value
Number
Average Value
Number
Average Value
Number
Average Value
Number
Average Value
LOANS ORIGINATED
25
$123,281
116
$155,836
213
$147,380
19
$69,532
21
$141,575
9
$67,151
APPLICATIONS APPROVED, NOT ACCEPTED
0
$0
9
$98,179
31
$110,481
6
$45,682
7
$87,157
0
$0
APPLICATIONS DENIED
3
$146,027
16
$129,982
91
$136,633
15
$27,791
3
$83,717
1
$95,760
APPLICATIONS WITHDRAWN
3
$99,580
11
$120,049
57
$140,221
6
$47,402
2
$102,925
1
$60,780
FILES CLOSED FOR INCOMPLETENESS
0
$0
5
$132,914
21
$147,364
2
$34,405
0
$0
0
$0
Aggregated Statistics For Year 2003 (Based on 2 partial tracts)
A) FHA, FSA/RHS & VA Home Purchase Loans
B) Conventional Home Purchase Loans
C) Refinancings
D) Home Improvement Loans
E) Loans on Dwellings For 5+ Families
F) Non-occupant Loans on < 5 Family Dwellings (A B C & D)
Number
Average Value
Number
Average Value
Number
Average Value
Number
Average Value
Number
Average Value
Number
Average Value
LOANS ORIGINATED
34
$122,067
112
$148,050
374
$137,665
11
$28,514
1
$173,170
23
$110,018
APPLICATIONS APPROVED, NOT ACCEPTED
1
$65,940
6
$136,470
35
$125,116
1
$28,670
0
$0
5
$83,028
APPLICATIONS DENIED
1
$90,020
13
$136,866
84
$138,558
9
$28,416
0
$0
2
$49,310
APPLICATIONS WITHDRAWN
2
$132,455
9
$121,816
44
$145,513
1
$197,820
0
$0
1
$47,590
FILES CLOSED FOR INCOMPLETENESS
1
$69,380
3
$152,143
11
$139,388
1
$43,010
0
$0
1
$64,790
Aggregated Statistics For Year 2002 (Based on 2 partial tracts)
A) FHA, FSA/RHS & VA Home Purchase Loans
B) Conventional Home Purchase Loans
C) Refinancings
D) Home Improvement Loans
F) Non-occupant Loans on < 5 Family Dwellings (A B C & D)
Number
Average Value
Number
Average Value
Number
Average Value
Number
Average Value
Number
Average Value
LOANS ORIGINATED
13
$120,723
65
$153,062
236
$136,051
15
$18,311
19
$130,373
APPLICATIONS APPROVED, NOT ACCEPTED
1
$142,200
5
$227,526
32
$134,606
3
$15,673
0
$0
APPLICATIONS DENIED
2
$123,570
7
$120,987
72
$140,913
7
$17,120
4
$170,300
APPLICATIONS WITHDRAWN
0
$0
7
$129,261
42
$149,575
5
$13,302
1
$88,300
FILES CLOSED FOR INCOMPLETENESS
1
$77,980
2
$131,020
13
$125,134
0
$0
1
$73,400
Aggregated Statistics For Year 2001 (Based on 2 partial tracts)
A) FHA, FSA/RHS & VA Home Purchase Loans
B) Conventional Home Purchase Loans
C) Refinancings
D) Home Improvement Loans
F) Non-occupant Loans on < 5 Family Dwellings (A B C & D)
Number
Average Value
Number
Average Value
Number
Average Value
Number
Average Value
Number
Average Value
LOANS ORIGINATED
25
$109,772
79
$132,426
249
$118,919
13
$20,818
24
$72,607
APPLICATIONS APPROVED, NOT ACCEPTED
1
$54,470
6
$144,115
26
$109,652
0
$0
0
$0
APPLICATIONS DENIED
3
$76,643
12
$175,365
77
$122,462
10
$22,764
2
$314,225
APPLICATIONS WITHDRAWN
7
$97,479
7
$203,066
42
$110,762
0
$0
1
$286,700
FILES CLOSED FOR INCOMPLETENESS
3
$107,033
3
$140,867
10
$84,060
0
$0
0
$0
Aggregated Statistics For Year 2000 (Based on 2 partial tracts)
A) FHA, FSA/RHS & VA Home Purchase Loans
B) Conventional Home Purchase Loans
C) Refinancings
D) Home Improvement Loans
F) Non-occupant Loans on < 5 Family Dwellings (A B C & D)
Number
Average Value
Number
Average Value
Number
Average Value
Number
Average Value
Number
Average Value
LOANS ORIGINATED
29
$110,291
91
$134,213
94
$105,140
24
$17,202
20
$78,785
APPLICATIONS APPROVED, NOT ACCEPTED
0
$0
6
$114,872
13
$68,852
6
$20,260
1
$98,050
APPLICATIONS DENIED
2
$114,680
21
$121,315
48
$83,167
19
$25,592
2
$71,100
APPLICATIONS WITHDRAWN
5
$88,532
12
$102,687
32
$70,922
1
$31,540
3
$81,233
FILES CLOSED FOR INCOMPLETENESS
1
$72,250
3
$80,083
6
$102,352
0
$0
1
$51,610
Aggregated Statistics For Year 1999 (Based on 1 partial tract)
A) FHA, FSA/RHS & VA Home Purchase Loans
B) Conventional Home Purchase Loans
C) Refinancings
D) Home Improvement Loans
F) Non-occupant Loans on < 5 Family Dwellings (A B C & D)
Detailed PMIC statistics for the following Tracts:1002.00
2002 - 2018 National Fire Incident Reporting System (NFIRS) incidents
According to the data from the years 2002 - 2018 the average number of fire incidents per year is 9. The highest number of reported fire incidents - 29 took place in 2014, and the least - 0 in 2004. The data has a growing trend.
When looking into fire subcategories, the most reports belonged to: Outside Fires (44.1%), and Structure Fires (36.8%).
Fire incident types reported to NFIRS in Zip Code 30055


 Nearest zip codes: 30056, 30014, 30164, 31085, 30070, 30025.


 According to the data from the years 2002 - 2018 the average number of fire incidents per year is 9. The highest number of reported fire incidents - 29 took place in 2014, and the least - 0 in 2004. The data has a growing trend.
 When looking into fire subcategories, the most reports belonged to: Outside Fires (44.1%), and Structure Fires (36.8%).