Estimated zip code population in 2022: 68,494 Zip code population in 2010: 61,912 Zip code population in 2000: 43,485
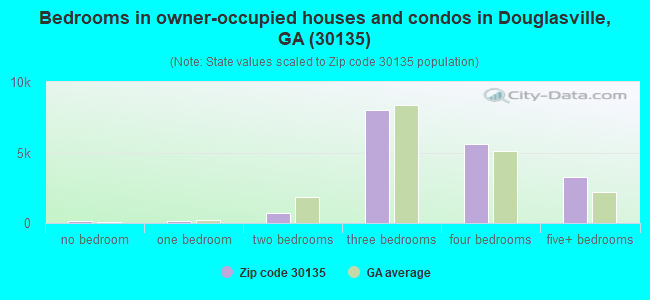
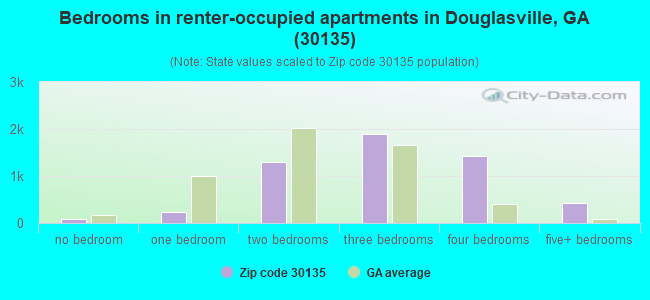
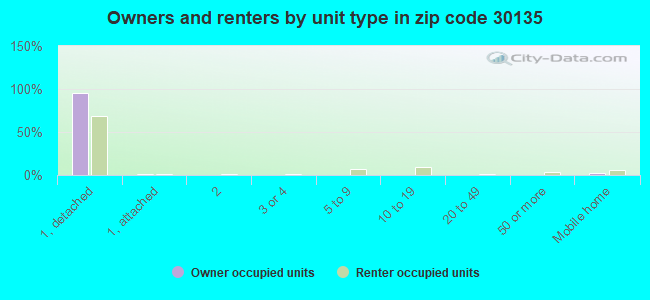
Houses and condos: 24,361 Renter-occupied apartments: 5,504
% of renters here:
24%
State:
34%
March 2022 cost of living index in zip code 30135: 100.8 (near average, U.S. average is 100)
Land area: 83.8 sq. mi. Water area: 0.6 sq. mi.
Population density: 818 people per square mile
(low).
OSM Map
General Map
Google Map
MSN Map
OSM Map
General Map
Google Map
MSN Map
OSM Map
General Map
Google Map
MSN Map
OSM Map
General Map
Google Map
MSN Map
Please wait while loading the map...
Real estate property taxes paid for housing units in 2022:
This zip code:
0.7% ($2,076)
Georgia:
0.7% ($2,160)
Median real estate property taxes paid for housing units with mortgages in 2022: $2,358 (0.8%) Median real estate property taxes paid for housing units with no mortgage in 2022: $1,257 (0.5%)
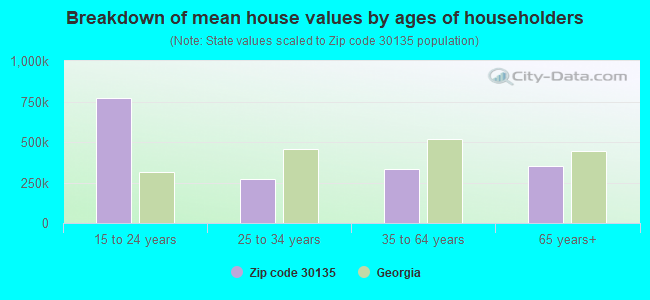
Estimated median house/condo value in 2022: $294,981
30135:
$294,981
Georgia:
$297,400
According to our research of Georgia and other state lists, there were 115 registered sex offenders living in 30135 zip code as of May 25, 2024. The ratio of all residents to sex offenders in zip code 30135 is 563 to 1. The ratio of registered sex offenders to all residents in this zip code is lower than the state average.
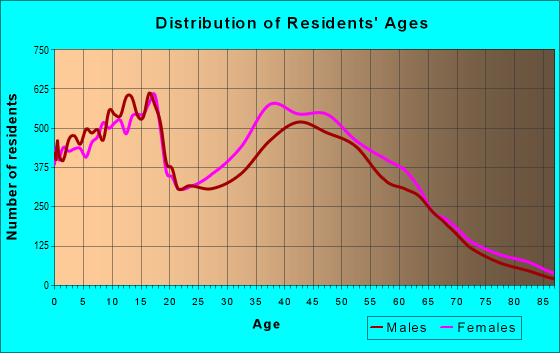
Median resident age:
This zip code:
38.0 years
Georgia median age:
37.6 years
Average household size:
This zip code:
2.9 people
Georgia:
2.6 people
Averages for the 2020 tax year for zip code 30135, filed in 2021:
Average Adjusted Gross Income (AGI) in 2020: $56,760 (Individual Income Tax Returns)
Here:
$56,760
State:
$70,847
Salary/wage: $51,594 (reported on 84.3% of returns)
Here:
$51,594
State:
$59,126
(% of AGI for various income ranges: 1217.4% for AGIs below $25k, 3837.9% for AGIs $25k-50k, 7166.3% for AGIs $50k-75k, 10633.1% for AGIs $75k-100k, 20046.9% for AGIs $100k-200k, 66871.8% for AGIs over 200k)
Taxable interest for individuals: $1,153 (reported on 16.4% of returns)
This zip code:
$1,153
Georgia:
$2,011
(% of AGI for various income ranges: 5.8% for AGIs below $25k, 8.3% for AGIs $25k-50k, 17.5% for AGIs $50k-75k, 41.7% for AGIs $75k-100k, 80.1% for AGIs $100k-200k, 733.2% for AGIs over 200k)
Ordinary dividends: $3,235 (reported on 10.2% of returns)
Here:
$3,235
State:
$8,996
(% of AGI for various income ranges: 8.4% for AGIs below $25k, 14.4% for AGIs $25k-50k, 33.8% for AGIs $50k-75k, 65.8% for AGIs $75k-100k, 143.9% for AGIs $100k-200k, 1295.0% for AGIs over 200k)
Net capital gain/loss in AGI: +$14,002 (reported on 9.0% of returns)
Here:
+$14,002
State:
+$28,402
(% of AGI for various income ranges: 2.5% for AGIs below $25k, 13.8% for AGIs $25k-50k, 30.7% for AGIs $50k-75k, 89.3% for AGIs $75k-100k, 378.2% for AGIs $100k-200k, 10489.3% for AGIs over 200k)
Profit/loss from business: +$540 (reported on 25.5% of returns)
Here:
+$540
State:
+$6,707
(% of AGI for various income ranges: 31.3% for AGIs below $25k, 10.6% for AGIs $75k-100k, 94.5% for AGIs $100k-200k, 1241.8% for AGIs over 200k)
Taxable individual retirement arrangement distribution: $15,995 (reported on 5.6% of returns)
30135:
$15,995
Georgia:
$20,525
(% of AGI for various income ranges: 24.4% for AGIs below $25k, 60.8% for AGIs $25k-50k, 118.8% for AGIs $50k-75k, 248.8% for AGIs $75k-100k, 508.1% for AGIs $100k-200k, 1424.3% for AGIs over 200k)
Self-employed (Keogh) retirement plans: $16,033 (reported on 0.1% of returns)
30135:
$16,033
Georgia:
$27,751
(% of AGI for various income ranges: 23.7% for AGIs $100k-200k)
Total itemized deductions: $30,465 (reported on 12.2% of returns)
Here:
$30,465
State:
$34,001
(% of AGI for various income ranges: 38.8% for AGIs below $25k, 174.6% for AGIs $25k-50k, 573.1% for AGIs $50k-75k, 994.6% for AGIs $75k-100k, 1884.9% for AGIs $100k-200k, 10432.9% for AGIs over 200k)
Charity contributions: $12,222 (reported on 10.8% of returns)
Here:
$12,222
State:
$14,164
(% of AGI for various income ranges: 5.6% for AGIs below $25k, 44.8% for AGIs $25k-50k, 158.3% for AGIs $50k-75k, 296.5% for AGIs $75k-100k, 639.6% for AGIs $100k-200k, 5506.1% for AGIs over 200k)
Taxes paid: $7,090 (reported on 12.2% of returns)
30135:
$7,090
State:
$7,540
(% of AGI for various income ranges: 6.6% for AGIs below $25k, 34.5% for AGIs $25k-50k, 137.0% for AGIs $50k-75k, 260.8% for AGIs $75k-100k, 538.5% for AGIs $100k-200k, 1653.2% for AGIs over 200k)
Earned income credit: $2,482 (reported on 22.1% of returns)
Here:
$2,482
State:
$2,530
(% of AGI for various income ranges: 126.2% for AGIs below $25k, 92.0% for AGIs $25k-50k, 1.7% for AGIs $50k-75k)
Percentage of individuals using paid preparers for their 2020 taxes: 92.3%
Here:
92%
State:
93%
(% for various income ranges: 91.9% for AGIs below $25k, 93.1% for AGIs $25k-50k, 92.1% for AGIs $50k-75k, 91.0% for AGIs $75k-100k, 92.5% for AGIs $100k-200k, 93.1% for AGIs over 200k)
Averages for the 2012 tax year for zip code 30135, filed in 2013:
Average Adjusted Gross Income (AGI) in 2012: $51,707 (Individual Income Tax Returns)
Here:
$51,707
State:
$56,131
Salary/wage: $47,683 (reported on 87.3% of returns)
Here:
$47,683
State:
$47,942
(% of AGI for various income ranges: 81.3% for AGIs below $25k, 87.1% for AGIs $25k-50k, 83.5% for AGIs $50k-75k, 80.5% for AGIs $75k-100k, 81.3% for AGIs $100k-200k, 64.9% for AGIs over 200k)
Taxable interest for individuals: $982 (reported on 22.7% of returns)
This zip code:
$982
Georgia:
$1,706
(% of AGI for various income ranges: 0.7% for AGIs below $25k, 0.4% for AGIs $25k-50k, 0.3% for AGIs $50k-75k, 0.4% for AGIs $75k-100k, 0.4% for AGIs $100k-200k, 0.5% for AGIs over 200k)
Ordinary dividends: $2,831 (reported on 12.4% of returns)
Here:
$2,831
State:
$7,265
(% of AGI for various income ranges: 0.7% for AGIs below $25k, 0.4% for AGIs $25k-50k, 0.5% for AGIs $50k-75k, 0.5% for AGIs $75k-100k, 0.7% for AGIs $100k-200k, 1.7% for AGIs over 200k)
Net capital gain/loss in AGI: +$2,750 (reported on 9.1% of returns)
Here:
+$2,750
State:
+$16,323
(% of AGI for various income ranges: 0.2% for AGIs $75k-100k, 0.6% for AGIs $100k-200k, 2.7% for AGIs over 200k)
Profit/loss from business: +$3,185 (reported on 20.7% of returns)
Here:
+$3,185
State:
+$7,583
(% of AGI for various income ranges: 6.6% for AGIs below $25k, 0.1% for AGIs $50k-75k, 0.8% for AGIs $75k-100k, 1.1% for AGIs $100k-200k, 2.0% for AGIs over 200k)
Taxable individual retirement arrangement distribution: $15,198 (reported on 7.1% of returns)
30135:
$15,198
Georgia:
$17,199
(% of AGI for various income ranges: 2.1% for AGIs below $25k, 1.7% for AGIs $25k-50k, 1.9% for AGIs $50k-75k, 2.3% for AGIs $75k-100k, 2.1% for AGIs $100k-200k, 2.6% for AGIs over 200k)
Self-employment retirement plans: $16,317 (reported on 0.2% of returns)
30135:
$16,317
Georgia:
$23,277
Total itemized deductions: $21,140 (25% of AGI, reported on 41.8% of returns)
Here:
$21,140
State:
$23,886
Here:
24.7% of AGI
State:
21.5% of AGI
(% of AGI for various income ranges: 11.3% for AGIs below $25k, 16.9% for AGIs $25k-50k, 19.1% for AGIs $50k-75k, 18.9% for AGIs $75k-100k, 18.3% for AGIs $100k-200k, 13.8% for AGIs over 200k)
Charity contributions: $4,724 (reported on 36.2% of returns)
Here:
$4,724
State:
$5,507
(% of AGI for various income ranges: 1.5% for AGIs below $25k, 2.9% for AGIs $25k-50k, 3.6% for AGIs $50k-75k, 3.6% for AGIs $75k-100k, 3.7% for AGIs $100k-200k, 3.5% for AGIs over 200k)
Taxes paid: $6,045 (reported on 41.6% of returns)
30135:
$6,045
State:
$7,838
(% of AGI for various income ranges: 1.7% for AGIs below $25k, 3.2% for AGIs $25k-50k, 4.6% for AGIs $50k-75k, 5.3% for AGIs $75k-100k, 6.2% for AGIs $100k-200k, 6.1% for AGIs over 200k)
Earned income credit: $2,519 (reported on 23.6% of returns)
Here:
$2,519
State:
$2,589
(% of AGI for various income ranges: 9.6% for AGIs below $25k, 1.5% for AGIs $25k-50k)
Percentage of individuals using paid preparers for their 2012 taxes: 51.3%
Here:
51%
State:
55%
(% for various income ranges: 49.3% for AGIs below $25k, 51.7% for AGIs $25k-50k, 52.6% for AGIs $50k-75k, 53.0% for AGIs $75k-100k, 52.0% for AGIs $100k-200k, 65.4% for AGIs over 200k)
Averages for the 2004 tax year for zip code 30135, filed in 2005:
Average Adjusted Gross Income (AGI) in 2004: $49,115 (Individual Income Tax Returns)
Here:
$49,115
State:
$47,553
Salary/wage: $45,853 (reported on 90.1% of returns)
Here:
$45,853
State:
$42,178
(% of AGI for various income ranges: 228.4% for AGIs below $10k, 83.2% for AGIs $10k-25k, 89.5% for AGIs $25k-50k, 87.8% for AGIs $50k-75k, 88.5% for AGIs $75k-100k, 73.9% for AGIs over 100k)
Taxable interest for individuals: $1,084 (reported on 36.1% of returns)
This zip code:
$1,084
Georgia:
$1,772
(% of AGI for various income ranges: 5.2% for AGIs below $10k, 1.3% for AGIs $10k-25k, 0.5% for AGIs $25k-50k, 0.6% for AGIs $50k-75k, 0.5% for AGIs $75k-100k, 1.0% for AGIs over 100k)
Taxable dividends: $1,395 (reported on 18.5% of returns)
Here:
$1,395
State:
$4,283
(% of AGI for various income ranges: 2.5% for AGIs below $10k, 0.7% for AGIs $10k-25k, 0.4% for AGIs $25k-50k, 0.5% for AGIs $50k-75k, 0.4% for AGIs $75k-100k, 0.6% for AGIs over 100k)
Net capital gain/loss: +$10,408 (reported on 13.5% of returns)
Here:
+$10,408
State:
+$16,461
(% of AGI for various income ranges: 1.5% for AGIs below $10k, 0.2% for AGIs $10k-25k, 0.3% for AGIs $25k-50k, 0.6% for AGIs $50k-75k, 0.8% for AGIs $75k-100k, 7.3% for AGIs over 100k)
Profit/loss from business: +$4,958 (reported on 17.4% of returns)
Here:
+$4,958
State:
+$8,201
(% of AGI for various income ranges: 5.5% for AGIs below $10k, 4.8% for AGIs $10k-25k, 1.0% for AGIs $25k-50k, 0.9% for AGIs $50k-75k, 0.9% for AGIs $75k-100k, 2.4% for AGIs over 100k)
IRA payment deduction: $2,973 (reported on 2.2% of returns)
30135:
$2,973
Georgia:
$2,969
(% of AGI for various income ranges: 0.4% for AGIs below $10k, 0.1% for AGIs $10k-25k, 0.2% for AGIs $25k-50k, 0.1% for AGIs $50k-75k, 0.1% for AGIs $75k-100k, 0.1% for AGIs over 100k)
Self-employed pension: $10,740 (reported on 0.5% of returns)
Here:
$10,740
Georgia:
$16,203
(% of AGI for various income ranges: 0.0% for AGIs $25k-50k, 0.0% for AGIs $50k-75k, 0.0% for AGIs $75k-100k, 0.2% for AGIs over 100k)
Total itemized deductions: $19,092 (25% of AGI, reported on 49.9% of returns)
Here:
$19,092
State:
$19,944
Here:
25.3% of AGI
State:
22.6% of AGI
(% of AGI for various income ranges: 30.3% for AGIs below $10k, 14.7% for AGIs $10k-25k, 20.1% for AGIs $25k-50k, 23.0% for AGIs $50k-75k, 20.2% for AGIs $75k-100k, 17.2% for AGIs over 100k)
Charity contributions deductions: $3,765 (5% of AGI, reported on 45.1% of returns)
Here:
$3,765
State:
$4,354
Here:
4.8% of AGI
State:
4.7% of AGI
(% of AGI for various income ranges: 2.4% for AGIs below $10k, 2.2% for AGIs $10k-25k, 3.4% for AGIs $25k-50k, 3.6% for AGIs $50k-75k, 3.6% for AGIs $75k-100k, 3.6% for AGIs over 100k)
Total tax: $6,634 (reported on 76.3% of returns)
30135:
$6,634
State:
$8,223
(% of AGI for various income ranges: 6.8% for AGIs below $10k, 4.1% for AGIs $10k-25k, 5.9% for AGIs $25k-50k, 7.9% for AGIs $50k-75k, 9.4% for AGIs $75k-100k, 15.9% for AGIs over 100k)
Earned income credit: $1,873 (reported on 15.5% of returns)
Here:
$1,873
State:
$1,986
Percentage of individuals using paid preparers for their 2004 taxes: 55.6%
Here:
56%
State:
62%
(% for various income ranges: 46.4% for AGIs below $10k, 58.3% for AGIs $10k-25k, 57.2% for AGIs $25k-50k, 57.2% for AGIs $50k-75k, 56.6% for AGIs $75k-100k, 57.5% for AGIs over 100k)
Likely homosexual households (counted as self-reported same-sex unmarried-partner households)
Lesbian couples: 0.3% of all households
Gay men: 0.1% of all households
Household received Food Stamps/SNAP in the past 12 months: 3,223 Household did not receive Food Stamps/SNAP in the past 12 months: 19,969
Women who had a birth in the past 12 months: 1,324 (853 now married, 471 unmarried) Women who did not have a birth in the past 12 months: 15,951 (6,275 now married, 9,676 unmarried)
Housing units in zip code 30135 with a mortgage: 13,370 (691 second mortgage, 22 home equity loan, 533 both second mortgage and home equity loan) Houses without a mortgage: 269
Median monthly owner costs for units with a mortgage: $1,586 Median monthly owner costs for units without a mortgage: $445
Residents with income below the poverty level in 2022:
This zip code:
10.1%
Whole state:
12.7%
Residents with income below 50% of the poverty level in 2022:
This zip code:
4.6%
Whole state:
6.3%
Median number of rooms in houses and condos:
Here:
7.3
State:
6.8
Median number of rooms in apartments:
Here:
5.9
State:
4.6
Notable locations in this zip code not listed on our city pages
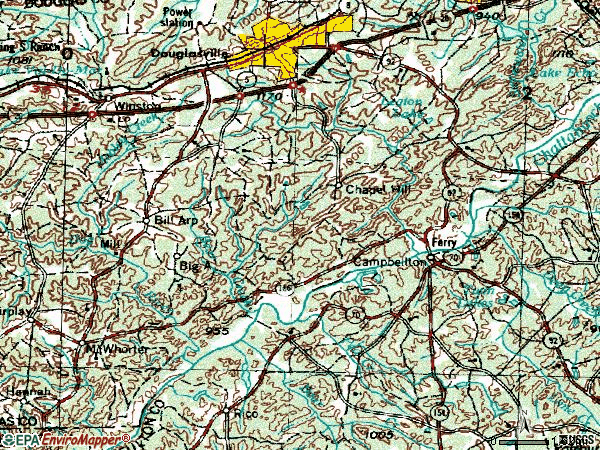
Notable locations in zip code 30135: Bill Arp (A), Phillips Mill (B), West Atlanta Raceway (C), Big A (D), Douglas County Fire Department Station 6 (E), Douglas County Chamber of Commerce (F), Douglas County Fire Department Station 5 (G), Douglas County Fire Department Station 3 (H), Inner Harbour Treatment Center for Children and Families (I), Douglas County Fire Department Station 4 (J). Display/hide their locations on the map
Shopping Centers: Boulevard Center Shopping Center (1), Market Square Shopping Center (2), Park Place Shopping Center (3), Douglas Corner Shopping Center (4), Cedar Mountain Village Shopping Center (5), Cosby Station Shopping Center (6), Douglas Crossing Shopping Center (7), Douglasville Marketplace Shopping Center (8), Douglasville Pavillion Shopping Center (9). Display/hide their locations on the map
Churches in zip code 30135 include: Basket Creek Church (A), Bright Star Church (B), Central Church (C), Community Grove Church (D), Ebenezer Church (E), Fairfield Church (F), Flint Hill Church (G), Kings Way Church (H), Midway Church (I). Display/hide their locations on the map
Reservoirs: Coursey Lake (A), Douglasville Lake (B), Barney Lake (C), Legion Lake (D), Easons Lake (E), Turnipseed Lake (F), Austin North Lake (G), Groover Lake (H). Display/hide their locations on the map
Streams, rivers, and creeks: Yellow Rock Creek (A), Anneewakee Creek (B), Tanyard Branch (C), Slater Mill Creek (D), Gilberts Branch (E), Flyblow Creek (F), Dog River (G), Crooked Creek (H), Caine Creek (I). Display/hide their locations on the map
8,964 married couples with children.
5,151 single-parent households (1,149 men, 4,002 women).
87.7% of residents of 30135 zip code speak English at home.
7.2% of residents speak Spanish at home (69% very well, 14% well, 11% not well, 6% not at all).
2.5% of residents speak other Indo-European language at home (83% very well, 14% well, 2% not at all).
1.7% of residents speak Asian or Pacific Island language at home (53% very well, 21% well, 15% not well, 10% not at all).
0.7% of residents speak other language at home (95% very well, 5% well).
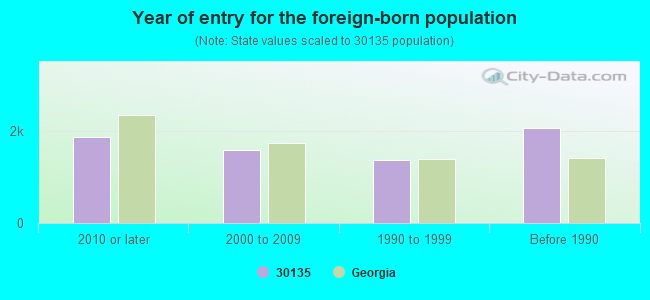
Foreign born population: 6,120 (8.9%) (63.6% of them are naturalized citizens)
Major facilities with environmental interests located in this zip code:
CIRCLE K #4508 (3981 HWY 5 in DOUGLASVILLE, GA)
STATE MASTER (Georgia's Geographic Environmental Information) - UST-1, UNDERGROUND STORAGE TANK PROGRAM, UST-2, UST-5, UST-6, UST-4, Conditionally Exempt Small Quantity Generators, less than 100 kg/month of hazardous waste (Resource Conservation and Recovery Act (tracking hazardous waste)) - notification Organizations: ATC ASSOCIATES INC (CONTACT/AGENT)
, CIRCLE K STORES INC (CONTACT/OPERATOR)
, CONVENIENCE PROPERTIES LTD (CONTACT/OWNER)
, APEX (INSTALLER)
CIRCLE K #4509 (6036 FAIRBURN RD in DOUGLASVILLE, GA)
STATE MASTER (Georgia's Geographic Environmental Information) - UST-2, UNDERGROUND STORAGE TANK PROGRAM, UST-3, UST-1, (Resource Conservation and Recovery Act (tracking hazardous waste)) Organizations: CIRCLE K STORES INC (CONTACT/OPERATOR)
, APEX (INSTALLER)
Alternative names: A&L VENTURE LLC
ALEXANDER HIGH SCHOOL (6500 ALEXANDER PKWY in DOUGLASVILLE, GA)
(National Center for Education Statistics) - STATE ID-0187 National Pollutant Discharge Elimination System NON-MAJOR (Tracking pollutant discharge elimination systems) - permit Conditionally Exempt Small Quantity Generators, less than 100 kg/month of hazardous waste (Resource Conservation and Recovery Act (tracking hazardous waste)) - notification Business SIC classification: ELEMENTARY AND SECONDARY SCHOOLS Organizations: DOUGLAS CO BOARD OF EDUCATION (CONTACT/OWNER)
, DOUGLAS COUNTY (SCHOOL DISTRICT)
BILL ARP ELEMENTARY SCHOOL (4841 HIGHWAY 5 in DOUGLASVILLE, GA)
(Geographic Names Information System) (National Center for Education Statistics) - STATE ID-1050 National Pollutant Discharge Elimination System NON-MAJOR (Tracking pollutant discharge elimination systems) - permit Business SIC classification: ELEMENTARY AND SECONDARY SCHOOLS Organizations: DOUGLAS COUNTY (SCHOOL DISTRICT)
Alternative names: DOUGLAS CO BRD OF EDUCATION
MAGIC TOUCH CLEANERS INCORPORATED (7421 DOUGLAS BOULEVARD SUITE A in DOUGLASVILLE, GA)
(Resource Conservation and Recovery Act (tracking hazardous waste)) Conditionally Exempt Small Quantity Generators, less than 100 kg/month of hazardous waste (Resource Conservation and Recovery Act (tracking hazardous waste)) - notification Organizations: MIKE LEE (CONTACT/OWNER)
, MYUNG GUEN LEE (CONTACT/OWNER)
ARBOR STATION ELEMENTARY SCHOOL (9999 PARKWAY SOUTH in DOUGLASVILLE, GA)
(Geographic Names Information System) (National Center for Education Statistics) - STATE ID-0178 Organizations: DOUGLAS COUNTY (SCHOOL DISTRICT)
FACTORY SHOALS ELEMENTARY SCHOOL (3046 FAIRBURN ROAD in DOUGLASVILLE, GA)
(Geographic Names Information System) (National Center for Education Statistics) - STATE ID-0189 Organizations: DOUGLAS COUNTY (SCHOOL DISTRICT)
CHAPEL HILL ELEMENTARY SCHOOL (3991 CHAPEL HILL ROAD in DOUGLASVILLE, GA)
(Geographic Names Information System) (National Center for Education Statistics) - STATE ID-0280 Organizations: DOUGLAS COUNTY (SCHOOL DISTRICT)
CHAPEL HILL MIDDLE SCHOOL (3989 CHAPEL HILL ROAD in DOUGLASVILLE, GA)
(Geographic Names Information System) (National Center for Education Statistics) - STATE ID-3550 Organizations: DOUGLAS COUNTY (SCHOOL DISTRICT)
CHESTNUT LOG MIDDLE SCHOOL (2544 POPE ROAD in DOUGLASVILLE, GA)
(Geographic Names Information System) (National Center for Education Statistics) - STATE ID-0188 Organizations: DOUGLAS COUNTY (SCHOOL DISTRICT)
MOUNT CARMEL ELEMENTARY SCHOOL (2356 FAIRBURN ROAD in DOUGLASVILLE, GA)
(National Center for Education Statistics) - STATE ID-4052 Organizations: DOUGLAS COUNTY (SCHOOL DISTRICT)
BASKET CREEK DRUM DISPOSAL (7768 BASKET CREEK RD in DOUGLASVILLE, GA)
SUPERFUND (Superfund database) (Integrated Compliance Information System) - ICIS-04-1991-0051, FORMAL ENFORCEMENT ACTION Alternative names: BASKET CREEK BURIED PIT/SITE # 2
FAIRPLAY MIDDLE SCHOOL (8311 HIGHWAY 166 in DOUGLASVILLE, GA)
(National Center for Education Statistics) - STATE ID-0180 Organizations: DOUGLAS COUNTY (SCHOOL DISTRICT)
Housing units lacking complete plumbing facilities: 0.6% Housing units lacking complete kitchen facilities: 0.8%
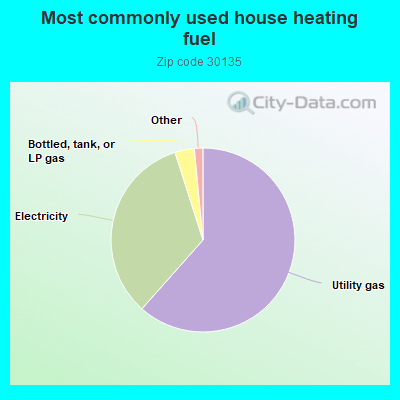
61.5%Utility gas
33.5%Electricity
3.4%Bottled, tank, or LP gas
0.6%No fuel used
0.5%Wood
Population in 1990: 32,887. Population change in the 1990s: +10,598 (+32.2%).
Place of birth for U.S.-born residents:
This state: 33,226
Northeast: 6,187
Midwest: 5,106
South: 14,967
West: 2,064
53% of the 30135 zip code residents lived in the same house 5 years ago. Out of people who lived in different houses, 43% lived in this county. Out of people who lived in different counties, 50% lived in Georgia.
90% of the 30135 zip code residents lived in the same house 1 year ago. Out of people who lived in different houses, 32% moved from this county. Out of people who lived in different houses, 46% moved from different county within same state. Out of people who lived in different houses, 18% moved from different state. Out of people who lived in different houses, 5% moved from abroad.
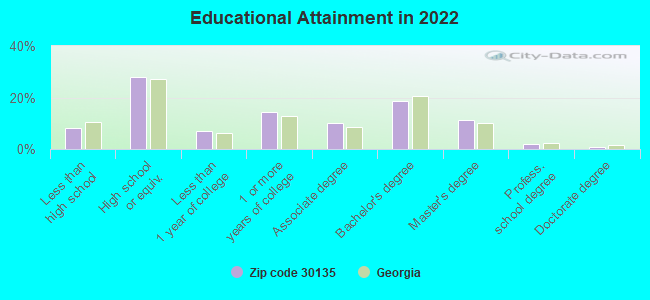
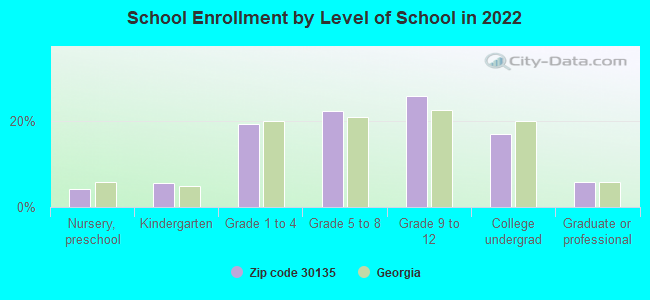
Private vs. public school enrollment:
Students in private schools in grades 1 to 8 (elementary and middle school): 936
Here:
12.0%
Georgia:
12.1%
Students in private schools in grades 9 to 12 (high school): 566
Here:
11.8%
Georgia:
10.8%
Students in private undergraduate colleges: 381
Here:
12.0%
Georgia:
17.1%
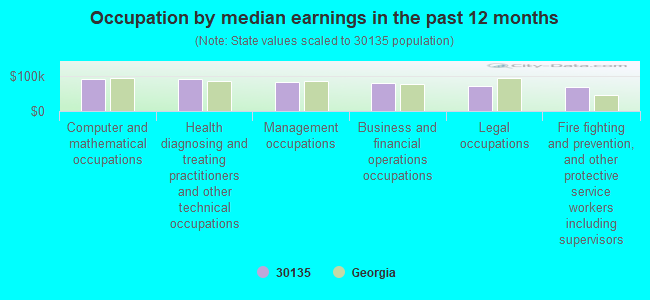
Occupation by median earnings in the past 12 months ($)
90,940Computer and mathematical occupations
90,259Health diagnosing and treating practitioners and other technical occupations
81,748Management occupations
80,374Business and financial operations occupations
71,186Legal occupations
69,283Fire fighting and prevention, and other protective service workers including supervisors
Companies with federal contracts located in this zip code (DOUGLASVILLE, GA):
C S BRITTON, INC (3430 WEST COUNTY LINE ROAD; small business) : $66,465 in 3 contractsfrom 2000 to 2001
$24,700 with Air Force for Maintenance, Repair or Alteration of Real Property -- Airport Runways. Signed on 2001-09-30. Completion date: 2001-12-31.
$23,475 with Air Force for Maintenance, Repair or Alteration of Real Property -- Miscellaneous Buildings. Signed on 2000-09-30. Completion date: 2000-12-31.
$18,290 with Navy for Maintenance, Repair or Alteration of Real Property -- Other Non-Building Facilities. Signed on 2000-09-29. Completion date: 2000-12-07.
BRITTON MECHANICAL SERVICES, I (3430 WEST COUNTY LINE ROAD; small business) : $60,025 in 6 contractsfrom 2002 to 2003
Contracts for Maintenance, Repair or Alteration of Real Property -- Other Administrative Facilities and Service Buildings, Maintenance, Repair or Alteration of Real Property -- Family Housing Facilities, Maintenance, Repair or Alteration of Real Property -- Heating and Cooling Plants, Maintenance, Repair or Alteration of Real Property -- Unimproved Real Property (Land) by Navy Signed by year:2000: $0; 2001: $0; 2002: $39,425; 2003: $20,600; 2004: $0; 2005: $0; 2006: $0.
Biggest contracts:
$23,800 with Navy for Maintenance, Repair or Alteration of Real Property -- Other Administrative Facilities and Service Buildings. Signed on 2003-05-30. Completion date: 2003-06-25.
$20,637, same as above.Signed on 2002-01-23. Completion date: 2002-03-11.
$12,238 with Navy for Maintenance, Repair or Alteration of Real Property -- Family Housing Facilities. Signed on 2002-09-28. Completion date: 2002-12-05.
$5,600 with Navy for Maintenance, Repair or Alteration of Real Property -- Heating and Cooling Plants. Signed on 2002-03-12. Completion date: 2002-04-11.
RICHARD G HUNTER, INC (5357 STEEPLE CHASE; small business) : $47,173 in 10 contractsfrom 2000 to 2006
Contracts for Office Furniture, Installation of Equipment -- Weapons, Installation of Equipment -- Miscellaneous by U.S. Army Corps of Engineers - civil program financing only, Army Signed by year:2000: $9,111; 2001: $12,562; 2002: $0; 2003: $8,728; 2004: $0; 2005: $3,975; 2006: $12,797.
Biggest contracts:
$12,562 with U.S. Army Corps of Engineers - civil program financing only for Office Furniture. Signed on 2001-04-18. Completion date: 2001-05-31.
$9,111 with U.S. Army Corps of Engineers - civil program financing only for Installation of Equipment -- Weapons. Signed on 2000-11-09. Completion date: 2001-02-28.
$6,847 with Army for Office Furniture. Signed on 2006-06-21. Completion date: 2006-07-31.
$5,292 with Army for Installation of Equipment -- Miscellaneous. Taking place in AL. Signed on 2006-05-19. Completion date: 2006-06-19.
HIGHER RESOURCES INC. (3336 GOLF RIDGE BLVD.; small business)
$29,765 with Air Force for Film/Video Tape Production Services. Taking place in DC. Signed on 2000-07-30. Completion date: 2000-09-30.
NANCY C REECE (2122 MIDWAY ROAD; small business) : $14,655 in 2 contractsfrom 2001 to 2003
$7,980 with U.S. Army Corps of Engineers - civil program financing only for Recreation Site Maintenance Services (non-construction). Signed on 2001-04-18. Completion date: 2001-09-04.
$6,675, same as above.Signed on 2003-03-27. Completion date: 2003-09-02.
WESTSIDE WELDING SERVICE (6371 RIDGE WAY; small business)
$7,080 with Army for Maintenance, Repair or Alteration of Real Property -- Miscellaneous Buildings. Signed on 2001-09-22. Completion date: 2001-09-25.
INDUSTRIAL COMMERCIAL ELECTRON (4200 HIGHWAY 92)
$4,410 with Air Force for Maintenance, Repair and Rebuilding of Equipment -- Miscellaneous. Signed on 2006-01-20. Completion date: 2006-02-03.
Top industries in this zip code by the number of employees in 2005:
Health Care and Social Assistance: General Medical and Surgical Hospitals (500-999: 1)
Administrative and Support and Waste Management and Remediation Services: Temporary Help Services (250-499: 1, 100-249: 1, 50-99: 2, 20-49: 1, 10-19: 1)
Health Care and Social Assistance: Child Day Care Services (20-49: 8, 10-19: 6, 5-9: 3, 1-4: 2)
Health Care and Social Assistance: Psychiatric and Substance Abuse Hospitals (250-499: 1)
People in group quarters in 2010:
240 people in nursing facilities/skilled-nursing facilities
129 people in residential treatment centers for juveniles (non-correctional)
8 people in workers' group living quarters and job corps centers
6 people in group homes intended for adults
People in group quarters in 2000:
258 people in nursing homes
25 people in homes for the mentally retarded
Fatal accident statistics in 2014:
Fatal accident count: 4
Vehicles involved in fatal accidents: 6
Fatal accidents caused by drunken drivers: 2
Fatalities: 4
Persons involved in fatal accidents: 7
Pedestrians involved in fatal accidents: 0
Fatal accident statistics in 2013:
Fatal accident count: 6
Vehicles involved in fatal accidents: 9
Fatal accidents caused by drunken drivers: 1
Fatalities: 6
Persons involved in fatal accidents: 10
Pedestrians involved in fatal accidents: 1
Home Mortgage Disclosure Act Aggregated Statistics For Year 2009 (Based on 8 full and 10 partial tracts)
A) FHA, FSA/RHS & VA Home Purchase Loans
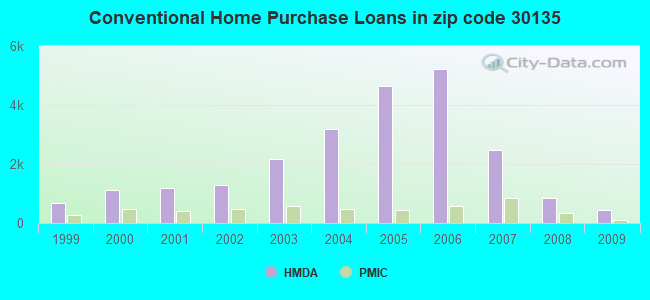
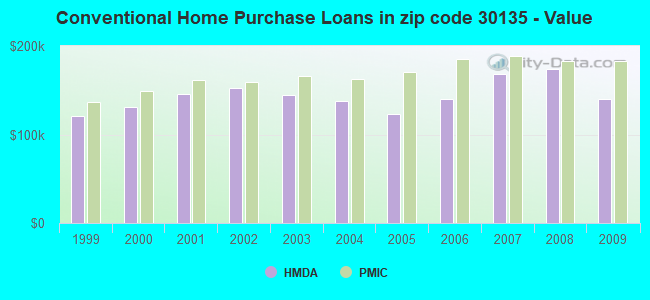
B) Conventional Home Purchase Loans
C) Refinancings
D) Home Improvement Loans
E) Loans on Dwellings For 5+ Families
F) Non-occupant Loans on < 5 Family Dwellings (A B C & D)
G) Loans On Manufactured Home Dwelling (A B C & D)
Number
Average Value
Number
Average Value
Number
Average Value
Number
Average Value
Number
Average Value
Number
Average Value
Number
Average Value
LOANS ORIGINATED
987
$151,940
454
$139,692
2,223
$175,197
59
$33,793
2
$8,932,815
317
$117,679
0
$0
APPLICATIONS APPROVED, NOT ACCEPTED
57
$156,646
28
$177,271
218
$188,766
23
$31,719
0
$0
12
$104,693
1
$63,690
APPLICATIONS DENIED
226
$139,979
93
$160,395
1,324
$176,957
128
$48,713
0
$0
85
$144,716
10
$83,834
APPLICATIONS WITHDRAWN
241
$142,416
91
$149,871
804
$178,537
25
$63,857
0
$0
53
$144,718
1
$105,910
FILES CLOSED FOR INCOMPLETENESS
37
$140,716
11
$90,897
209
$176,610
4
$151,050
0
$0
9
$135,284
0
$0
Aggregated Statistics For Year 2008 (Based on 8 full and 10 partial tracts)
A) FHA, FSA/RHS & VA Home Purchase Loans
B) Conventional Home Purchase Loans
C) Refinancings
D) Home Improvement Loans
F) Non-occupant Loans on < 5 Family Dwellings (A B C & D)
G) Loans On Manufactured Home Dwelling (A B C & D)
Number
Average Value
Number
Average Value
Number
Average Value
Number
Average Value
Number
Average Value
Number
Average Value
LOANS ORIGINATED
977
$168,971
832
$174,166
1,827
$165,802
133
$63,986
544
$144,990
8
$30,876
APPLICATIONS APPROVED, NOT ACCEPTED
56
$170,413
109
$202,488
343
$149,438
36
$39,634
68
$123,716
2
$44,740
APPLICATIONS DENIED
189
$164,519
232
$171,678
1,991
$170,911
360
$41,730
180
$104,351
20
$63,328
APPLICATIONS WITHDRAWN
188
$165,246
171
$186,991
746
$174,346
24
$93,095
80
$131,206
1
$157,260
FILES CLOSED FOR INCOMPLETENESS
22
$161,818
36
$218,026
158
$179,371
19
$102,263
18
$148,777
0
$0
Aggregated Statistics For Year 2007 (Based on 8 full and 10 partial tracts)
A) FHA, FSA/RHS & VA Home Purchase Loans
B) Conventional Home Purchase Loans
C) Refinancings
D) Home Improvement Loans
E) Loans on Dwellings For 5+ Families
F) Non-occupant Loans on < 5 Family Dwellings (A B C & D)
G) Loans On Manufactured Home Dwelling (A B C & D)
Number
Average Value
Number
Average Value
Number
Average Value
Number
Average Value
Number
Average Value
Number
Average Value
Number
Average Value
LOANS ORIGINATED
390
$175,518
2,467
$168,102
2,530
$154,847
322
$52,598
4
$8,606,700
702
$142,195
13
$32,071
APPLICATIONS APPROVED, NOT ACCEPTED
15
$174,653
299
$159,368
576
$158,621
65
$50,036
0
$0
84
$150,316
14
$66,121
APPLICATIONS DENIED
108
$159,788
672
$175,645
2,926
$173,256
618
$63,141
0
$0
272
$145,958
15
$30,023
APPLICATIONS WITHDRAWN
65
$164,631
487
$184,217
1,262
$173,903
112
$109,910
0
$0
135
$155,569
1
$106,530
FILES CLOSED FOR INCOMPLETENESS
8
$137,059
106
$191,360
352
$185,442
22
$69,648
0
$0
29
$168,628
0
$0
Aggregated Statistics For Year 2006 (Based on 8 full and 10 partial tracts)
A) FHA, FSA/RHS & VA Home Purchase Loans
B) Conventional Home Purchase Loans
C) Refinancings
D) Home Improvement Loans
F) Non-occupant Loans on < 5 Family Dwellings (A B C & D)
G) Loans On Manufactured Home Dwelling (A B C & D)
Number
Average Value
Number
Average Value
Number
Average Value
Number
Average Value
Number
Average Value
Number
Average Value
LOANS ORIGINATED
516
$172,690
5,234
$140,150
3,113
$136,084
418
$46,032
1,474
$128,648
19
$45,073
APPLICATIONS APPROVED, NOT ACCEPTED
21
$166,733
565
$138,026
639
$133,928
125
$51,861
167
$122,280
11
$31,371
APPLICATIONS DENIED
63
$154,784
1,205
$148,855
2,731
$148,096
683
$51,505
342
$133,307
32
$49,394
APPLICATIONS WITHDRAWN
99
$174,686
1,061
$151,707
1,613
$155,112
134
$97,067
257
$183,356
0
$0
FILES CLOSED FOR INCOMPLETENESS
4
$161,312
268
$125,036
474
$161,363
8
$96,941
68
$127,116
0
$0
Aggregated Statistics For Year 2005 (Based on 8 full and 10 partial tracts)
A) FHA, FSA/RHS & VA Home Purchase Loans
B) Conventional Home Purchase Loans
C) Refinancings
D) Home Improvement Loans
F) Non-occupant Loans on < 5 Family Dwellings (A B C & D)
G) Loans On Manufactured Home Dwelling (A B C & D)
Number
Average Value
Number
Average Value
Number
Average Value
Number
Average Value
Number
Average Value
Number
Average Value
LOANS ORIGINATED
581
$161,743
4,648
$122,799
3,389
$136,755
364
$53,992
1,012
$106,834
10
$31,589
APPLICATIONS APPROVED, NOT ACCEPTED
9
$148,121
505
$117,243
601
$141,086
80
$34,056
95
$106,458
38
$26,911
APPLICATIONS DENIED
67
$152,140
1,047
$125,150
2,671
$144,897
546
$45,723
235
$127,409
43
$82,502
APPLICATIONS WITHDRAWN
76
$168,762
626
$135,018
1,517
$148,323
225
$126,598
114
$122,402
0
$0
FILES CLOSED FOR INCOMPLETENESS
7
$124,051
213
$115,943
813
$149,054
31
$79,085
71
$111,503
0
$0
Aggregated Statistics For Year 2004 (Based on 8 full and 10 partial tracts)
A) FHA, FSA/RHS & VA Home Purchase Loans
B) Conventional Home Purchase Loans
C) Refinancings
D) Home Improvement Loans
F) Non-occupant Loans on < 5 Family Dwellings (A B C & D)
G) Loans On Manufactured Home Dwelling (A B C & D)
Number
Average Value
Number
Average Value
Number
Average Value
Number
Average Value
Number
Average Value
Number
Average Value
LOANS ORIGINATED
806
$152,500
3,199
$138,340
3,320
$137,540
313
$50,453
754
$107,816
27
$32,297
APPLICATIONS APPROVED, NOT ACCEPTED
15
$166,185
267
$142,283
598
$131,715
63
$31,491
67
$108,058
14
$34,232
APPLICATIONS DENIED
94
$133,162
670
$135,908
2,237
$135,951
390
$44,350
172
$116,410
41
$44,962
APPLICATIONS WITHDRAWN
88
$160,111
352
$146,688
1,068
$137,763
130
$60,932
73
$119,911
2
$162,560
FILES CLOSED FOR INCOMPLETENESS
3
$240,840
166
$127,510
552
$137,955
47
$55,126
32
$95,031
2
$71,215
Aggregated Statistics For Year 2003 (Based on 8 full and 10 partial tracts)
A) FHA, FSA/RHS & VA Home Purchase Loans
B) Conventional Home Purchase Loans
C) Refinancings
D) Home Improvement Loans
F) Non-occupant Loans on < 5 Family Dwellings (A B C & D)
Number
Average Value
Number
Average Value
Number
Average Value
Number
Average Value
Number
Average Value
LOANS ORIGINATED
945
$140,944
2,154
$144,884
6,343
$132,007
212
$27,401
664
$104,449
APPLICATIONS APPROVED, NOT ACCEPTED
10
$176,324
174
$167,062
696
$128,857
34
$25,360
47
$93,284
APPLICATIONS DENIED
43
$124,619
367
$148,688
1,644
$125,699
227
$27,542
142
$88,353
APPLICATIONS WITHDRAWN
110
$134,762
234
$150,829
908
$124,180
25
$49,019
61
$104,722
FILES CLOSED FOR INCOMPLETENESS
6
$140,443
81
$149,664
333
$135,930
21
$43,241
16
$87,161
Aggregated Statistics For Year 2002 (Based on 6 full and 2 partial tracts)
A) FHA, FSA/RHS & VA Home Purchase Loans
B) Conventional Home Purchase Loans
C) Refinancings
D) Home Improvement Loans
E) Loans on Dwellings For 5+ Families
F) Non-occupant Loans on < 5 Family Dwellings (A B C & D)
Number
Average Value
Number
Average Value
Number
Average Value
Number
Average Value
Number
Average Value
Number
Average Value
LOANS ORIGINATED
516
$131,941
1,303
$152,063
3,351
$129,531
163
$32,605
2
$15,032,305
340
$91,185
APPLICATIONS APPROVED, NOT ACCEPTED
13
$112,536
101
$121,086
446
$112,188
60
$29,272
0
$0
28
$97,485
APPLICATIONS DENIED
40
$119,780
189
$146,280
1,027
$110,768
227
$29,808
0
$0
71
$119,024
APPLICATIONS WITHDRAWN
40
$132,312
120
$142,747
709
$114,584
44
$35,873
0
$0
32
$77,018
FILES CLOSED FOR INCOMPLETENESS
9
$119,807
47
$128,943
304
$119,285
4
$9,945
0
$0
8
$77,878
Aggregated Statistics For Year 2001 (Based on 6 full and 2 partial tracts)
A) FHA, FSA/RHS & VA Home Purchase Loans
B) Conventional Home Purchase Loans
C) Refinancings
D) Home Improvement Loans
F) Non-occupant Loans on < 5 Family Dwellings (A B C & D)
Number
Average Value
Number
Average Value
Number
Average Value
Number
Average Value
Number
Average Value
LOANS ORIGINATED
527
$121,221
1,195
$145,396
2,813
$120,629
171
$22,402
236
$92,900
APPLICATIONS APPROVED, NOT ACCEPTED
3
$105,000
88
$135,702
301
$110,577
48
$31,327
16
$97,085
APPLICATIONS DENIED
22
$122,910
256
$95,151
1,065
$94,405
212
$16,810
38
$74,190
APPLICATIONS WITHDRAWN
36
$112,655
132
$127,466
616
$100,505
57
$18,719
30
$106,848
FILES CLOSED FOR INCOMPLETENESS
5
$145,830
33
$136,477
171
$111,085
10
$45,845
0
$0
Aggregated Statistics For Year 2000 (Based on 6 full and 2 partial tracts)
A) FHA, FSA/RHS & VA Home Purchase Loans
B) Conventional Home Purchase Loans
C) Refinancings
D) Home Improvement Loans
E) Loans on Dwellings For 5+ Families
F) Non-occupant Loans on < 5 Family Dwellings (A B C & D)
Number
Average Value
Number
Average Value
Number
Average Value
Number
Average Value
Number
Average Value
Number
Average Value
LOANS ORIGINATED
483
$114,059
1,129
$131,613
818
$98,335
167
$22,388
0
$0
117
$71,168
APPLICATIONS APPROVED, NOT ACCEPTED
14
$89,794
113
$115,744
205
$93,565
107
$26,562
0
$0
6
$73,240
APPLICATIONS DENIED
65
$104,082
310
$91,902
688
$85,952
260
$20,891
1
$19,020
41
$56,272
APPLICATIONS WITHDRAWN
43
$99,992
163
$121,697
413
$82,544
37
$38,233
0
$0
14
$52,726
FILES CLOSED FOR INCOMPLETENESS
8
$111,599
35
$121,935
207
$96,443
2
$19,885
0
$0
2
$157,085
Aggregated Statistics For Year 1999 (Based on 3 full and 3 partial tracts)
A) FHA, FSA/RHS & VA Home Purchase Loans
B) Conventional Home Purchase Loans
C) Refinancings
D) Home Improvement Loans
F) Non-occupant Loans on < 5 Family Dwellings (A B C & D)
2002 - 2018 National Fire Incident Reporting System (NFIRS) incidents
Based on the data from the years 2002 - 2018 the average number of fires per year is 162. The highest number of reported fire incidents - 298 took place in 2007, and the least - 47 in 2018. The data has a dropping trend.
When looking into fire subcategories, the most reports belonged to: Outside Fires (46.0%), and Structure Fires (33.3%).
Fire incident types reported to NFIRS in Zip Code 30135
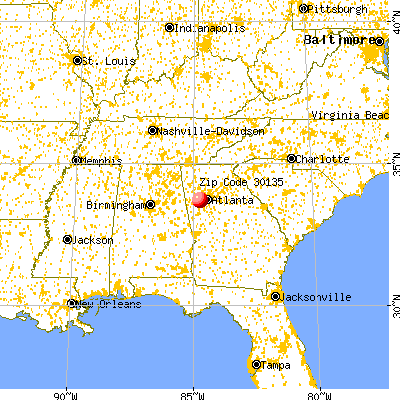


 Nearest zip codes: 30187, 30134, 30268, 30213, 30122, 30336.
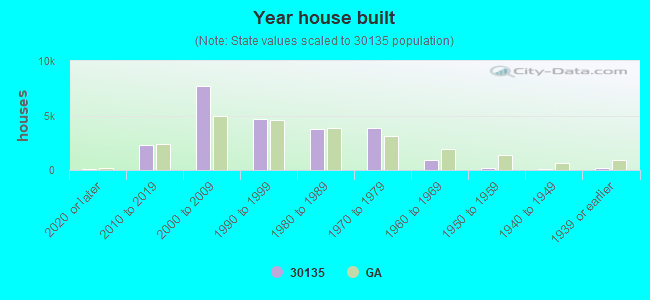


 Based on the data from the years 2002 - 2018 the average number of fires per year is 162. The highest number of reported fire incidents - 298 took place in 2007, and the least - 47 in 2018. The data has a dropping trend.
 When looking into fire subcategories, the most reports belonged to: Outside Fires (46.0%), and Structure Fires (33.3%).