Estimated zip code population in 2022: 17,659
Zip code population in 2010: 16,807
Zip code population in 2000: 9,632
Houses and condos: 6,853
Renter-occupied apartments: 811
% of renters here:
12%State:
34%
March 2022 cost of living index in zip code 30179: 88.6
(less than average, U.S. average is 100)
Land area: 74.8
sq. mi.
Water area: 0.9
sq. mi.
Population density: 236 people per square mile (very low).
OSM Map
General Map
Google Map
MSN Map
OSM Map
General Map
Google Map
MSN Map
OSM Map
General Map
Google Map
MSN Map
OSM Map
General Map
Google Map
MSN Map
Please wait while loading the map...
Real estate property taxes paid for housing units in 2022:
This zip code:
0.7% ($1,620)Georgia:
0.7% ($2,160)
Median real estate property taxes paid for housing units with mortgages in 2022: $1,716 (0.7%)
Median real estate property taxes paid for housing units with no mortgage in 2022: $1,211 (0.6%)
Business Search - 14 Million verified businesses
Males: 8,786 Females: 8,872
For population 25 years and over in 30179:
High school or higher: 84.2%Bachelor's degree or higher: 15.3%Graduate or professional degree: 4.8%Unemployed: 2.3%Mean travel time to work (commute): 36.8 minutes
For population 15 years and over in 30179:
Never married: 28.4%Now married: 52.6%Separated: 1.3%Widowed: 5.5%Divorced: 12.2%
Zip code 30179 compared to state average:
Unemployed percentage below state average. Black race population percentage below state average. Hispanic race population percentage below state average. Foreign-born population percentage significantly below state average. Renting percentage significantly below state average. Length of stay since moving in significantly above state average. House age below state average. Percentage of population with a bachelor's degree or higher below state average. 14,104 79.9% White 2,451 13.9% Black 707 4.0% Hispanic or Latino 341 1.9% Two or more races 53 0.3% Asian
Data:
Median household income ($)
Median household income (% change since 2000)
Household income diversity
Ratio of average income to average house value (%)
Ratio of average income to average rent
Median household income ($) - White
Median household income ($) - Black or African American
Median household income ($) - Asian
Median household income ($) - Hispanic or Latino
Median household income ($) - American Indian and Alaska Native
Median household income ($) - Multirace
Median household income ($) - Other Race
Median household income for houses/condos with a mortgage ($)
Median household income for apartments without a mortgage ($)
Races - White alone (%)
Races - White alone (% change since 2000)
Races - Black alone (%)
Races - Black alone (% change since 2000)
Races - American Indian alone (%)
Races - American Indian alone (% change since 2000)
Races - Asian alone (%)
Races - Asian alone (% change since 2000)
Races - Hispanic (%)
Races - Hispanic (% change since 2000)
Races - Native Hawaiian and Other Pacific Islander alone (%)
Races - Native Hawaiian and Other Pacific Islander alone (% change since 2000)
Races - Two or more races (%)
Races - Two or more races (% change since 2000)
Races - Other race alone (%)
Races - Other race alone (% change since 2000)
Racial diversity
Unemployment (%)
Unemployment (% change since 2000)
Unemployment (%) - White
Unemployment (%) - Black or African American
Unemployment (%) - Asian
Unemployment (%) - Hispanic or Latino
Unemployment (%) - American Indian and Alaska Native
Unemployment (%) - Multirace
Unemployment (%) - Other Race
Population density (people per square mile)
Population - Males (%)
Population - Females (%)
Population - Males (%) - White
Population - Males (%) - Black or African American
Population - Males (%) - Asian
Population - Males (%) - Hispanic or Latino
Population - Males (%) - American Indian and Alaska Native
Population - Males (%) - Multirace
Population - Males (%) - Other Race
Population - Females (%) - White
Population - Females (%) - Black or African American
Population - Females (%) - Asian
Population - Females (%) - Hispanic or Latino
Population - Females (%) - American Indian and Alaska Native
Population - Females (%) - Multirace
Population - Females (%) - Other Race
Coronavirus confirmed cases (May 28, 2024)
Deaths caused by coronavirus (May 28, 2024)
Coronavirus confirmed cases (per 100k population) (May 28, 2024)
Deaths caused by coronavirus (per 100k population) (May 28, 2024)
Daily increase in number of cases (May 28, 2024)
Weekly increase in number of cases (May 28, 2024)
Cases doubled (in days) (May 28, 2024)
Hospitalized patients (Apr 18, 2022)
Negative test results (Apr 18, 2022)
Total test results (Apr 18, 2022)
COVID Vaccine doses distributed (per 100k population) (Sep 19, 2023)
COVID Vaccine doses administered (per 100k population) (Sep 19, 2023)
COVID Vaccine doses distributed (Sep 19, 2023)
COVID Vaccine doses administered (Sep 19, 2023)
Likely homosexual households (%)
Likely homosexual households (% change since 2000)
Likely homosexual households - Lesbian couples (%)
Likely homosexual households - Lesbian couples (% change since 2000)
Likely homosexual households - Gay men (%)
Likely homosexual households - Gay men (% change since 2000)
Cost of living index
Median gross rent ($)
Median contract rent ($)
Median monthly housing costs ($)
Median house or condo value ($)
Median house or condo value ($ change since 2000)
Mean house or condo value by units in structure - 1, detached ($)
Mean house or condo value by units in structure - 1, attached ($)
Mean house or condo value by units in structure - 2 ($)
Mean house or condo value by units in structure by units in structure - 3 or 4 ($)
Mean house or condo value by units in structure - 5 or more ($)
Mean house or condo value by units in structure - Boat, RV, van, etc. ($)
Mean house or condo value by units in structure - Mobile home ($)
Median house or condo value ($) - White
Median house or condo value ($) - Black or African American
Median house or condo value ($) - Asian
Median house or condo value ($) - Hispanic or Latino
Median house or condo value ($) - American Indian and Alaska Native
Median house or condo value ($) - Multirace
Median house or condo value ($) - Other Race
Median resident age
Resident age diversity
Median resident age - Males
Median resident age - Females
Median resident age - White
Median resident age - Black or African American
Median resident age - Asian
Median resident age - Hispanic or Latino
Median resident age - American Indian and Alaska Native
Median resident age - Multirace
Median resident age - Other Race
Median resident age - Males - White
Median resident age - Males - Black or African American
Median resident age - Males - Asian
Median resident age - Males - Hispanic or Latino
Median resident age - Males - American Indian and Alaska Native
Median resident age - Males - Multirace
Median resident age - Males - Other Race
Median resident age - Females - White
Median resident age - Females - Black or African American
Median resident age - Females - Asian
Median resident age - Females - Hispanic or Latino
Median resident age - Females - American Indian and Alaska Native
Median resident age - Females - Multirace
Median resident age - Females - Other Race
Commute - mean travel time to work (minutes)
Travel time to work - Less than 5 minutes (%)
Travel time to work - Less than 5 minutes (% change since 2000)
Travel time to work - 5 to 9 minutes (%)
Travel time to work - 5 to 9 minutes (% change since 2000)
Travel time to work - 10 to 19 minutes (%)
Travel time to work - 10 to 19 minutes (% change since 2000)
Travel time to work - 20 to 29 minutes (%)
Travel time to work - 20 to 29 minutes (% change since 2000)
Travel time to work - 30 to 39 minutes (%)
Travel time to work - 30 to 39 minutes (% change since 2000)
Travel time to work - 40 to 59 minutes (%)
Travel time to work - 40 to 59 minutes (% change since 2000)
Travel time to work - 60 to 89 minutes (%)
Travel time to work - 60 to 89 minutes (% change since 2000)
Travel time to work - 90 or more minutes (%)
Travel time to work - 90 or more minutes (% change since 2000)
Marital status - Never married (%)
Marital status - Now married (%)
Marital status - Separated (%)
Marital status - Widowed (%)
Marital status - Divorced (%)
Median family income ($)
Median family income (% change since 2000)
Median non-family income ($)
Median non-family income (% change since 2000)
Median per capita income ($)
Median per capita income (% change since 2000)
Median family income ($) - White
Median family income ($) - Black or African American
Median family income ($) - Asian
Median family income ($) - Hispanic or Latino
Median family income ($) - American Indian and Alaska Native
Median family income ($) - Multirace
Median family income ($) - Other Race
Median year house/condo built
Median year apartment built
Year house built - Built 2005 or later (%)
Year house built - Built 2000 to 2004 (%)
Year house built - Built 1990 to 1999 (%)
Year house built - Built 1980 to 1989 (%)
Year house built - Built 1970 to 1979 (%)
Year house built - Built 1960 to 1969 (%)
Year house built - Built 1950 to 1959 (%)
Year house built - Built 1940 to 1949 (%)
Year house built - Built 1939 or earlier (%)
Average household size
Household density (households per square mile)
Average household size - White
Average household size - Black or African American
Average household size - Asian
Average household size - Hispanic or Latino
Average household size - American Indian and Alaska Native
Average household size - Multirace
Average household size - Other Race
Occupied housing units (%)
Vacant housing units (%)
Owner occupied housing units (%)
Renter occupied housing units (%)
Vacancy status - For rent (%)
Vacancy status - For sale only (%)
Vacancy status - Rented or sold, not occupied (%)
Vacancy status - For seasonal, recreational, or occasional use (%)
Vacancy status - For migrant workers (%)
Vacancy status - Other vacant (%)
Residents with income below the poverty level (%)
Residents with income below 50% of the poverty level (%)
Children below poverty level (%)
Poor families by family type - Married-couple family (%)
Poor families by family type - Male, no wife present (%)
Poor families by family type - Female, no husband present (%)
Poverty status for native-born residents (%)
Poverty status for foreign-born residents (%)
Poverty among high school graduates not in families (%)
Poverty among people who did not graduate high school not in families (%)
Residents with income below the poverty level (%) - White
Residents with income below the poverty level (%) - Black or African American
Residents with income below the poverty level (%) - Asian
Residents with income below the poverty level (%) - Hispanic or Latino
Residents with income below the poverty level (%) - American Indian and Alaska Native
Residents with income below the poverty level (%) - Multirace
Residents with income below the poverty level (%) - Other Race
Air pollution - Air Quality Index (AQI)
Air pollution - CO
Air pollution - NO2
Air pollution - SO2
Air pollution - Ozone
Air pollution - PM10
Air pollution - PM25
Air pollution - Pb
Crime - Murders per 100,000 population
Crime - Rapes per 100,000 population
Crime - Robberies per 100,000 population
Crime - Assaults per 100,000 population
Crime - Burglaries per 100,000 population
Crime - Thefts per 100,000 population
Crime - Auto thefts per 100,000 population
Crime - Arson per 100,000 population
Crime - City-data.com crime index
Crime - Violent crime index
Crime - Property crime index
Crime - Murders per 100,000 population (5 year average)
Crime - Rapes per 100,000 population (5 year average)
Crime - Robberies per 100,000 population (5 year average)
Crime - Assaults per 100,000 population (5 year average)
Crime - Burglaries per 100,000 population (5 year average)
Crime - Thefts per 100,000 population (5 year average)
Crime - Auto thefts per 100,000 population (5 year average)
Crime - Arson per 100,000 population (5 year average)
Crime - City-data.com crime index (5 year average)
Crime - Violent crime index (5 year average)
Crime - Property crime index (5 year average)
1996 Presidential Elections Results (%) - Democratic Party (Clinton)
1996 Presidential Elections Results (%) - Republican Party (Dole)
1996 Presidential Elections Results (%) - Other
2000 Presidential Elections Results (%) - Democratic Party (Gore)
2000 Presidential Elections Results (%) - Republican Party (Bush)
2000 Presidential Elections Results (%) - Other
2004 Presidential Elections Results (%) - Democratic Party (Kerry)
2004 Presidential Elections Results (%) - Republican Party (Bush)
2004 Presidential Elections Results (%) - Other
2008 Presidential Elections Results (%) - Democratic Party (Obama)
2008 Presidential Elections Results (%) - Republican Party (McCain)
2008 Presidential Elections Results (%) - Other
2012 Presidential Elections Results (%) - Democratic Party (Obama)
2012 Presidential Elections Results (%) - Republican Party (Romney)
2012 Presidential Elections Results (%) - Other
2016 Presidential Elections Results (%) - Democratic Party (Clinton)
2016 Presidential Elections Results (%) - Republican Party (Trump)
2016 Presidential Elections Results (%) - Other
2020 Presidential Elections Results (%) - Democratic Party (Biden)
2020 Presidential Elections Results (%) - Republican Party (Trump)
2020 Presidential Elections Results (%) - Other
Ancestries Reported - Arab (%)
Ancestries Reported - Czech (%)
Ancestries Reported - Danish (%)
Ancestries Reported - Dutch (%)
Ancestries Reported - English (%)
Ancestries Reported - French (%)
Ancestries Reported - French Canadian (%)
Ancestries Reported - German (%)
Ancestries Reported - Greek (%)
Ancestries Reported - Hungarian (%)
Ancestries Reported - Irish (%)
Ancestries Reported - Italian (%)
Ancestries Reported - Lithuanian (%)
Ancestries Reported - Norwegian (%)
Ancestries Reported - Polish (%)
Ancestries Reported - Portuguese (%)
Ancestries Reported - Russian (%)
Ancestries Reported - Scotch-Irish (%)
Ancestries Reported - Scottish (%)
Ancestries Reported - Slovak (%)
Ancestries Reported - Subsaharan African (%)
Ancestries Reported - Swedish (%)
Ancestries Reported - Swiss (%)
Ancestries Reported - Ukrainian (%)
Ancestries Reported - United States (%)
Ancestries Reported - Welsh (%)
Ancestries Reported - West Indian (%)
Ancestries Reported - Other (%)
Educational Attainment - No schooling completed (%)
Educational Attainment - Less than high school (%)
Educational Attainment - High school or equivalent (%)
Educational Attainment - Less than 1 year of college (%)
Educational Attainment - 1 or more years of college (%)
Educational Attainment - Associate degree (%)
Educational Attainment - Bachelor's degree (%)
Educational Attainment - Master's degree (%)
Educational Attainment - Professional school degree (%)
Educational Attainment - Doctorate degree (%)
School Enrollment - Nursery, preschool (%)
School Enrollment - Kindergarten (%)
School Enrollment - Grade 1 to 4 (%)
School Enrollment - Grade 5 to 8 (%)
School Enrollment - Grade 9 to 12 (%)
School Enrollment - College undergrad (%)
School Enrollment - Graduate or professional (%)
School Enrollment - Not enrolled in school (%)
School enrollment - Public schools (%)
School enrollment - Private schools (%)
School enrollment - Not enrolled (%)
Median number of rooms in houses and condos
Median number of rooms in apartments
Housing units lacking complete plumbing facilities (%)
Housing units lacking complete kitchen facilities (%)
Density of houses
Urban houses (%)
Rural houses (%)
Households with people 60 years and over (%)
Households with people 65 years and over (%)
Households with people 75 years and over (%)
Households with one or more nonrelatives (%)
Households with no nonrelatives (%)
Population in households (%)
Family households (%)
Nonfamily households (%)
Population in families (%)
Family households with own children (%)
Median number of bedrooms in owner occupied houses
Mean number of bedrooms in owner occupied houses
Median number of bedrooms in renter occupied houses
Mean number of bedrooms in renter occupied houses
Median number of vehichles in owner occupied houses
Mean number of vehichles in owner occupied houses
Median number of vehichles in renter occupied houses
Mean number of vehichles in renter occupied houses
Mortgage status - with mortgage (%)
Mortgage status - with second mortgage (%)
Mortgage status - with home equity loan (%)
Mortgage status - with both second mortgage and home equity loan (%)
Mortgage status - without a mortgage (%)
Average family size
Average family size - White
Average family size - Black or African American
Average family size - Asian
Average family size - Hispanic or Latino
Average family size - American Indian and Alaska Native
Average family size - Multirace
Average family size - Other Race
Geographical mobility - Same house 1 year ago (%)
Geographical mobility - Moved within same county (%)
Geographical mobility - Moved from different county within same state (%)
Geographical mobility - Moved from different state (%)
Geographical mobility - Moved from abroad (%)
Place of birth - Born in state of residence (%)
Place of birth - Born in other state (%)
Place of birth - Native, outside of US (%)
Place of birth - Foreign born (%)
Housing units in structures - 1, detached (%)
Housing units in structures - 1, attached (%)
Housing units in structures - 2 (%)
Housing units in structures - 3 or 4 (%)
Housing units in structures - 5 to 9 (%)
Housing units in structures - 10 to 19 (%)
Housing units in structures - 20 to 49 (%)
Housing units in structures - 50 or more (%)
Housing units in structures - Mobile home (%)
Housing units in structures - Boat, RV, van, etc. (%)
House/condo owner moved in on average (years ago)
Renter moved in on average (years ago)
Year householder moved into unit - Moved in 1999 to March 2000 (%)
Year householder moved into unit - Moved in 1995 to 1998 (%)
Year householder moved into unit - Moved in 1990 to 1994 (%)
Year householder moved into unit - Moved in 1980 to 1989 (%)
Year householder moved into unit - Moved in 1970 to 1979 (%)
Year householder moved into unit - Moved in 1969 or earlier (%)
Means of transportation to work - Drove car alone (%)
Means of transportation to work - Carpooled (%)
Means of transportation to work - Public transportation (%)
Means of transportation to work - Bus or trolley bus (%)
Means of transportation to work - Streetcar or trolley car (%)
Means of transportation to work - Subway or elevated (%)
Means of transportation to work - Railroad (%)
Means of transportation to work - Ferryboat (%)
Means of transportation to work - Taxicab (%)
Means of transportation to work - Motorcycle (%)
Means of transportation to work - Bicycle (%)
Means of transportation to work - Walked (%)
Means of transportation to work - Other means (%)
Working at home (%)
Industry diversity
Most Common Industries - Agriculture, forestry, fishing and hunting, and mining (%)
Most Common Industries - Agriculture, forestry, fishing and hunting (%)
Most Common Industries - Mining, quarrying, and oil and gas extraction (%)
Most Common Industries - Construction (%)
Most Common Industries - Manufacturing (%)
Most Common Industries - Wholesale trade (%)
Most Common Industries - Retail trade (%)
Most Common Industries - Transportation and warehousing, and utilities (%)
Most Common Industries - Transportation and warehousing (%)
Most Common Industries - Utilities (%)
Most Common Industries - Information (%)
Most Common Industries - Finance and insurance, and real estate and rental and leasing (%)
Most Common Industries - Finance and insurance (%)
Most Common Industries - Real estate and rental and leasing (%)
Most Common Industries - Professional, scientific, and management, and administrative and waste management services (%)
Most Common Industries - Professional, scientific, and technical services (%)
Most Common Industries - Management of companies and enterprises (%)
Most Common Industries - Administrative and support and waste management services (%)
Most Common Industries - Educational services, and health care and social assistance (%)
Most Common Industries - Educational services (%)
Most Common Industries - Health care and social assistance (%)
Most Common Industries - Arts, entertainment, and recreation, and accommodation and food services (%)
Most Common Industries - Arts, entertainment, and recreation (%)
Most Common Industries - Accommodation and food services (%)
Most Common Industries - Other services, except public administration (%)
Most Common Industries - Public administration (%)
Occupation diversity
Most Common Occupations - Management, business, science, and arts occupations (%)
Most Common Occupations - Management, business, and financial occupations (%)
Most Common Occupations - Management occupations (%)
Most Common Occupations - Business and financial operations occupations (%)
Most Common Occupations - Computer, engineering, and science occupations (%)
Most Common Occupations - Computer and mathematical occupations (%)
Most Common Occupations - Architecture and engineering occupations (%)
Most Common Occupations - Life, physical, and social science occupations (%)
Most Common Occupations - Education, legal, community service, arts, and media occupations (%)
Most Common Occupations - Community and social service occupations (%)
Most Common Occupations - Legal occupations (%)
Most Common Occupations - Education, training, and library occupations (%)
Most Common Occupations - Arts, design, entertainment, sports, and media occupations (%)
Most Common Occupations - Healthcare practitioners and technical occupations (%)
Most Common Occupations - Health diagnosing and treating practitioners and other technical occupations (%)
Most Common Occupations - Health technologists and technicians (%)
Most Common Occupations - Service occupations (%)
Most Common Occupations - Healthcare support occupations (%)
Most Common Occupations - Protective service occupations (%)
Most Common Occupations - Fire fighting and prevention, and other protective service workers including supervisors (%)
Most Common Occupations - Law enforcement workers including supervisors (%)
Most Common Occupations - Food preparation and serving related occupations (%)
Most Common Occupations - Building and grounds cleaning and maintenance occupations (%)
Most Common Occupations - Personal care and service occupations (%)
Most Common Occupations - Sales and office occupations (%)
Most Common Occupations - Sales and related occupations (%)
Most Common Occupations - Office and administrative support occupations (%)
Most Common Occupations - Natural resources, construction, and maintenance occupations (%)
Most Common Occupations - Farming, fishing, and forestry occupations (%)
Most Common Occupations - Construction and extraction occupations (%)
Most Common Occupations - Installation, maintenance, and repair occupations (%)
Most Common Occupations - Production, transportation, and material moving occupations (%)
Most Common Occupations - Production occupations (%)
Most Common Occupations - Transportation occupations (%)
Most Common Occupations - Material moving occupations (%)
People in Group quarters - Institutionalized population (%)
People in Group quarters - Correctional institutions (%)
People in Group quarters - Federal prisons and detention centers (%)
People in Group quarters - Halfway houses (%)
People in Group quarters - Local jails and other confinement facilities (including police lockups) (%)
People in Group quarters - Military disciplinary barracks (%)
People in Group quarters - State prisons (%)
People in Group quarters - Other types of correctional institutions (%)
People in Group quarters - Nursing homes (%)
People in Group quarters - Hospitals/wards, hospices, and schools for the handicapped (%)
People in Group quarters - Hospitals/wards and hospices for chronically ill (%)
People in Group quarters - Hospices or homes for chronically ill (%)
People in Group quarters - Military hospitals or wards for chronically ill (%)
People in Group quarters - Other hospitals or wards for chronically ill (%)
People in Group quarters - Hospitals or wards for drug/alcohol abuse (%)
People in Group quarters - Mental (Psychiatric) hospitals or wards (%)
People in Group quarters - Schools, hospitals, or wards for the mentally retarded (%)
People in Group quarters - Schools, hospitals, or wards for the physically handicapped (%)
People in Group quarters - Institutions for the deaf (%)
People in Group quarters - Institutions for the blind (%)
People in Group quarters - Orthopedic wards and institutions for the physically handicapped (%)
People in Group quarters - Wards in general hospitals for patients who have no usual home elsewhere (%)
People in Group quarters - Wards in military hospitals for patients who have no usual home elsewhere (%)
People in Group quarters - Juvenile institutions (%)
People in Group quarters - Long-term care (%)
People in Group quarters - Homes for abused, dependent, and neglected children (%)
People in Group quarters - Residential treatment centers for emotionally disturbed children (%)
People in Group quarters - Training schools for juvenile delinquents (%)
People in Group quarters - Short-term care, detention or diagnostic centers for delinquent children (%)
People in Group quarters - Type of juvenile institution unknown (%)
People in Group quarters - Noninstitutionalized population (%)
People in Group quarters - College dormitories (includes college quarters off campus) (%)
People in Group quarters - Military quarters (%)
People in Group quarters - On base (%)
People in Group quarters - Barracks, unaccompanied personnel housing (UPH), (Enlisted/Officer), ;and similar group living quarters for military personnel (%)
People in Group quarters - Transient quarters for temporary residents (%)
People in Group quarters - Military ships (%)
People in Group quarters - Group homes (%)
People in Group quarters - Homes or halfway houses for drug/alcohol abuse (%)
People in Group quarters - Homes for the mentally ill (%)
People in Group quarters - Homes for the mentally retarded (%)
People in Group quarters - Homes for the physically handicapped (%)
People in Group quarters - Other group homes (%)
People in Group quarters - Religious group quarters (%)
People in Group quarters - Dormitories (%)
People in Group quarters - Agriculture workers' dormitories on farms (%)
People in Group quarters - Job Corps and vocational training facilities (%)
People in Group quarters - Other workers' dormitories (%)
People in Group quarters - Crews of maritime vessels (%)
People in Group quarters - Other nonhousehold living situations (%)
People in Group quarters - Other noninstitutional group quarters (%)
Residents speaking English at home (%)
Residents speaking English at home - Born in the United States (%)
Residents speaking English at home - Native, born elsewhere (%)
Residents speaking English at home - Foreign born (%)
Residents speaking Spanish at home (%)
Residents speaking Spanish at home - Born in the United States (%)
Residents speaking Spanish at home - Native, born elsewhere (%)
Residents speaking Spanish at home - Foreign born (%)
Residents speaking other language at home (%)
Residents speaking other language at home - Born in the United States (%)
Residents speaking other language at home - Native, born elsewhere (%)
Residents speaking other language at home - Foreign born (%)
Class of Workers - Employee of private company (%)
Class of Workers - Self-employed in own incorporated business (%)
Class of Workers - Private not-for-profit wage and salary workers (%)
Class of Workers - Local government workers (%)
Class of Workers - State government workers (%)
Class of Workers - Federal government workers (%)
Class of Workers - Self-employed workers in own not incorporated business and Unpaid family workers (%)
House heating fuel used in houses and condos - Utility gas (%)
House heating fuel used in houses and condos - Bottled, tank, or LP gas (%)
House heating fuel used in houses and condos - Electricity (%)
House heating fuel used in houses and condos - Fuel oil, kerosene, etc. (%)
House heating fuel used in houses and condos - Coal or coke (%)
House heating fuel used in houses and condos - Wood (%)
House heating fuel used in houses and condos - Solar energy (%)
House heating fuel used in houses and condos - Other fuel (%)
House heating fuel used in houses and condos - No fuel used (%)
House heating fuel used in apartments - Utility gas (%)
House heating fuel used in apartments - Bottled, tank, or LP gas (%)
House heating fuel used in apartments - Electricity (%)
House heating fuel used in apartments - Fuel oil, kerosene, etc. (%)
House heating fuel used in apartments - Coal or coke (%)
House heating fuel used in apartments - Wood (%)
House heating fuel used in apartments - Solar energy (%)
House heating fuel used in apartments - Other fuel (%)
House heating fuel used in apartments - No fuel used (%)
Armed forces status - In Armed Forces (%)
Armed forces status - Civilian (%)
Armed forces status - Civilian - Veteran (%)
Armed forces status - Civilian - Nonveteran (%)
Fatal accidents locations in years 2005-2021
Fatal accidents locations in 2005
Fatal accidents locations in 2006
Fatal accidents locations in 2007
Fatal accidents locations in 2008
Fatal accidents locations in 2009
Fatal accidents locations in 2010
Fatal accidents locations in 2011
Fatal accidents locations in 2012
Fatal accidents locations in 2013
Fatal accidents locations in 2014
Fatal accidents locations in 2015
Fatal accidents locations in 2016
Fatal accidents locations in 2017
Fatal accidents locations in 2018
Fatal accidents locations in 2019
Fatal accidents locations in 2020
Fatal accidents locations in 2021
Alcohol use - People drinking some alcohol every month (%)
Alcohol use - People not drinking at all (%)
Alcohol use - Average days/month drinking alcohol
Alcohol use - Average drinks/week
Alcohol use - Average days/year people drink much
Audiometry - Average condition of hearing (%)
Audiometry - People that can hear a whisper from across a quiet room (%)
Audiometry - People that can hear normal voice from across a quiet room (%)
Audiometry - Ears ringing, roaring, buzzing (%)
Audiometry - Had a job exposure to loud noise (%)
Audiometry - Had off-work exposure to loud noise (%)
Blood Pressure & Cholesterol - Has high blood pressure (%)
Blood Pressure & Cholesterol - Checking blood pressure at home (%)
Blood Pressure & Cholesterol - Frequently checking blood cholesterol (%)
Blood Pressure & Cholesterol - Has high cholesterol level (%)
Consumer Behavior - Money monthly spent on food at supermarket/grocery store
Consumer Behavior - Money monthly spent on food at other stores
Consumer Behavior - Money monthly spent on eating out
Consumer Behavior - Money monthly spent on carryout/delivered foods
Consumer Behavior - Income spent on food at supermarket/grocery store (%)
Consumer Behavior - Income spent on food at other stores (%)
Consumer Behavior - Income spent on eating out (%)
Consumer Behavior - Income spent on carryout/delivered foods (%)
Current Health Status - General health condition (%)
Current Health Status - Blood donors (%)
Current Health Status - Has blood ever tested for HIV virus (%)
Current Health Status - Left-handed people (%)
Dermatology - People using sunscreen (%)
Diabetes - Diabetics (%)
Diabetes - Had a blood test for high blood sugar (%)
Diabetes - People taking insulin (%)
Diet Behavior & Nutrition - Diet health (%)
Diet Behavior & Nutrition - Milk product consumption (# of products/month)
Diet Behavior & Nutrition - Meals not home prepared (#/week)
Diet Behavior & Nutrition - Meals from fast food or pizza place (#/week)
Diet Behavior & Nutrition - Ready-to-eat foods (#/month)
Diet Behavior & Nutrition - Frozen meals/pizza (#/month)
Drug Use - People that ever used marijuana or hashish (%)
Drug Use - Ever used hard drugs (%)
Drug Use - Ever used any form of cocaine (%)
Drug Use - Ever used heroin (%)
Drug Use - Ever used methamphetamine (%)
Health Insurance - People covered by health insurance (%)
Kidney Conditions-Urology - Avg. # of times urinating at night
Medical Conditions - People with asthma (%)
Medical Conditions - People with anemia (%)
Medical Conditions - People with psoriasis (%)
Medical Conditions - People with overweight (%)
Medical Conditions - Elderly people having difficulties in thinking or remembering (%)
Medical Conditions - People who ever received blood transfusion (%)
Medical Conditions - People having trouble seeing even with glass/contacts (%)
Medical Conditions - People with arthritis (%)
Medical Conditions - People with gout (%)
Medical Conditions - People with congestive heart failure (%)
Medical Conditions - People with coronary heart disease (%)
Medical Conditions - People with angina pectoris (%)
Medical Conditions - People who ever had heart attack (%)
Medical Conditions - People who ever had stroke (%)
Medical Conditions - People with emphysema (%)
Medical Conditions - People with thyroid problem (%)
Medical Conditions - People with chronic bronchitis (%)
Medical Conditions - People with any liver condition (%)
Medical Conditions - People who ever had cancer or malignancy (%)
Mental Health - People who have little interest in doing things (%)
Mental Health - People feeling down, depressed, or hopeless (%)
Mental Health - People who have trouble sleeping or sleeping too much (%)
Mental Health - People feeling tired or having little energy (%)
Mental Health - People with poor appetite or overeating (%)
Mental Health - People feeling bad about themself (%)
Mental Health - People who have trouble concentrating on things (%)
Mental Health - People moving or speaking slowly or too fast (%)
Mental Health - People having thoughts they would be better off dead (%)
Oral Health - Average years since last visit a dentist
Oral Health - People embarrassed because of mouth (%)
Oral Health - People with gum disease (%)
Oral Health - General health of teeth and gums (%)
Oral Health - Average days a week using dental floss/device
Oral Health - Average days a week using mouthwash for dental problem
Oral Health - Average number of teeth
Pesticide Use - Households using pesticides to control insects (%)
Pesticide Use - Households using pesticides to kill weeds (%)
Physical Activity - People doing vigorous-intensity work activities (%)
Physical Activity - People doing moderate-intensity work activities (%)
Physical Activity - People walking or bicycling (%)
Physical Activity - People doing vigorous-intensity recreational activities (%)
Physical Activity - People doing moderate-intensity recreational activities (%)
Physical Activity - Average hours a day doing sedentary activities
Physical Activity - Average hours a day watching TV or videos
Physical Activity - Average hours a day using computer
Physical Functioning - People having limitations keeping them from working (%)
Physical Functioning - People limited in amount of work they can do (%)
Physical Functioning - People that need special equipment to walk (%)
Physical Functioning - People experiencing confusion/memory problems (%)
Physical Functioning - People requiring special healthcare equipment (%)
Prescription Medications - Average number of prescription medicines taking
Preventive Aspirin Use - Adults 40+ taking low-dose aspirin (%)
Reproductive Health - Vaginal deliveries (%)
Reproductive Health - Cesarean deliveries (%)
Reproductive Health - Deliveries resulted in a live birth (%)
Reproductive Health - Pregnancies resulted in a delivery (%)
Reproductive Health - Women breastfeeding newborns (%)
Reproductive Health - Women that had a hysterectomy (%)
Reproductive Health - Women that had both ovaries removed (%)
Reproductive Health - Women that have ever taken birth control pills (%)
Reproductive Health - Women taking birth control pills (%)
Reproductive Health - Women that have ever used Depo-Provera or injectables (%)
Reproductive Health - Women that have ever used female hormones (%)
Sexual Behavior - People 18+ that ever had sex (vaginal, anal, or oral) (%)
Sexual Behavior - Males 18+ that ever had vaginal sex with a woman (%)
Sexual Behavior - Males 18+ that ever performed oral sex on a woman (%)
Sexual Behavior - Males 18+ that ever had anal sex with a woman (%)
Sexual Behavior - Males 18+ that ever had any sex with a man (%)
Sexual Behavior - Females 18+ that ever had vaginal sex with a man (%)
Sexual Behavior - Females 18+ that ever performed oral sex on a man (%)
Sexual Behavior - Females 18+ that ever had anal sex with a man (%)
Sexual Behavior - Females 18+ that ever had any kind of sex with a woman (%)
Sexual Behavior - Average age people first had sex
Sexual Behavior - Average number of female sex partners in lifetime (males 18+)
Sexual Behavior - Average number of female vaginal sex partners in lifetime (males 18+)
Sexual Behavior - Average age people first performed oral sex on a woman (18+)
Sexual Behavior - Average number of woman performed oral sex on in lifetime (18+)
Sexual Behavior - Average number of male sex partners in lifetime (males 18+)
Sexual Behavior - Average number of male anal sex partners in lifetime (males 18+)
Sexual Behavior - Average age people first performed oral sex on a man (18+)
Sexual Behavior - Average number of male oral sex partners in lifetime (18+)
Sexual Behavior - People using protection when performing oral sex (%)
Sexual Behavior - Average number of times people have vaginal or anal sex a year
Sexual Behavior - People having sex without condom (%)
Sexual Behavior - Average number of male sex partners in lifetime (females 18+)
Sexual Behavior - Average number of male vaginal sex partners in lifetime (females 18+)
Sexual Behavior - Average number of female sex partners in lifetime (females 18+)
Sexual Behavior - Circumcised males 18+ (%)
Sleep Disorders - Average hours sleeping at night
Sleep Disorders - People that has trouble sleeping (%)
Smoking-Cigarette Use - People smoking cigarettes (%)
Taste & Smell - People 40+ having problems with smell (%)
Taste & Smell - People 40+ having problems with taste (%)
Taste & Smell - People 40+ that ever had wisdom teeth removed (%)
Taste & Smell - People 40+ that ever had tonsils teeth removed (%)
Taste & Smell - People 40+ that ever had a loss of consciousness because of a head injury (%)
Taste & Smell - People 40+ that ever had a broken nose or other serious injury to face or skull (%)
Taste & Smell - People 40+ that ever had two or more sinus infections (%)
Weight - Average height (inches)
Weight - Average weight (pounds)
Weight - Average BMI
Weight - People that are obese (%)
Weight - People that ever were obese (%)
Weight - People trying to lose weight (%)
Urban population: 3,384
Rural population: 14,274
Estimated median house/condo value in 2022: $230,155
30179:
$230,155Georgia:
$297,400
Median resident age: This zip code:
39.0 yearsGeorgia median age:
37.6 years
Average household size: This zip code:
2.7 peopleGeorgia:
2.6 people
Averages for the 2020 tax year for zip code 30179, filed in 2021:
Average Adjusted Gross Income (AGI) in 2020: $53,094 (Individual Income Tax Returns) Here:
$53,094State:
$70,847
Salary/wage: $48,605 (reported on 86.1% of returns )Here:
$48,605State:
$59,126
(% of AGI for various income ranges: 1143.6% for AGIs below $25k , 3796.1% for AGIs $25k-50k , 6900.8% for AGIs $50k-75k , 10405.3% for AGIs $75k-100k , 17136.8% for AGIs $100k-200k , 72770.0% for AGIs over 200k ) Taxable interest for individuals: $1,002 (reported on 14.1% of returns )This zip code:
$1,002Georgia:
$2,011
(% of AGI for various income ranges: 10.6% for AGIs below $25k , 9.1% for AGIs $25k-50k , 8.6% for AGIs $50k-75k , 37.7% for AGIs $75k-100k , 34.8% for AGIs $100k-200k , 886.7% for AGIs over 200k ) Ordinary dividends: $2,772 (reported on 7.1% of returns )(% of AGI for various income ranges: 7.6% for AGIs below $25k , 16.4% for AGIs $25k-50k , 16.2% for AGIs $50k-75k , 44.8% for AGIs $75k-100k , 66.6% for AGIs $100k-200k , 1213.3% for AGIs over 200k ) Net capital gain/loss in AGI: +$12,496 (reported on 6.5% of returns )Here:
+$12,496State:
+$28,402
(% of AGI for various income ranges: 1.2% for AGIs below $25k , 11.0% for AGIs $25k-50k , 24.0% for AGIs $50k-75k , 44.4% for AGIs $75k-100k , 220.0% for AGIs $100k-200k , 16266.7% for AGIs over 200k ) Profit/loss from business: +$3,598 (reported on 18.8% of returns )Here:
+$3,598State:
+$6,707
(% of AGI for various income ranges: 111.6% for AGIs below $25k , 42.3% for AGIs $25k-50k , 29.0% for AGIs $50k-75k , 128.2% for AGIs $75k-100k , 137.9% for AGIs $100k-200k , 1790.0% for AGIs over 200k ) Taxable individual retirement arrangement distribution: $14,595 (reported on 4.9% of returns )30179:
$14,595Georgia:
$20,525
(% of AGI for various income ranges: 32.9% for AGIs below $25k , 46.9% for AGIs $25k-50k , 87.5% for AGIs $50k-75k , 182.9% for AGIs $75k-100k , 413.0% for AGIs $100k-200k ) Total itemized deductions: $31,086 (reported on 6.7% of returns )Here:
$31,086State:
$34,001
(% of AGI for various income ranges: 21.3% for AGIs below $25k , 158.4% for AGIs $25k-50k , 250.0% for AGIs $50k-75k , 386.8% for AGIs $75k-100k , 813.2% for AGIs $100k-200k , 14550.0% for AGIs over 200k ) Charity contributions: $11,861 (reported on 5.8% of returns )Here:
$11,861State:
$14,164
(% of AGI for various income ranges: 62.1% for AGIs $25k-50k , 58.6% for AGIs $50k-75k , 103.4% for AGIs $75k-100k , 317.0% for AGIs $100k-200k , 5360.0% for AGIs over 200k ) Taxes paid: $6,410 (reported on 6.2% of returns )(% of AGI for various income ranges: 3.0% for AGIs below $25k , 16.8% for AGIs $25k-50k , 49.7% for AGIs $50k-75k , 95.8% for AGIs $75k-100k , 227.7% for AGIs $100k-200k , 1860.0% for AGIs over 200k ) Earned income credit: $2,406 (reported on 22.8% of returns )(% of AGI for various income ranges: 128.9% for AGIs below $25k , 92.0% for AGIs $25k-50k , 1.8% for AGIs $50k-75k ) Percentage of individuals using paid preparers for their 2020 taxes: 93.6%(% for various income ranges: 93.9% for AGIs below $25k , 93.2% for AGIs $25k-50k , 92.0% for AGIs $50k-75k , 94.4% for AGIs $75k-100k , 95.6% for AGIs $100k-200k , 91.7% for AGIs over 200k )
Averages for the 2012 tax year for zip code 30179, filed in 2013:
Average Adjusted Gross Income (AGI) in 2012: $41,719 (Individual Income Tax Returns) Here:
$41,719State:
$56,131
Salary/wage: $40,067 (reported on 86.1% of returns )Here:
$40,067State:
$47,942
(% of AGI for various income ranges: 74.6% for AGIs below $25k , 86.2% for AGIs $25k-50k , 85.9% for AGIs $50k-75k , 85.7% for AGIs $75k-100k , 81.8% for AGIs $100k-200k , 55.2% for AGIs over 200k ) Taxable interest for individuals: $875 (reported on 16.6% of returns )This zip code:
$875Georgia:
$1,706
(% of AGI for various income ranges: 0.6% for AGIs below $25k , 0.5% for AGIs $25k-50k , 0.2% for AGIs $50k-75k , 0.1% for AGIs $75k-100k , 0.3% for AGIs $100k-200k , 0.8% for AGIs over 200k ) Ordinary dividends: $2,148 (reported on 8.1% of returns )(% of AGI for various income ranges: 0.4% for AGIs below $25k , 0.3% for AGIs $25k-50k , 0.2% for AGIs $50k-75k , 0.2% for AGIs $75k-100k , 1.2% for AGIs $100k-200k ) Net capital gain/loss in AGI: +$3,642 (reported on 5.5% of returns )Here:
+$3,642State:
+$16,323
(% of AGI for various income ranges: 0.2% for AGIs $50k-75k , 2.7% for AGIs $100k-200k ) Profit/loss from business: +$5,145 (reported on 19.1% of returns )Here:
+$5,145State:
+$7,583
(% of AGI for various income ranges: 12.1% for AGIs below $25k , 1.1% for AGIs $25k-50k , 1.4% for AGIs $50k-75k , 0.9% for AGIs $75k-100k , 0.5% for AGIs $100k-200k ) Taxable individual retirement arrangement distribution: $13,400 (reported on 5.5% of returns )30179:
$13,400Georgia:
$17,199
(% of AGI for various income ranges: 2.2% for AGIs below $25k , 1.4% for AGIs $25k-50k , 1.4% for AGIs $50k-75k , 2.2% for AGIs $75k-100k , 2.4% for AGIs $100k-200k ) Total itemized deductions: $18,016 (26% of AGI, reported on 34.0% of returns )Here:
$18,016State:
$23,886
Here:
26.3% of AGIState:
21.5% of AGI
(% of AGI for various income ranges: 8.4% for AGIs below $25k , 14.0% for AGIs $25k-50k , 16.0% for AGIs $50k-75k , 16.1% for AGIs $75k-100k , 16.7% for AGIs $100k-200k , 14.5% for AGIs over 200k ) Charity contributions: $3,568 (reported on 26.9% of returns )(% of AGI for various income ranges: 1.0% for AGIs below $25k , 2.0% for AGIs $25k-50k , 2.4% for AGIs $50k-75k , 2.6% for AGIs $75k-100k , 3.3% for AGIs $100k-200k , 2.3% for AGIs over 200k ) Taxes paid: $4,668 (reported on 33.8% of returns )(% of AGI for various income ranges: 1.1% for AGIs below $25k , 2.7% for AGIs $25k-50k , 3.8% for AGIs $50k-75k , 4.7% for AGIs $75k-100k , 5.9% for AGIs $100k-200k , 5.2% for AGIs over 200k ) Earned income credit: $2,492 (reported on 28.0% of returns )(% of AGI for various income ranges: 10.3% for AGIs below $25k , 1.6% for AGIs $25k-50k ) Percentage of individuals using paid preparers for their 2012 taxes: 54.0%(% for various income ranges: 53.6% for AGIs below $25k , 51.3% for AGIs $25k-50k , 55.9% for AGIs $50k-75k , 54.1% for AGIs $75k-100k , 62.5% for AGIs $100k-200k , 100.0% for AGIs over 200k )
Averages for the 2004 tax year for zip code 30179, filed in 2005:
Average Adjusted Gross Income (AGI) in 2004: $37,067 (Individual Income Tax Returns) Here:
$37,067State:
$47,553
Salary/wage: $36,045 (reported on 87.6% of returns )Here:
$36,045State:
$42,178
(% of AGI for various income ranges: 101.1% for AGIs below $10k , 78.6% for AGIs $10k-25k , 90.0% for AGIs $25k-50k , 90.4% for AGIs $50k-75k , 89.1% for AGIs $75k-100k , 63.3% for AGIs over 100k ) Taxable interest for individuals: $1,097 (reported on 25.1% of returns )This zip code:
$1,097Georgia:
$1,772
(% of AGI for various income ranges: 3.8% for AGIs below $10k , 1.5% for AGIs $10k-25k , 0.5% for AGIs $25k-50k , 0.4% for AGIs $50k-75k , 0.4% for AGIs $75k-100k , 1.2% for AGIs over 100k ) Taxable dividends: $1,489 (reported on 11.1% of returns )(% of AGI for various income ranges: 1.1% for AGIs below $10k , 0.5% for AGIs $10k-25k , 0.2% for AGIs $25k-50k , 0.2% for AGIs $50k-75k , 0.2% for AGIs $75k-100k , 1.6% for AGIs over 100k ) Net capital gain/loss: +$10,102 (reported on 7.1% of returns )Here:
+$10,102State:
+$16,461
(% of AGI for various income ranges: 0.7% for AGIs below $10k , 0.4% for AGIs $10k-25k , 0.1% for AGIs $25k-50k , 0.5% for AGIs $50k-75k , 0.3% for AGIs $75k-100k , 11.8% for AGIs over 100k ) Profit/loss from business: +$4,819 (reported on 18.8% of returns )Here:
+$4,819State:
+$8,201
(% of AGI for various income ranges: 4.6% for AGIs below $10k , 9.6% for AGIs $10k-25k , 1.7% for AGIs $25k-50k , 1.3% for AGIs $50k-75k , 0.8% for AGIs $75k-100k , 2.0% for AGIs over 100k ) IRA payment deduction: $2,810 (reported on 1.5% of returns )30179:
$2,810Georgia:
$2,969
(% of AGI for various income ranges: 0.1% for AGIs $10k-25k , 0.1% for AGIs $25k-50k , 0.1% for AGIs $50k-75k , 0.3% for AGIs $75k-100k ) Total itemized deductions: $16,550 (28% of AGI, reported on 40.1% of returns )Here:
$16,550State:
$19,944
Here:
28.4% of AGIState:
22.6% of AGI
(% of AGI for various income ranges: 12.0% for AGIs below $10k , 12.7% for AGIs $10k-25k , 19.9% for AGIs $25k-50k , 18.3% for AGIs $50k-75k , 18.6% for AGIs $75k-100k , 17.2% for AGIs over 100k ) Charity contributions deductions: $2,862 (5% of AGI, reported on 33.2% of returns )Here:
4.7% of AGIState:
4.7% of AGI
(% of AGI for various income ranges: 0.7% for AGIs below $10k , 1.3% for AGIs $10k-25k , 2.1% for AGIs $25k-50k , 2.6% for AGIs $50k-75k , 3.2% for AGIs $75k-100k , 4.1% for AGIs over 100k ) Total tax: $3,980 (reported on 72.9% of returns )(% of AGI for various income ranges: 4.7% for AGIs below $10k , 4.3% for AGIs $10k-25k , 5.6% for AGIs $25k-50k , 7.5% for AGIs $50k-75k , 9.3% for AGIs $75k-100k , 15.1% for AGIs over 100k ) Earned income credit: $1,905 (reported on 22.5% of returns )Percentage of individuals using paid preparers for their 2004 taxes: 65.5%(% for various income ranges: 57.0% for AGIs below $10k , 68.7% for AGIs $10k-25k , 66.7% for AGIs $25k-50k , 65.8% for AGIs $50k-75k , 67.6% for AGIs $75k-100k , 72.6% for AGIs over 100k )
Estimated median household income in 2022: This zip code:
$76,326Georgia:
$72,837
Nearest zip codes: 30180 ,
30110 ,
30157 ,
30153 ,
30187 ,
30113 .
Percentage of family households: This zip code:
51.0%Georgia:
48.5%
Percentage of households with unmarried partners: This zip code:
9.6%Georgia:
46.9%
No gay or lesbian households reported
Household received Food Stamps/SNAP in the past 12 months: 797Household did not receive Food Stamps/SNAP in the past 12 months: 5,662
Women who had a birth in the past 12 months: 145 (126 now married , 19 unmarried) Women who did not have a birth in the past 12 months: 4,604 (1,994 now married , 2,608 unmarried)
Housing units in zip code 30179 with a mortgage: 3,919 (161
second mortgage , 13
home equity loan , 95
both second mortgage and home equity loan )
Median monthly owner costs for units with a mortgage: $1,357
Median monthly owner costs for units without a mortgage: $421
Residents with income below the poverty level in 2022:
This zip code:
7.6%Whole state:
12.7%
Residents with income below 50% of the poverty level in 2022:
This zip code:
2.6%Whole state:
6.3%
Median number of rooms in houses and condos: Median number of rooms in apartments: Notable locations in this zip code not listed on our city pages
Click to draw/clear zip code borders Notable locations in zip code 30179: (A) , Center Point (B) , Carroll County Fire / Rescue Station 2 (C) , Paulding County Fire and Rescue Bureau Station 4 (D) . Display/hide their locations on the map
Churches in zip code 30179 include: (A) , First Baptist Church of Temple (B) , Draketown Baptist Church (C) , Union Church (D) , Liberty Church (E) , Mount Carmel Church (F) , New Brooklyn Church (G) , Oak Hill Church (H) , Pleasant Grove Church (I) . Display/hide their locations on the map
Cemeteries: (1) , Mount Carmel Cemetery (2) , New Brooklyn Cemetery (3) , Concord Cemetery (4) , Smyrna Cemetery (5) , Union Cemetery (6) , Bethel Cemetery (7) . Display/hide their locations on the map
Reservoirs and swamps: (A) , Lake Violet (B) , Little Tallapoosa Lake (C) , Wiggins Lake (D) , Eulenfield Lake (E) , Muse Lake (F) , Lake Buckhorn (G) , Little Ten Lake (H) . Display/hide their locations on the map
Creeks: (A) , Turkey Creek (B) , Trestle Creek (C) , Crider Creek (D) , Chance Creek (E) , Brooks Creek (F) , Bethel Creek (G) , Mud Creek (H) , Astin Creek (I) . Display/hide their locations on the map
Year house built (houses)
44 2020 or later570 2010 to 20192,644 2000 to 20091,576 1990 to 1999730 1980 to 1989684 1970 to 1979213 1960 to 196944 1950 to 195943 1940 to 1949146 1939 or earlier
Zip code 30179 household income distribution in 2022 273 Less than $10,00042 $10,000 to $14,999207 $15,000 to $19,999487 $20,000 to $24,999129 $25,000 to $29,999326 $30,000 to $34,999277 $35,000 to $39,999112 $40,000 to $44,999182 $45,000 to $49,999466 $50,000 to $59,999660 $60,000 to $74,9991,119 $75,000 to $99,999762 $100,000 to $124,999540 $125,000 to $149,999625 $150,000 to $199,999229 $200,000 or moreEstimate of home value of owner-occupied houses/condos in 2022 in zip code 30179 23 Less than $10,00023 $10,000 to $14,99969 $20,000 to $24,9995 $25,000 to $29,99914 $35,000 to $39,999165 $50,000 to $59,99938 $60,000 to $69,999236 $70,000 to $79,99996 $80,000 to $89,99985 $90,000 to $99,999157 $100,000 to $124,999374 $125,000 to $149,999558 $150,000 to $174,999409 $175,000 to $199,999755 $200,000 to $249,999483 $250,000 to $299,999671 $300,000 to $399,999602 $400,000 to $499,999165 $500,000 to $749,99994 $750,000 to $999,99916 $1,000,000 to $1,499,999Rent paid by renters in 2022 in zip code 30179 22 $350 to $39966 $500 to $54926 $550 to $5998 $650 to $699108 $700 to $74964 $800 to $899182 $900 to $999135 $1,000 to $1,24966 $1,500 to $1,99944 No cash rent
Median gross rent in 2022: $1,136.
Estimated median house (or condo) value in 2022 for: White Non-Hispanic householders: $252,102Black or African American householders: $224,091American Indian or Alaska Native householders: $158,827Asian householders: $274,338Two or more races householders: $235,930Hispanic or Latino householders: $187,705Estimated median house or condo value in 2022: $230,155
30179:
$230,155Georgia:
$297,400
Lower value quartile - upper value quartile: $160,031 - $320,203
Mean price in 2022: Detached houses: $267,501Here:
$267,501State:
$376,364
Townhouses or other attached units: $216,821Here:
$216,821State:
$341,709
Mobile homes: $120,761Here:
$120,761State:
$102,413
Housing units in structures:
One, detached: 5,377One, attached: 2895 to 9: 3420 to 49: 37Mobile homes: 1,103Unemployment : 2.3%
Means of transportation to work in zip code 30179 74.5% 6,641 Drove a car alone10.8% 964 Carpooled0.1% 11 Motorcycle0.2% 20 Walked1.2% 105 Other means12.4% 1,109 Worked at homeTravel time to work (commute) in zip code 30179 203 Less than 5 minutes362 5 to 9 minutes214 10 to 14 minutes1,267 15 to 19 minutes889 20 to 24 minutes330 25 to 29 minutes1,287 30 to 34 minutes208 35 to 39 minutes520 40 to 44 minutes925 45 to 59 minutes906 60 to 89 minutes594 90 or more minutes
Percentage of zip code residents living and working in this county: 45.4%
Household type by relationship:
Households: 17,659
Male householders: 3,791 (911 living alone ), Female householders: 2,652 (396 living alone )3,522 spouses (3,522 opposite-sex spouses ), 464 unmarried partners , (464 opposite-sex unmarried partners ), 4,499 children (4,235 natural , 50 adopted , 212 stepchildren ), 1,065 grandchildren , 199 brothers or sisters , 723 parents , 90 foster children , 431 other relatives , 270 non-relatives In group quarters: 5 (-1 institutionalized population )
Size of family households: 1,959 2-persons , 1,161 3-persons , 753 4-persons , 715 5-persons , 215 6-persons , 42 7-or-more-persons
Size of nonfamily households: 1,321 1-person , 299 2-persons
1,716 married couples with children. single-parent households (277 men , 747 women ).
94.4% of residents of 30179 zip code speak English at home. of residents speak Spanish at home (65% very well, 11% well, 3% not well, 21% not at all ).of residents speak other Indo-European language at home (3% very well, 23% well, 74% not well ).of residents speak Asian or Pacific Island language at home (67% very well, 33% not at all ).
Foreign born population: 641 (3.6%)
(59.2%
of them are naturalized citizens )
This zip code:
3.6%Whole state:
10.7%
30% El Salvador 24% St. Vincent and the Grenadines 10% Iran 10% Dominica 7% Brazil 7% Honduras 6% Sweden 38% American 13% English 11% Irish 3% German 2% French Canadian 2% Trinidadian and Tobagonian 1% European
Year of entry for the foreign-born population
246 2010 or later 148 2000 to 2009 39 1990 to 1999 291 Before 1990
Facilities with environmental interests located in this zip code:
OAK SHADE ROAD ( in TEMPLE, GA)
National Pollutant Discharge Elimination System NON-MAJOR (Tracking pollutant discharge elimination systems) - permit COMMUNITY WATER SYSTEM (SDWIS) - ICIS-04-2005-0765, ENFORCEMENT/COMPLIANCE ACTIVITY Business SIC classification: SEWERAGE SYSTEMSOrganizations: CITY OF TEMPLE (CONTACT/OWNER)
Alternative names: TEMPLE, TEMPLE, CITY OF
QUALITY FURNITURE CO. SOUTHERN FURNITURE MANUFACTURING (DBA) (580 CARROLLTON ST. in TEMPLE, GA)
AIR SYNTHETIC MINOR (AIRS/AFS) (Resource Conservation and Recovery Act (tracking hazardous waste)) TRI REPORTER (Tracking of toxic chemicals releasing facilities) Business SIC classification: WOOD HOUSEHOLD FURNITURE, EXCEPT UPHOLSTEREDOrganizations: MORTENSEN FREDERICK (CONTACT/OWNER)
Alternative names: TEMPLE WOODWORK INC
BAKER REELS (17 SAGE STREET in TEMPLE, GA)
AIR MINOR (AIRS/AFS) Business SIC classification: WOOD PRODUCTS
METRO EMERGENCY SPILL SPECIALIST INC (1130 TEMPLE DRAKETOWN RD in TEMPLE, GA)
TRANSPORTER (Resource Conservation and Recovery Act (tracking hazardous waste)) Organizations: JAMES MYKYTYN (CONTACT/OWNER)
Housing units lacking complete plumbing facilities: 1.3%
Housing units lacking complete kitchen facilities: 0.6%
61.8% Electricity 24.1% Utility gas 11.4% Bottled, tank, or LP gas 2.1% Fuel oil, kerosene, etc.
Population in 1990: 7,111. Population change in the 1990s: +2,521 (+35.5%).
Place of birth for U.S.-born residents:
This state: 11,026Northeast: 1,652Midwest: 996South: 2,606West: 559
57% of the 30179 zip code residents lived in the same house 5 years ago.
Out of people who lived in different houses, 42% lived in this county.
Out of people who lived in different counties, 50% lived in Georgia.
88% of the 30179 zip code residents lived in the same house 1 year ago.
Out of people who lived in different houses, 12% moved from this county.
Out of people who lived in different houses, 60% moved from different county within same state.
Out of people who lived in different houses, 24% moved from different state.
Out of people who lived in different houses, 7% moved from abroad.
Private vs. public school enrollment:
Students in private schools in grades 1 to 8 (elementary and middle school):
Students in private schools in grades 9 to 12 (high school): 33
Students in private undergraduate colleges: 126
Occupation by median earnings in the past 12 months ($)
117,011 Health diagnosing and treating practitioners and other technical occupations 90,838 Fire fighting and prevention, and other protective service workers including supervisors 77,212 Computer and mathematical occupations 69,310 Management occupations 67,617 Business and financial operations occupations 64,781 Legal occupations
Companies with federal contracts located in this zip code:
WOOD, GENE (215 DOE DR in TEMPLE, GA; small business) in 4 contracts from 2003 to 2006
$6,650 with U.S. Army Corps of Engineers - civil program financing only for Recreation Site Maintenance Services (non-construction). Signed on 2004-04-01. Completion date: 2004-09-07.
with Army for Recreation Site Maintenance Services (non-construction). Signed on 2004-04-01. Completion date: 2004-09-07.
, same as above. Signed on 2006-04-17. Completion date: 2006-10-01.
with U.S. Army Corps of Engineers - civil program financing only for Recreation Site Maintenance Services (non-construction). Signed on 2003-04-07. Completion date: 2003-09-01.
Top industries in this zip code by the number of employees in 2005:
Accommodation and Food Services: Limited-Service Restaurants (20-49 employees: 2 establishments, 5-9 employees: 1 establishment)Construction: All Other Specialty Trade Contractors (10-19: 1, 5-9: 1, 1-4: 3)Professional, Scientific, and Technical Services: Engineering Services (10-19: 1, 5-9: 1, 1-4: 1)Other Services (except Public Administration): Religious Organizations (5-9: 2, 1-4: 5)Construction: Siding Contractors (10-19: 1, 5-9: 1)
People in group quarters in 2010:
3 people in group homes intended for adults
Fatal accident statistics in 2014:
Fatal accident count: 7Vehicles involved in fatal accidents: 11Fatal accidents caused by drunken drivers: 3Fatalities: 7Persons involved in fatal accidents: 19Pedestrians involved in fatal accidents: 0
Fatal accident statistics in 2013:
Fatal accident count: 3Vehicles involved in fatal accidents: 3Fatal accidents caused by drunken drivers: 0Fatalities: 3Persons involved in fatal accidents: 3Pedestrians involved in fatal accidents: 0
Home Mortgage Disclosure Act Aggregated Statistics For Year 2009(Based on 8 partial tracts) A) FHA, FSA/RHS & VA B) Conventional C) Refinancings D) Home Improvement Loans E) Loans on Dwellings For 5+ Families F) Non-occupant Loans on G) Loans On Manufactured Number Average Value Number Average Value Number Average Value Number Average Value Number Average Value Number Average Value Number Average Value
LOANS ORIGINATED 221 $102,962 56 $85,876 453 $131,984 36 $10,965 3 $1,537,907 85 $78,323 32 $52,364 APPLICATIONS APPROVED, NOT ACCEPTED 9 $103,449 5 $132,134 45 $149,297 5 $11,642 0 $0 0 $0 2 $23,945 APPLICATIONS DENIED 47 $95,969 17 $61,715 280 $140,816 33 $32,020 0 $0 19 $85,055 19 $37,640 APPLICATIONS WITHDRAWN 34 $121,214 15 $84,955 138 $144,318 5 $39,560 0 $0 9 $64,563 2 $79,295 FILES CLOSED FOR INCOMPLETENESS 8 $137,005 2 $112,465 45 $130,592 4 $74,480 0 $0 2 $81,985 5 $44,522
Aggregated Statistics For Year 2008(Based on 8 partial tracts) A) FHA, FSA/RHS & VA B) Conventional C) Refinancings D) Home Improvement Loans E) Loans on Dwellings For 5+ Families F) Non-occupant Loans on G) Loans On Manufactured Number Average Value Number Average Value Number Average Value Number Average Value Number Average Value Number Average Value Number Average Value
LOANS ORIGINATED 228 $113,459 169 $109,468 387 $139,673 36 $40,815 2 $1,968,805 147 $116,232 40 $102,182 APPLICATIONS APPROVED, NOT ACCEPTED 6 $124,722 17 $90,329 56 $121,519 3 $46,477 2 $76,275 7 $67,236 9 $41,351 APPLICATIONS DENIED 47 $115,690 45 $100,070 442 $130,877 68 $34,263 0 $0 39 $89,502 34 $80,736 APPLICATIONS WITHDRAWN 33 $112,798 29 $124,843 164 $139,187 12 $92,773 0 $0 13 $111,944 11 $70,204 FILES CLOSED FOR INCOMPLETENESS 10 $137,863 14 $131,049 30 $147,276 2 $45,655 0 $0 3 $132,303 2 $84,065
Aggregated Statistics For Year 2007(Based on 8 partial tracts) A) FHA, FSA/RHS & VA B) Conventional C) Refinancings D) Home Improvement Loans E) Loans on Dwellings For 5+ Families F) Non-occupant Loans on G) Loans On Manufactured Number Average Value Number Average Value Number Average Value Number Average Value Number Average Value Number Average Value Number Average Value
LOANS ORIGINATED 119 $125,838 495 $120,998 605 $125,136 104 $37,167 2 $74,765 234 $114,811 56 $71,442 APPLICATIONS APPROVED, NOT ACCEPTED 9 $115,748 37 $115,025 112 $117,076 13 $32,993 0 $0 19 $119,549 9 $63,827 APPLICATIONS DENIED 39 $130,088 192 $110,913 680 $125,007 127 $43,283 0 $0 145 $101,365 40 $70,872 APPLICATIONS WITHDRAWN 10 $116,721 52 $133,503 294 $123,202 21 $69,184 0 $0 22 $106,870 7 $100,239 FILES CLOSED FOR INCOMPLETENESS 1 $218,100 38 $89,602 73 $153,675 4 $47,832 0 $0 11 $80,868 2 $37,760
Aggregated Statistics For Year 2006(Based on 8 partial tracts) A) FHA, FSA/RHS & VA B) Conventional C) Refinancings D) Home Improvement Loans E) Loans on Dwellings For 5+ Families F) Non-occupant Loans on G) Loans On Manufactured Number Average Value Number Average Value Number Average Value Number Average Value Number Average Value Number Average Value Number Average Value
LOANS ORIGINATED 235 $126,294 1,000 $95,103 667 $113,644 107 $36,815 2 $2,731,560 350 $84,574 83 $70,270 APPLICATIONS APPROVED, NOT ACCEPTED 7 $112,404 121 $82,410 153 $111,144 13 $27,468 0 $0 44 $73,452 14 $43,972 APPLICATIONS DENIED 18 $121,521 335 $97,462 637 $116,373 151 $51,524 0 $0 147 $85,313 41 $73,692 APPLICATIONS WITHDRAWN 33 $119,416 149 $96,847 347 $116,422 20 $50,374 0 $0 57 $79,051 12 $98,984 FILES CLOSED FOR INCOMPLETENESS 4 $94,450 28 $96,892 96 $142,143 3 $81,017 0 $0 7 $117,994 0 $0
Aggregated Statistics For Year 2005(Based on 8 partial tracts) A) FHA, FSA/RHS & VA B) Conventional C) Refinancings D) Home Improvement Loans E) Loans on Dwellings For 5+ Families F) Non-occupant Loans on G) Loans On Manufactured Number Average Value Number Average Value Number Average Value Number Average Value Number Average Value Number Average Value Number Average Value
LOANS ORIGINATED 194 $124,166 828 $93,549 732 $111,390 106 $40,501 2 $2,813,875 257 $106,514 56 $125,938 APPLICATIONS APPROVED, NOT ACCEPTED 6 $85,120 72 $93,345 116 $105,847 8 $39,959 0 $0 15 $80,396 16 $75,971 APPLICATIONS DENIED 19 $108,939 211 $89,149 628 $116,222 139 $53,954 0 $0 70 $79,137 39 $51,881 APPLICATIONS WITHDRAWN 17 $124,692 99 $109,777 381 $127,378 51 $110,377 0 $0 35 $112,938 13 $75,736 FILES CLOSED FOR INCOMPLETENESS 3 $121,050 25 $112,806 117 $134,216 7 $37,391 0 $0 5 $105,294 5 $94,732
Aggregated Statistics For Year 2004(Based on 8 partial tracts) A) FHA, FSA/RHS & VA B) Conventional C) Refinancings D) Home Improvement Loans F) Non-occupant Loans on G) Loans On Manufactured Number Average Value Number Average Value Number Average Value Number Average Value Number Average Value Number Average Value
LOANS ORIGINATED 256 $118,712 622 $98,986 726 $112,193 108 $37,384 232 $91,650 85 $64,738 APPLICATIONS APPROVED, NOT ACCEPTED 9 $132,301 53 $101,122 126 $118,370 9 $46,907 5 $180,086 8 $70,221 APPLICATIONS DENIED 17 $115,594 145 $93,956 524 $104,029 123 $41,870 65 $82,341 45 $68,674 APPLICATIONS WITHDRAWN 16 $123,158 46 $91,175 226 $119,759 12 $51,648 11 $108,564 7 $56,587 FILES CLOSED FOR INCOMPLETENESS 0 $0 15 $121,231 81 $123,296 7 $37,361 1 $118,910 1 $57,670
Aggregated Statistics For Year 2003(Based on 8 partial tracts) A) FHA, FSA/RHS & VA B) Conventional C) Refinancings D) Home Improvement Loans E) Loans on Dwellings For 5+ Families F) Non-occupant Loans on Number Average Value Number Average Value Number Average Value Number Average Value Number Average Value Number Average Value
LOANS ORIGINATED 270 $116,808 443 $99,173 1,013 $108,890 60 $39,183 2 $1,361,040 158 $86,860 APPLICATIONS APPROVED, NOT ACCEPTED 6 $86,248 39 $91,767 99 $105,190 3 $19,767 0 $0 16 $77,328 APPLICATIONS DENIED 27 $109,719 67 $94,070 343 $97,766 49 $35,788 0 $0 26 $73,445 APPLICATIONS WITHDRAWN 20 $115,316 41 $119,579 171 $108,482 7 $19,976 0 $0 16 $75,141 FILES CLOSED FOR INCOMPLETENESS 0 $0 11 $135,688 54 $108,774 5 $27,928 0 $0 2 $67,280
Aggregated Statistics For Year 2002(Based on 6 partial tracts) A) FHA, FSA/RHS & VA B) Conventional C) Refinancings D) Home Improvement Loans F) Non-occupant Loans on Number Average Value Number Average Value Number Average Value Number Average Value Number Average Value
LOANS ORIGINATED 300 $111,993 382 $100,991 692 $99,983 73 $30,997 152 $77,272 APPLICATIONS APPROVED, NOT ACCEPTED 5 $107,238 37 $90,928 99 $94,630 12 $14,216 7 $92,824 APPLICATIONS DENIED 26 $110,988 109 $79,193 276 $86,831 38 $28,007 45 $79,259 APPLICATIONS WITHDRAWN 29 $121,277 41 $129,475 166 $98,039 8 $27,016 13 $72,842 FILES CLOSED FOR INCOMPLETENESS 2 $99,820 26 $122,278 66 $109,637 0 $0 9 $88,610
Aggregated Statistics For Year 2001(Based on 6 partial tracts) A) FHA, FSA/RHS & VA B) Conventional C) Refinancings D) Home Improvement Loans F) Non-occupant Loans on Number Average Value Number Average Value Number Average Value Number Average Value Number Average Value
LOANS ORIGINATED 294 $106,075 322 $102,878 599 $96,483 106 $25,637 106 $67,062 APPLICATIONS APPROVED, NOT ACCEPTED 5 $100,904 36 $70,623 67 $93,510 7 $19,696 7 $64,341 APPLICATIONS DENIED 23 $98,103 104 $61,286 344 $70,357 43 $16,646 19 $69,673 APPLICATIONS WITHDRAWN 15 $102,867 34 $85,048 189 $79,829 7 $12,016 9 $66,647 FILES CLOSED FOR INCOMPLETENESS 4 $89,428 7 $84,637 36 $82,864 0 $0 2 $51,355
Aggregated Statistics For Year 2000(Based on 6 partial tracts) A) FHA, FSA/RHS & VA B) Conventional C) Refinancings D) Home Improvement Loans F) Non-occupant Loans on Number Average Value Number Average Value Number Average Value Number Average Value Number Average Value
LOANS ORIGINATED 236 $98,394 275 $87,299 243 $76,502 75 $28,225 68 $67,574 APPLICATIONS APPROVED, NOT ACCEPTED 8 $81,051 42 $58,923 37 $70,044 14 $21,427 2 $84,460 APPLICATIONS DENIED 23 $82,542 122 $58,469 194 $62,768 36 $19,861 7 $38,711 APPLICATIONS WITHDRAWN 11 $85,365 43 $90,427 87 $84,722 3 $29,463 2 $199,030 FILES CLOSED FOR INCOMPLETENESS 2 $88,585 8 $110,888 30 $75,301 2 $106,150 2 $34,820
Aggregated Statistics For Year 1999(Based on 4 partial tracts) A) FHA, FSA/RHS & VA B) Conventional C) Refinancings D) Home Improvement Loans F) Non-occupant Loans on Number Average Value Number Average Value Number Average Value Number Average Value Number Average Value
LOANS ORIGINATED 87 $89,143 104 $75,925 146 $69,822 34 $16,048 21 $52,698 APPLICATIONS APPROVED, NOT ACCEPTED 2 $75,585 21 $47,448 22 $70,393 3 $13,447 3 $62,033 APPLICATIONS DENIED 8 $86,746 54 $54,031 52 $77,246 15 $23,657 1 $45,740 APPLICATIONS WITHDRAWN 3 $84,427 11 $105,653 40 $67,392 3 $27,560 1 $42,860 FILES CLOSED FOR INCOMPLETENESS 1 $73,690 2 $55,140 15 $90,133 0 $0 0 $0
Detailed HMDA statistics for the following Tracts:
1204.00
,
9901.02 ,
9902.00
Private Mortgage Insurance Companies Aggregated Statistics For Year 2009(Based on 8 partial tracts) A) Conventional B) Refinancings Number Average Value Number Average Value
LOANS ORIGINATED 7 $103,294 13 $160,102 APPLICATIONS APPROVED, NOT ACCEPTED 5 $89,434 9 $127,526 APPLICATIONS DENIED 2 $271,870 1 $77,750 APPLICATIONS WITHDRAWN 2 $76,930 1 $66,700 FILES CLOSED FOR INCOMPLETENESS 1 $58,110 2 $54,375
Aggregated Statistics For Year 2008(Based on 8 partial tracts) A) Conventional B) Refinancings C) Non-occupant Loans on Number Average Value Number Average Value Number Average Value
LOANS ORIGINATED 62 $112,282 46 $140,967 21 $92,426 APPLICATIONS APPROVED, NOT ACCEPTED 15 $135,504 27 $143,604 8 $111,231 APPLICATIONS DENIED 4 $184,540 7 $188,833 4 $261,705 APPLICATIONS WITHDRAWN 1 $156,990 1 $241,930 0 $0 FILES CLOSED FOR INCOMPLETENESS 3 $141,807 6 $144,433 1 $117,030
Aggregated Statistics For Year 2007(Based on 8 partial tracts) A) Conventional B) Refinancings C) Non-occupant Loans on D) Loans On Manufactured Number Average Value Number Average Value Number Average Value Number Average Value
LOANS ORIGINATED 219 $134,022 83 $149,179 41 $124,000 2 $37,760 APPLICATIONS APPROVED, NOT ACCEPTED 27 $128,232 13 $154,978 8 $95,246 0 $0 APPLICATIONS DENIED 3 $212,230 3 $132,947 1 $259,210 0 $0 APPLICATIONS WITHDRAWN 16 $165,844 6 $132,887 5 $126,318 0 $0 FILES CLOSED FOR INCOMPLETENESS 0 $0 0 $0 0 $0 0 $0
Aggregated Statistics For Year 2006(Based on 8 partial tracts) A) Conventional B) Refinancings C) Non-occupant Loans on D) Loans On Manufactured Number Average Value Number Average Value Number Average Value Number Average Value
LOANS ORIGINATED 157 $124,805 64 $128,130 29 $113,469 2 $52,110 APPLICATIONS APPROVED, NOT ACCEPTED 17 $130,528 18 $126,193 3 $170,380 0 $0 APPLICATIONS DENIED 2 $88,995 0 $0 2 $61,170 0 $0 APPLICATIONS WITHDRAWN 3 $169,480 3 $126,510 2 $89,870 0 $0 FILES CLOSED FOR INCOMPLETENESS 0 $0 2 $94,400 0 $0 0 $0
Aggregated Statistics For Year 2005(Based on 8 partial tracts) A) Conventional B) Refinancings C) Non-occupant Loans on D) Loans On Manufactured Number Average Value Number Average Value Number Average Value Number Average Value
LOANS ORIGINATED 100 $121,953 79 $136,200 17 $114,095 2 $96,665 APPLICATIONS APPROVED, NOT ACCEPTED 13 $139,744 25 $128,710 4 $93,928 0 $0 APPLICATIONS DENIED 1 $114,990 2 $115,545 0 $0 0 $0 APPLICATIONS WITHDRAWN 3 $154,393 8 $141,441 0 $0 0 $0 FILES CLOSED FOR INCOMPLETENESS 1 $92,890 2 $130,025 0 $0 0 $0
Aggregated Statistics For Year 2004(Based on 8 partial tracts) A) Conventional B) Refinancings C) Non-occupant Loans on D) Loans On Manufactured Number Average Value Number Average Value Number Average Value Number Average Value
LOANS ORIGINATED 87 $120,474 81 $118,141 18 $83,601 5 $91,832 APPLICATIONS APPROVED, NOT ACCEPTED 17 $107,226 23 $145,081 2 $74,960 0 $0 APPLICATIONS DENIED 0 $0 0 $0 0 $0 0 $0 APPLICATIONS WITHDRAWN 5 $149,652 7 $149,109 1 $57,710 0 $0 FILES CLOSED FOR INCOMPLETENESS 2 $70,235 4 $103,798 0 $0 2 $70,235
Aggregated Statistics For Year 2003(Based on 8 partial tracts) A) Conventional B) Refinancings C) Non-occupant Loans on Number Average Value Number Average Value Number Average Value
LOANS ORIGINATED 81 $115,501 148 $113,143 8 $91,048 APPLICATIONS APPROVED, NOT ACCEPTED 13 $117,183 27 $105,579 0 $0 APPLICATIONS DENIED 0 $0 5 $127,518 0 $0 APPLICATIONS WITHDRAWN 4 $107,622 8 $113,012 1 $85,870 FILES CLOSED FOR INCOMPLETENESS 0 $0 2 $84,130 2 $95,475
Aggregated Statistics For Year 2002(Based on 6 partial tracts) A) Conventional B) Refinancings C) Non-occupant Loans on Number Average Value Number Average Value Number Average Value
LOANS ORIGINATED 112 $118,566 124 $110,564 21 $75,147 APPLICATIONS APPROVED, NOT ACCEPTED 9 $136,396 52 $112,007 7 $85,143 APPLICATIONS DENIED 4 $92,052 5 $119,204 4 $117,395 APPLICATIONS WITHDRAWN 3 $109,137 8 $136,636 0 $0 FILES CLOSED FOR INCOMPLETENESS 0 $0 3 $131,713 0 $0
Aggregated Statistics For Year 2001(Based on 6 partial tracts) A) Conventional B) Refinancings C) Non-occupant Loans on Number Average Value Number Average Value Number Average Value
LOANS ORIGINATED 107 $113,411 75 $107,944 8 $82,068 APPLICATIONS APPROVED, NOT ACCEPTED 17 $115,794 15 $117,196 0 $0 APPLICATIONS DENIED 0 $0 2 $110,870 0 $0 APPLICATIONS WITHDRAWN 0 $0 4 $122,552 0 $0 FILES CLOSED FOR INCOMPLETENESS 2 $106,485 0 $0 0 $0
Aggregated Statistics For Year 2000(Based on 6 partial tracts) A) Conventional B) Refinancings C) Non-occupant Loans on Number Average Value Number Average Value Number Average Value
LOANS ORIGINATED 82 $95,275 35 $104,367 7 $76,049 APPLICATIONS APPROVED, NOT ACCEPTED 9 $83,271 3 $160,607 0 $0 APPLICATIONS DENIED 2 $55,650 4 $116,148 0 $0 APPLICATIONS WITHDRAWN 2 $93,725 0 $0 0 $0 FILES CLOSED FOR INCOMPLETENESS 0 $0 0 $0 0 $0
Aggregated Statistics For Year 1999(Based on 4 partial tracts) A) Conventional B) Refinancings C) Non-occupant Loans on Number Average Value Number Average Value Number Average Value
LOANS ORIGINATED 23 $86,333 14 $106,961 1 $54,310 APPLICATIONS APPROVED, NOT ACCEPTED 2 $34,030 1 $94,220 0 $0 APPLICATIONS DENIED 2 $92,650 0 $0 0 $0 APPLICATIONS WITHDRAWN 0 $0 0 $0 0 $0 FILES CLOSED FOR INCOMPLETENESS 0 $0 0 $0 0 $0
Detailed PMIC statistics for the following Tracts:
1204.00
,
9901.02 ,
9902.00
2002 - 2018 National Fire Incident Reporting System (NFIRS) incidents See full 2006 National Fire Incident Reporting System statistics for zip code 30179, Georgia
Most common first names in zip code 30179 among deceased individuals Name Count Lived (average)
James 66 69.5 years William 60 73.2 years Mary 51 76.3 years John 36 71.6 years Robert 34 67.9 years George 25 71.1 years Charles 19 62.5 years Willie 18 77.9 years Thomas 15 75.0 years Joseph 13 63.5 years
Most common last names in zip code 30179 among deceased individuals Last name Count Lived (average)
Smith 24 70.5 years Miller 22 74.1 years Cole 19 73.1 years White 17 72.9 years Jones 14 74.4 years Thomas 14 76.4 years Rutledge 13 72.1 years Davis 13 70.0 years Baxter 13 75.5 years Morris 12 78.2 years
Businesses in zip code 30179
Name Count Name Count
AutoZone 1 McDonald's 1 Dennys 1 Subway 2 FedEx 3 UPS 2 Hardee's 1 Waffle House 1 Lane Furniture 1
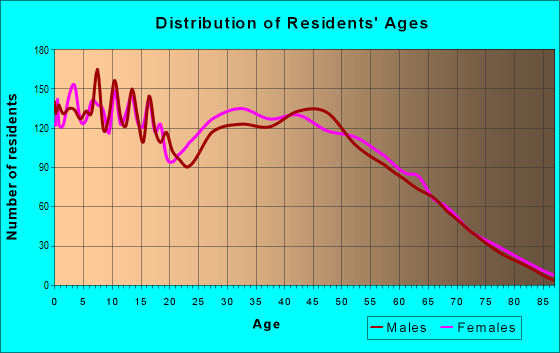
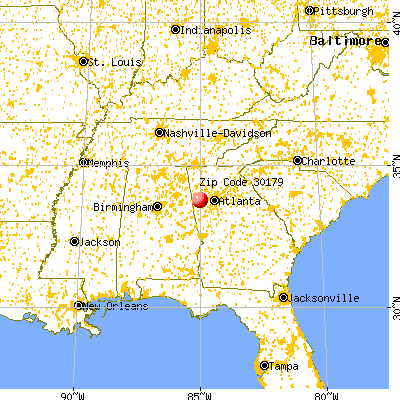


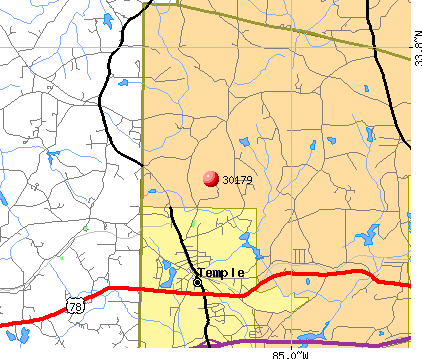 Nearest zip codes: 30180, 30110, 30157, 30153, 30187, 30113.


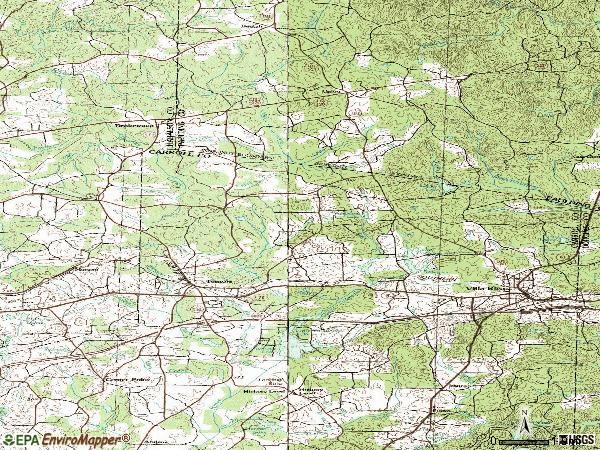


 Based on the data from the years 2002 - 2018 the average number of fire incidents per year is 82. The highest number of fire incidents - 126 took place in 2007, and the least - 4 in 2005. The data has an increasing trend.
 When looking into fire subcategories, the most reports belonged to: Outside Fires (55.4%), and Structure Fires (26.6%).