Estimated zip code population in 2022: 4,924 Zip code population in 2010: 5,533 Zip code population in 2000: 3,116
Houses and condos: 2,109 Renter-occupied apartments: 308
% of renters here:
16%
State:
34%
March 2022 cost of living index in zip code 30220: 89.0 (less than average, U.S. average is 100)
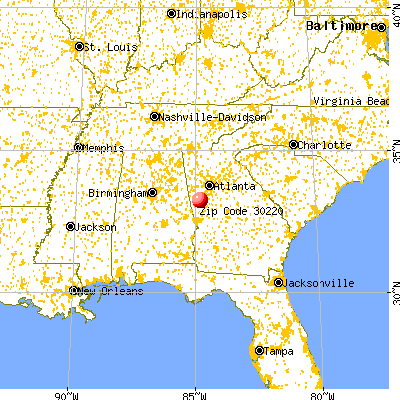
Land area: 54.9 sq. mi. Water area: 0.1 sq. mi.
Population density: 90 people per square mile
(very low).
OSM Map
General Map
Google Map
MSN Map
OSM Map
General Map
Google Map
MSN Map
OSM Map
General Map
Google Map
MSN Map
OSM Map
General Map
Google Map
MSN Map
Please wait while loading the map...
Real estate property taxes paid for housing units in 2022:
This zip code:
0.8% ($1,783)
Georgia:
0.7% ($2,160)
Median real estate property taxes paid for housing units with mortgages in 2022: $1,831 (0.8%) Median real estate property taxes paid for housing units with no mortgage in 2022: $1,692 (0.8%)
Business Search- 14 Million verified businesses
Males: 2,366
(48.0%)
Females: 2,558
(52.0%)
For population 25 years and over in 30220:
High school or higher: 88.9%
Bachelor's degree or higher: 13.9%
Graduate or professional degree: 4.2%
Unemployed: 2.2%
Mean travel time to work (commute): 29.3 minutes
For population 15 years and over in 30220:
Never married: 26.3%
Now married: 51.7%
Separated: 1.9%
Widowed: 6.9%
Divorced: 13.2%
Zip code 30220 compared to state average:
Unemployed percentage below state average.
Hispanic race population percentage significantly below state average.
Foreign-born population percentage significantly below state average.
Renting percentage below state average.
Length of stay since moving in above state average.
Percentage of population with a bachelor's degree or higher significantly below state average.
Averages for the 2020 tax year for zip code 30220, filed in 2021:
Average Adjusted Gross Income (AGI) in 2020: $51,411 (Individual Income Tax Returns)
Here:
$51,411
State:
$70,847
Salary/wage: $47,388 (reported on 88.1% of returns)
Here:
$47,388
State:
$59,126
(% of AGI for various income ranges: 1328.5% for AGIs below $25k, 3799.4% for AGIs $25k-50k, 6615.5% for AGIs $50k-75k, 10945.9% for AGIs $75k-100k, 14877.5% for AGIs $100k-200k)
Taxable interest for individuals: $869 (reported on 13.8% of returns)
This zip code:
$869
Georgia:
$2,011
(% of AGI for various income ranges: 4.4% for AGIs below $25k, 4.7% for AGIs $25k-50k, 4.5% for AGIs $50k-75k, 34.1% for AGIs $75k-100k, 26.9% for AGIs $100k-200k)
Ordinary dividends: $1,915 (reported on 7.7% of returns)
Here:
$1,915
State:
$8,996
(% of AGI for various income ranges: 3.0% for AGIs below $25k, 10.9% for AGIs $25k-50k, 12.1% for AGIs $50k-75k, 15.3% for AGIs $75k-100k, 141.2% for AGIs $100k-200k)
Net capital gain/loss in AGI: +$3,333 (reported on 6.9% of returns)
Here:
+$3,333
State:
+$28,402
(% of AGI for various income ranges: 8.6% for AGIs $25k-50k, 24.5% for AGIs $50k-75k, 37.6% for AGIs $75k-100k, 258.1% for AGIs $100k-200k)
Profit/loss from business: +$167 (reported on 21.1% of returns)
Here:
+$167
State:
+$6,707
(% of AGI for various income ranges: 33.5% for AGIs below $25k, 21.2% for AGIs $75k-100k, 366.2% for AGIs $100k-200k)
Taxable individual retirement arrangement distribution: $20,545 (reported on 4.2% of returns)
30220:
$20,545
Georgia:
$20,525
(% of AGI for various income ranges: 13.9% for AGIs below $25k, 25.2% for AGIs $25k-50k, 190.9% for AGIs $50k-75k, 856.2% for AGIs $100k-200k)
Total itemized deductions: $30,956 (reported on 6.9% of returns)
Here:
$30,956
State:
$34,001
(% of AGI for various income ranges: 156.7% for AGIs $25k-50k, 391.5% for AGIs $50k-75k, 429.4% for AGIs $75k-100k, 1591.9% for AGIs $100k-200k)
Charity contributions: $9,033 (reported on 5.7% of returns)
Here:
$9,033
State:
$14,164
(% of AGI for various income ranges: 31.4% for AGIs $25k-50k, 67.6% for AGIs $50k-75k, 112.4% for AGIs $75k-100k, 462.5% for AGIs $100k-200k)
Taxes paid: $6,859 (reported on 6.5% of returns)
30220:
$6,859
State:
$7,540
(% of AGI for various income ranges: 28.3% for AGIs $25k-50k, 76.1% for AGIs $50k-75k, 109.4% for AGIs $75k-100k, 342.5% for AGIs $100k-200k)
Earned income credit: $2,548 (reported on 24.9% of returns)
Here:
$2,548
State:
$2,530
(% of AGI for various income ranges: 151.3% for AGIs below $25k, 90.9% for AGIs $25k-50k)
Percentage of individuals using paid preparers for their 2020 taxes: 95.0%
Here:
95%
State:
93%
(% for various income ranges: 94.4% for AGIs below $25k, 96.1% for AGIs $25k-50k, 95.2% for AGIs $50k-75k, 92.0% for AGIs $75k-100k, 95.7% for AGIs $100k-200k, 100.0% for AGIs over 200k)
Averages for the 2012 tax year for zip code 30220, filed in 2013:
Average Adjusted Gross Income (AGI) in 2012: $38,362 (Individual Income Tax Returns)
Here:
$38,362
State:
$56,131
Salary/wage: $36,689 (reported on 89.0% of returns)
Here:
$36,689
State:
$47,942
(% of AGI for various income ranges: 82.0% for AGIs below $25k, 90.6% for AGIs $25k-50k, 87.7% for AGIs $50k-75k, 84.5% for AGIs $75k-100k, 77.0% for AGIs $100k-200k)
Taxable interest for individuals: $722 (reported on 14.6% of returns)
This zip code:
$722
Georgia:
$1,706
(% of AGI for various income ranges: 0.5% for AGIs below $25k, 0.4% for AGIs $25k-50k, 0.1% for AGIs $50k-75k, 0.2% for AGIs $100k-200k)
Ordinary dividends: $1,106 (reported on 7.8% of returns)
Here:
$1,106
State:
$7,265
(% of AGI for various income ranges: 0.2% for AGIs below $25k, 0.2% for AGIs $25k-50k, 0.1% for AGIs $50k-75k, 0.5% for AGIs $100k-200k)
Profit/loss from business: +$2,973 (reported on 18.7% of returns)
Here:
+$2,973
State:
+$7,583
(% of AGI for various income ranges: 7.0% for AGIs below $25k, 0.8% for AGIs $50k-75k, 2.1% for AGIs $75k-100k)
Taxable individual retirement arrangement distribution: $13,133 (reported on 5.5% of returns)
30220:
$13,133
Georgia:
$17,199
(% of AGI for various income ranges: 1.3% for AGIs below $25k, 0.9% for AGIs $25k-50k, 2.6% for AGIs $50k-75k, 5.0% for AGIs $75k-100k)
Total itemized deductions: $18,640 (30% of AGI, reported on 33.3% of returns)
Here:
$18,640
State:
$23,886
Here:
29.6% of AGI
State:
21.5% of AGI
(% of AGI for various income ranges: 9.9% for AGIs below $25k, 15.5% for AGIs $25k-50k, 15.6% for AGIs $50k-75k, 17.9% for AGIs $75k-100k, 21.9% for AGIs $100k-200k)
Charity contributions: $3,276 (reported on 26.9% of returns)
Here:
$3,276
State:
$5,507
(% of AGI for various income ranges: 1.2% for AGIs below $25k, 2.4% for AGIs $25k-50k, 2.5% for AGIs $50k-75k, 2.7% for AGIs $75k-100k, 2.5% for AGIs $100k-200k)
Taxes paid: $4,530 (reported on 32.4% of returns)
30220:
$4,530
State:
$7,838
(% of AGI for various income ranges: 1.1% for AGIs below $25k, 2.8% for AGIs $25k-50k, 4.0% for AGIs $50k-75k, 5.3% for AGIs $75k-100k, 6.1% for AGIs $100k-200k)
Earned income credit: $2,719 (reported on 31.5% of returns)
Here:
$2,719
State:
$2,589
(% of AGI for various income ranges: 11.2% for AGIs below $25k, 1.8% for AGIs $25k-50k)
Percentage of individuals using paid preparers for their 2012 taxes: 58.4%
Here:
58%
State:
55%
(% for various income ranges: 59.4% for AGIs below $25k, 53.8% for AGIs $25k-50k, 58.1% for AGIs $50k-75k, 64.7% for AGIs $75k-100k, 70.0% for AGIs $100k-200k)
Averages for the 2004 tax year for zip code 30220, filed in 2005:
Average Adjusted Gross Income (AGI) in 2004: $36,602 (Individual Income Tax Returns)
Here:
$36,602
State:
$47,553
Salary/wage: $33,712 (reported on 92.7% of returns)
Here:
$33,712
State:
$42,178
(% of AGI for various income ranges: 103.1% for AGIs below $10k, 90.6% for AGIs $10k-25k, 92.3% for AGIs $25k-50k, 91.1% for AGIs $50k-75k, 86.3% for AGIs $75k-100k, 59.2% for AGIs over 100k)
Taxable interest for individuals: $683 (reported on 22.8% of returns)
This zip code:
$683
Georgia:
$1,772
(% of AGI for various income ranges: 0.8% for AGIs below $10k, 0.6% for AGIs $10k-25k, 0.3% for AGIs $25k-50k, 0.2% for AGIs $50k-75k, 0.3% for AGIs $75k-100k, 0.8% for AGIs over 100k)
Taxable dividends: $1,028 (reported on 10.0% of returns)
Here:
$1,028
State:
$4,283
(% of AGI for various income ranges: 0.5% for AGIs below $10k, 0.0% for AGIs $10k-25k, 0.1% for AGIs $25k-50k, 0.1% for AGIs $50k-75k, 0.7% for AGIs $75k-100k, 0.7% for AGIs over 100k)
Net capital gain/loss: +$16,149 (reported on 5.6% of returns)
Here:
+$16,149
State:
+$16,461
(% of AGI for various income ranges: -0.5% for AGIs below $10k, -0.1% for AGIs $10k-25k, -0.1% for AGIs $25k-50k, 0.1% for AGIs $50k-75k, 0.0% for AGIs $75k-100k, 14.2% for AGIs over 100k)
Profit/loss from business: +$2,505 (reported on 15.3% of returns)
Here:
+$2,505
State:
+$8,201
(% of AGI for various income ranges: 5.6% for AGIs below $10k, 1.7% for AGIs $10k-25k, 1.1% for AGIs $25k-50k, 1.1% for AGIs $50k-75k, 0.0% for AGIs $75k-100k, 0.6% for AGIs over 100k)
IRA payment deduction: $2,304 (reported on 1.3% of returns)
30220:
$2,304
Georgia:
$2,969
Total itemized deductions: $15,392 (25% of AGI, reported on 36.6% of returns)
Here:
$15,392
State:
$19,944
Here:
24.9% of AGI
State:
22.6% of AGI
(% of AGI for various income ranges: 9.8% for AGIs below $10k, 7.7% for AGIs $10k-25k, 15.1% for AGIs $25k-50k, 19.1% for AGIs $50k-75k, 16.9% for AGIs $75k-100k, 16.4% for AGIs over 100k)
Charity contributions deductions: $2,761 (4% of AGI, reported on 31.8% of returns)
Here:
$2,761
State:
$4,354
Here:
4.4% of AGI
State:
4.7% of AGI
(% of AGI for various income ranges: 1.0% for AGIs below $10k, 1.4% for AGIs $10k-25k, 2.3% for AGIs $25k-50k, 3.1% for AGIs $50k-75k, 2.9% for AGIs $75k-100k, 2.1% for AGIs over 100k)
Total tax: $4,417 (reported on 67.6% of returns)
30220:
$4,417
State:
$8,223
(% of AGI for various income ranges: 3.2% for AGIs below $10k, 2.9% for AGIs $10k-25k, 5.1% for AGIs $25k-50k, 7.8% for AGIs $50k-75k, 9.8% for AGIs $75k-100k, 17.2% for AGIs over 100k)
Earned income credit: $1,893 (reported on 27.7% of returns)
Here:
$1,893
State:
$1,986
Percentage of individuals using paid preparers for their 2004 taxes: 66.7%
Here:
67%
State:
62%
(% for various income ranges: 57.4% for AGIs below $10k, 72.7% for AGIs $10k-25k, 65.2% for AGIs $25k-50k, 66.8% for AGIs $50k-75k, 73.7% for AGIs $75k-100k, 71.7% for AGIs over 100k)
Household received Food Stamps/SNAP in the past 12 months: 181 Household did not receive Food Stamps/SNAP in the past 12 months: 1,709
Women who had a birth in the past 12 months: 94 (82 now married, 12 unmarried) Women who did not have a birth in the past 12 months: 1,120 (390 now married, 731 unmarried)
Housing units in zip code 30220 with a mortgage: 1,028 (48 second mortgage, 37 both second mortgage and home equity loan) Houses without a mortgage: 49
Median monthly owner costs for units with a mortgage: $1,391 Median monthly owner costs for units without a mortgage: $491
Residents with income below the poverty level in 2022:
This zip code:
11.6%
Whole state:
12.7%
Residents with income below 50% of the poverty level in 2022:
This zip code:
7.4%
Whole state:
6.3%
Median number of rooms in houses and condos:
Here:
6.0
State:
6.8
Median number of rooms in apartments:
Here:
6.6
State:
4.6
Notable locations in this zip code not listed on our city pages
Notable locations in zip code 30220: Coweta County Fire Department Station 11 (A), Meriwether County Volunteer Fire Department Station 3 (B). Display/hide their locations on the map
Churches in zip code 30220 include: Macedonia Church (A), Mount Guillard Church (B), Saint Pauls Church (C), Allen-Lee Memorial Church (D). Display/hide their locations on the map
Cemeteries: Lambert Cemetery (1), Prospect Cemetery (2), Bradberry Cemetery (3), Meddas Cemetery (4), Campground Cemetery (5), Grantville City Cemetery (6), Mount Guillard Cemetery (7). Display/hide their locations on the map
Size of family households: 639 2-persons, 276 3-persons, 235 4-persons, 118 5-persons, 48 6-persons, 11 7-or-more-persons
Size of nonfamily households: 452 1-person, 87 2-persons, 25 4-persons
553 married couples with children.
171 single-parent households (8 men, 163 women).
96.4% of residents of 30220 zip code speak English at home.
1.9% of residents speak Spanish at home (100% very well).
0.6% of residents speak other Indo-European language at home (100% very well).
0.5% of residents speak Asian or Pacific Island language at home (70% very well, 30% not well).
Foreign born population: 68 (1.4%) (73.8% of them are naturalized citizens)
This zip code:
1.4%
Whole state:
10.7%
27%Belgium
21%Indonesia
9%Sweden
8%United Kingdom, excluding England and Scotland
8%Laos
8%Honduras
6%Malaysia
23%American
16%English
6%German
3%Irish
2%French Canadian
2%Scottish
2%Norwegian
Year of entry for the foreign-born population
02010 or later
172000 to 2009
01990 to 1999
52Before 1990
Facilities with environmental interests located in this zip code:
BST GTVLGAMA R3259 (10 WEST BROAD ST in GRANTVILLE, GA)
(Resource Conservation and Recovery Act (tracking hazardous waste)) Organizations: BELL SOUTH (CONTACT/OPERATOR)
Housing units lacking complete plumbing facilities: 2.4% Housing units lacking complete kitchen facilities: 2.1%
56.2%Electricity
28.6%Utility gas
12.3%Bottled, tank, or LP gas
1.4%Wood
0.9%Other fuel
Population in 1990: 1,825. Population change in the 1990s: +1,291 (+70.7%).
Place of birth for U.S.-born residents:
This state: 3,493
Northeast: 131
Midwest: 186
South: 765
West: 245
66% of the 30220 zip code residents lived in the same house 5 years ago. Out of people who lived in different houses, 46% lived in this county. Out of people who lived in different counties, 50% lived in Georgia.
92% of the 30220 zip code residents lived in the same house 1 year ago. Out of people who lived in different houses, 44% moved from this county. Out of people who lived in different houses, 42% moved from different county within same state. Out of people who lived in different houses, 13% moved from different state.
Private vs. public school enrollment:
Students in private schools in grades 1 to 8 (elementary and middle school): 23
Here:
4.9%
Georgia:
12.1%
Students in private schools in grades 9 to 12 (high school): 15
Here:
6.2%
Georgia:
10.8%
Students in private undergraduate colleges: 67
Here:
39.3%
Georgia:
17.1%
Occupation by median earnings in the past 12 months ($)
73,149Law enforcement workers including supervisors
66,373Computer and mathematical occupations
63,383Health diagnosing and treating practitioners and other technical occupations
55,428Management occupations
50,160Installation, maintenance, and repair occupations
49,883Business and financial operations occupations
Top industries in this zip code by the number of employees in 2005:
Administrative and Support and Waste Management and Remediation Services: Landscaping Services (20-49 employees: 1 establishment, 5-9 employees: 1 establishment, 1-4 employees: 2 establishments)
Construction: New Single-Family Housing Construction (except Operative Builders) (5-9: 2, 1-4: 1)
Construction: Commercial and Institutional Building Construction (10-19: 1)
Construction: Plumbing, Heating, and Air-Conditioning Contractors (5-9: 1, 1-4: 1)
Fatal accident statistics in 2014:
Fatal accident count: 2
Vehicles involved in fatal accidents: 3
Fatal accidents caused by drunken drivers: 1
Fatalities: 2
Persons involved in fatal accidents: 6
Pedestrians involved in fatal accidents: 0
Fatal accident statistics in 2013:
Fatal accident count: 2
Vehicles involved in fatal accidents: 3
Fatal accidents caused by drunken drivers: 0
Fatalities: 2
Persons involved in fatal accidents: 10
Pedestrians involved in fatal accidents: 0
Home Mortgage Disclosure Act Aggregated Statistics For Year 2009 (Based on 2 partial tracts)
A) FHA, FSA/RHS & VA Home Purchase Loans
B) Conventional Home Purchase Loans
C) Refinancings
D) Home Improvement Loans
F) Non-occupant Loans on < 5 Family Dwellings (A B C & D)
G) Loans On Manufactured Home Dwelling (A B C & D)
Number
Average Value
Number
Average Value
Number
Average Value
Number
Average Value
Number
Average Value
Number
Average Value
LOANS ORIGINATED
33
$131,875
18
$144,210
105
$166,834
5
$35,640
16
$110,126
2
$100,440
APPLICATIONS APPROVED, NOT ACCEPTED
1
$77,220
0
$0
6
$136,440
1
$13,500
0
$0
1
$27,000
APPLICATIONS DENIED
2
$115,290
5
$111,240
62
$171,520
3
$15,660
5
$75,060
3
$75,780
APPLICATIONS WITHDRAWN
7
$161,074
8
$143,708
39
$171,360
1
$170,100
2
$145,800
1
$37,260
FILES CLOSED FOR INCOMPLETENESS
2
$106,920
0
$0
12
$170,550
0
$0
1
$60,480
0
$0
Aggregated Statistics For Year 2008 (Based on 2 partial tracts)
A) FHA, FSA/RHS & VA Home Purchase Loans
B) Conventional Home Purchase Loans
C) Refinancings
D) Home Improvement Loans
F) Non-occupant Loans on < 5 Family Dwellings (A B C & D)
G) Loans On Manufactured Home Dwelling (A B C & D)
Number
Average Value
Number
Average Value
Number
Average Value
Number
Average Value
Number
Average Value
Number
Average Value
LOANS ORIGINATED
39
$134,363
33
$162,131
79
$159,751
8
$64,530
28
$101,790
4
$81,000
APPLICATIONS APPROVED, NOT ACCEPTED
1
$112,860
5
$68,688
14
$135,887
1
$9,720
4
$60,210
1
$108,000
APPLICATIONS DENIED
6
$166,590
9
$127,860
68
$152,939
7
$34,251
2
$113,130
4
$90,855
APPLICATIONS WITHDRAWN
6
$133,830
4
$190,215
28
$161,171
2
$20,250
2
$159,570
1
$16,200
FILES CLOSED FOR INCOMPLETENESS
3
$129,240
2
$112,860
8
$183,802
1
$69,660
0
$0
0
$0
Aggregated Statistics For Year 2007 (Based on 2 partial tracts)
A) FHA, FSA/RHS & VA Home Purchase Loans
B) Conventional Home Purchase Loans
C) Refinancings
D) Home Improvement Loans
F) Non-occupant Loans on < 5 Family Dwellings (A B C & D)
G) Loans On Manufactured Home Dwelling (A B C & D)
Number
Average Value
Number
Average Value
Number
Average Value
Number
Average Value
Number
Average Value
Number
Average Value
LOANS ORIGINATED
21
$137,751
113
$141,599
117
$149,723
20
$53,109
28
$99,032
7
$67,731
APPLICATIONS APPROVED, NOT ACCEPTED
2
$178,740
11
$151,200
23
$126,736
3
$86,220
3
$108,720
1
$137,700
APPLICATIONS DENIED
5
$152,820
22
$175,058
104
$141,594
24
$63,765
5
$111,564
1
$34,020
APPLICATIONS WITHDRAWN
3
$99,000
11
$173,585
45
$146,340
4
$76,275
5
$155,628
0
$0
FILES CLOSED FOR INCOMPLETENESS
1
$77,220
5
$183,276
14
$153,129
1
$19,440
2
$34,020
0
$0
Aggregated Statistics For Year 2006 (Based on 2 partial tracts)
A) FHA, FSA/RHS & VA Home Purchase Loans
B) Conventional Home Purchase Loans
C) Refinancings
D) Home Improvement Loans
F) Non-occupant Loans on < 5 Family Dwellings (A B C & D)
G) Loans On Manufactured Home Dwelling (A B C & D)
Number
Average Value
Number
Average Value
Number
Average Value
Number
Average Value
Number
Average Value
Number
Average Value
LOANS ORIGINATED
21
$132,686
151
$126,499
150
$131,879
21
$49,706
39
$110,257
4
$133,110
APPLICATIONS APPROVED, NOT ACCEPTED
2
$93,690
17
$98,280
24
$132,480
4
$97,875
4
$101,520
0
$0
APPLICATIONS DENIED
3
$131,940
28
$117,276
123
$127,760
30
$40,428
11
$160,085
4
$66,420
APPLICATIONS WITHDRAWN
4
$106,110
22
$106,355
81
$134,267
2
$42,930
4
$87,210
1
$43,200
FILES CLOSED FOR INCOMPLETENESS
1
$127,980
7
$156,214
21
$145,286
0
$0
1
$63,720
1
$76,680
Aggregated Statistics For Year 2005 (Based on 2 partial tracts)
A) FHA, FSA/RHS & VA Home Purchase Loans
B) Conventional Home Purchase Loans
C) Refinancings
D) Home Improvement Loans
F) Non-occupant Loans on < 5 Family Dwellings (A B C & D)
G) Loans On Manufactured Home Dwelling (A B C & D)
Number
Average Value
Number
Average Value
Number
Average Value
Number
Average Value
Number
Average Value
Number
Average Value
LOANS ORIGINATED
28
$125,126
151
$124,157
138
$151,576
18
$54,570
35
$103,942
3
$53,100
APPLICATIONS APPROVED, NOT ACCEPTED
1
$63,180
11
$108,835
20
$131,544
2
$30,780
2
$79,920
1
$37,800
APPLICATIONS DENIED
2
$111,510
35
$93,003
132
$127,256
17
$36,434
7
$100,209
5
$86,940
APPLICATIONS WITHDRAWN
2
$149,580
19
$134,375
57
$148,197
12
$136,485
4
$137,700
1
$54,000
FILES CLOSED FOR INCOMPLETENESS
0
$0
8
$79,178
34
$144,116
1
$85,320
1
$85,860
1
$37,800
Aggregated Statistics For Year 2004 (Based on 2 partial tracts)
A) FHA, FSA/RHS & VA Home Purchase Loans
B) Conventional Home Purchase Loans
C) Refinancings
D) Home Improvement Loans
F) Non-occupant Loans on < 5 Family Dwellings (A B C & D)
G) Loans On Manufactured Home Dwelling (A B C & D)
Number
Average Value
Number
Average Value
Number
Average Value
Number
Average Value
Number
Average Value
Number
Average Value
LOANS ORIGINATED
40
$118,989
109
$129,565
163
$133,463
16
$48,195
36
$99,735
4
$62,910
APPLICATIONS APPROVED, NOT ACCEPTED
2
$98,550
7
$161,151
21
$127,620
3
$25,020
0
$0
1
$59,400
APPLICATIONS DENIED
5
$109,188
15
$143,712
93
$106,305
22
$31,271
4
$168,210
4
$62,100
APPLICATIONS WITHDRAWN
4
$128,385
8
$191,228
52
$129,891
7
$32,786
3
$113,400
2
$78,030
FILES CLOSED FOR INCOMPLETENESS
1
$57,780
4
$148,230
19
$128,378
2
$25,650
1
$121,500
1
$79,920
Aggregated Statistics For Year 2003 (Based on 2 partial tracts)
A) FHA, FSA/RHS & VA Home Purchase Loans
B) Conventional Home Purchase Loans
C) Refinancings
D) Home Improvement Loans
F) Non-occupant Loans on < 5 Family Dwellings (A B C & D)
Number
Average Value
Number
Average Value
Number
Average Value
Number
Average Value
Number
Average Value
LOANS ORIGINATED
53
$111,800
69
$125,726
242
$123,780
9
$25,380
34
$86,051
APPLICATIONS APPROVED, NOT ACCEPTED
1
$111,780
4
$98,550
18
$114,840
1
$8,640
1
$69,660
APPLICATIONS DENIED
8
$115,290
15
$137,016
82
$117,101
9
$30,000
4
$148,365
APPLICATIONS WITHDRAWN
3
$99,720
10
$128,574
39
$129,074
4
$29,565
3
$108,360
FILES CLOSED FOR INCOMPLETENESS
1
$52,920
2
$144,720
9
$83,700
0
$0
1
$25,380
Aggregated Statistics For Year 2002 (Based on 2 partial tracts)
A) FHA, FSA/RHS & VA Home Purchase Loans
B) Conventional Home Purchase Loans
C) Refinancings
D) Home Improvement Loans
F) Non-occupant Loans on < 5 Family Dwellings (A B C & D)
Number
Average Value
Number
Average Value
Number
Average Value
Number
Average Value
Number
Average Value
LOANS ORIGINATED
50
$105,289
66
$105,038
170
$126,214
14
$37,144
30
$75,996
APPLICATIONS APPROVED, NOT ACCEPTED
1
$135,540
4
$80,190
24
$79,492
1
$34,020
1
$20,520
APPLICATIONS DENIED
4
$105,975
14
$82,736
65
$90,753
11
$47,618
4
$62,505
APPLICATIONS WITHDRAWN
4
$96,795
9
$109,140
41
$122,211
2
$23,760
2
$68,310
FILES CLOSED FOR INCOMPLETENESS
1
$107,460
1
$144,720
13
$86,400
1
$5,400
0
$0
Aggregated Statistics For Year 2001 (Based on 2 partial tracts)
A) FHA, FSA/RHS & VA Home Purchase Loans
B) Conventional Home Purchase Loans
C) Refinancings
D) Home Improvement Loans
E) Loans on Dwellings For 5+ Families
F) Non-occupant Loans on < 5 Family Dwellings (A B C & D)
Number
Average Value
Number
Average Value
Number
Average Value
Number
Average Value
Number
Average Value
Number
Average Value
LOANS ORIGINATED
35
$101,088
50
$97,729
166
$112,356
15
$25,236
1
$243,000
13
$52,505
APPLICATIONS APPROVED, NOT ACCEPTED
1
$58,320
6
$73,530
16
$104,220
4
$24,300
0
$0
1
$99,360
APPLICATIONS DENIED
1
$116,640
17
$105,522
70
$79,241
6
$18,360
0
$0
4
$87,750
APPLICATIONS WITHDRAWN
2
$87,480
11
$129,796
47
$105,357
1
$7,020
0
$0
0
$0
FILES CLOSED FOR INCOMPLETENESS
1
$53,460
1
$77,760
8
$95,782
0
$0
0
$0
0
$0
Aggregated Statistics For Year 2000 (Based on 2 partial tracts)
A) FHA, FSA/RHS & VA Home Purchase Loans
B) Conventional Home Purchase Loans
C) Refinancings
D) Home Improvement Loans
F) Non-occupant Loans on < 5 Family Dwellings (A B C & D)
Number
Average Value
Number
Average Value
Number
Average Value
Number
Average Value
Number
Average Value
LOANS ORIGINATED
32
$95,445
46
$104,678
65
$95,223
18
$19,710
11
$47,225
APPLICATIONS APPROVED, NOT ACCEPTED
1
$78,840
7
$88,329
13
$81,415
3
$29,340
2
$38,610
APPLICATIONS DENIED
4
$95,715
16
$73,271
41
$75,179
12
$17,280
4
$78,435
APPLICATIONS WITHDRAWN
1
$157,680
4
$76,410
25
$88,884
2
$81,540
1
$78,300
FILES CLOSED FOR INCOMPLETENESS
2
$86,400
3
$125,640
9
$89,760
1
$29,160
1
$32,400
Aggregated Statistics For Year 1999 (Based on 1 partial tract)
A) FHA, FSA/RHS & VA Home Purchase Loans
B) Conventional Home Purchase Loans
C) Refinancings
D) Home Improvement Loans
F) Non-occupant Loans on < 5 Family Dwellings (A B C & D)
Detailed PMIC statistics for the following Tracts:1708.00
2005 - 2018 National Fire Incident Reporting System (NFIRS) incidents
Based on the data from the years 2005 - 2018 the average number of fire incidents per year is 19. The highest number of reported fires - 45 took place in 2010, and the least - 4 in 2006. The data has a rising trend.
When looking into fire subcategories, the most reports belonged to: Outside Fires (52.6%), and Structure Fires (30.6%).
Fire incident types reported to NFIRS in Zip Code 30220


 Nearest zip codes: 30259, 30230, 30251, 30263, 30222, 30289.


 Based on the data from the years 2005 - 2018 the average number of fire incidents per year is 19. The highest number of reported fires - 45 took place in 2010, and the least - 4 in 2006. The data has a rising trend.
 When looking into fire subcategories, the most reports belonged to: Outside Fires (52.6%), and Structure Fires (30.6%).