Estimated zip code population in 2022: 6,121 Zip code population in 2010: 5,943 Zip code population in 2000: 4,495
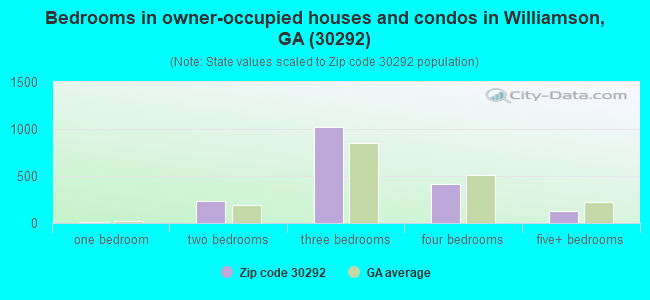
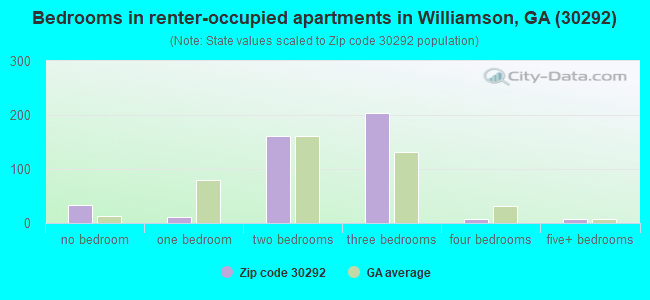
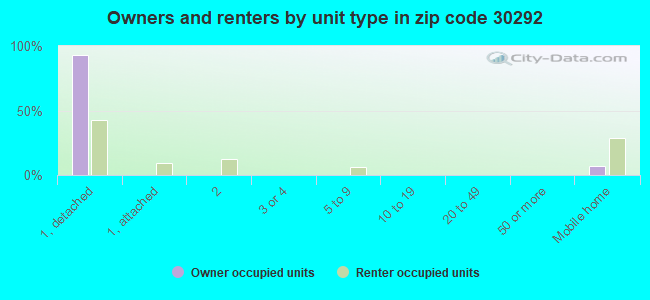
Houses and condos: 2,409 Renter-occupied apartments: 421
% of renters here:
19%
State:
34%
March 2022 cost of living index in zip code 30292: 81.2 (low, U.S. average is 100)
Land area: 58.2 sq. mi. Water area: 0.8 sq. mi.
Population density: 105 people per square mile
(very low).
OSM Map
General Map
Google Map
MSN Map
OSM Map
General Map
Google Map
MSN Map
OSM Map
General Map
Google Map
MSN Map
OSM Map
General Map
Google Map
MSN Map
Please wait while loading the map...
Real estate property taxes paid for housing units in 2022:
This zip code:
0.8% ($2,351)
Georgia:
0.7% ($2,160)
Median real estate property taxes paid for housing units with mortgages in 2022: $2,486 (0.7%) Median real estate property taxes paid for housing units with no mortgage in 2022: $2,049 (1.0%)
Estimated median house/condo value in 2022: $281,194
30292:
$281,194
Georgia:
$297,400
According to our research of Georgia and other state lists, there were 9 registered sex offenders living in 30292 zip code as of May 28, 2024. The ratio of all residents to sex offenders in zip code 30292 is 738 to 1. The ratio of registered sex offenders to all residents in this zip code is lower than the state average.
Median resident age:
This zip code:
38.9 years
Georgia median age:
37.6 years
Average household size:
This zip code:
2.7 people
Georgia:
2.6 people
Averages for the 2020 tax year for zip code 30292, filed in 2021:
Average Adjusted Gross Income (AGI) in 2020: $67,227 (Individual Income Tax Returns)
Here:
$67,227
State:
$70,847
Salary/wage: $58,651 (reported on 82.2% of returns)
Here:
$58,651
State:
$59,126
(% of AGI for various income ranges: 1220.9% for AGIs below $25k, 3915.3% for AGIs $25k-50k, 7193.7% for AGIs $50k-75k, 9413.5% for AGIs $75k-100k, 19557.5% for AGIs $100k-200k, 52425.0% for AGIs over 200k)
Taxable interest for individuals: $901 (reported on 23.5% of returns)
This zip code:
$901
Georgia:
$2,011
(% of AGI for various income ranges: 6.0% for AGIs below $25k, 17.8% for AGIs $25k-50k, 25.6% for AGIs $50k-75k, 24.0% for AGIs $75k-100k, 91.4% for AGIs $100k-200k, 300.0% for AGIs over 200k)
Ordinary dividends: $3,140 (reported on 13.4% of returns)
Here:
$3,140
State:
$8,996
(% of AGI for various income ranges: 7.8% for AGIs below $25k, 18.5% for AGIs $25k-50k, 35.9% for AGIs $50k-75k, 159.0% for AGIs $75k-100k, 138.2% for AGIs $100k-200k, 750.0% for AGIs over 200k)
Net capital gain/loss in AGI: +$19,000 (reported on 12.8% of returns)
Here:
+$19,000
State:
+$28,402
(% of AGI for various income ranges: 2.2% for AGIs below $25k, 9.3% for AGIs $25k-50k, 33.7% for AGIs $50k-75k, 92.0% for AGIs $75k-100k, 631.8% for AGIs $100k-200k, 12775.0% for AGIs over 200k)
Profit/loss from business: +$5,174 (reported on 19.1% of returns)
Here:
+$5,174
State:
+$6,707
(% of AGI for various income ranges: 39.9% for AGIs below $25k, 44.7% for AGIs $25k-50k, 231.1% for AGIs $50k-75k, 192.0% for AGIs $75k-100k, 426.8% for AGIs $100k-200k, 582.5% for AGIs over 200k)
Taxable individual retirement arrangement distribution: $14,673 (reported on 7.4% of returns)
30292:
$14,673
Georgia:
$20,525
(% of AGI for various income ranges: 43.6% for AGIs below $25k, 81.8% for AGIs $25k-50k, 198.5% for AGIs $50k-75k, 237.5% for AGIs $75k-100k, 526.8% for AGIs $100k-200k)
Total itemized deductions: $30,782 (reported on 12.8% of returns)
Here:
$30,782
State:
$34,001
(% of AGI for various income ranges: 530.2% for AGIs $25k-50k, 365.6% for AGIs $50k-75k, 609.5% for AGIs $75k-100k, 1276.8% for AGIs $100k-200k, 7500.0% for AGIs over 200k)
Charity contributions: $12,277 (reported on 11.7% of returns)
Here:
$12,277
State:
$14,164
(% of AGI for various income ranges: 146.2% for AGIs $25k-50k, 73.7% for AGIs $50k-75k, 141.5% for AGIs $75k-100k, 420.7% for AGIs $100k-200k, 4582.5% for AGIs over 200k)
Taxes paid: $6,803 (reported on 11.7% of returns)
30292:
$6,803
State:
$7,540
(% of AGI for various income ranges: 43.1% for AGIs $25k-50k, 87.0% for AGIs $50k-75k, 153.0% for AGIs $75k-100k, 383.6% for AGIs $100k-200k, 1322.5% for AGIs over 200k)
Earned income credit: $2,335 (reported on 16.4% of returns)
Here:
$2,335
State:
$2,530
(% of AGI for various income ranges: 108.7% for AGIs below $25k, 75.6% for AGIs $25k-50k)
Percentage of individuals using paid preparers for their 2020 taxes: 91.6%
Here:
92%
State:
93%
(% for various income ranges: 92.0% for AGIs below $25k, 86.5% for AGIs $25k-50k, 95.1% for AGIs $50k-75k, 93.3% for AGIs $75k-100k, 94.3% for AGIs $100k-200k, 91.7% for AGIs over 200k)
Averages for the 2012 tax year for zip code 30292, filed in 2013:
Average Adjusted Gross Income (AGI) in 2012: $50,904 (Individual Income Tax Returns)
Here:
$50,904
State:
$56,131
Salary/wage: $45,554 (reported on 83.7% of returns)
Here:
$45,554
State:
$47,942
(% of AGI for various income ranges: 76.2% for AGIs below $25k, 79.5% for AGIs $25k-50k, 80.5% for AGIs $50k-75k, 76.6% for AGIs $75k-100k, 76.4% for AGIs $100k-200k, 45.5% for AGIs over 200k)
Taxable interest for individuals: $783 (reported on 26.4% of returns)
This zip code:
$783
Georgia:
$1,706
(% of AGI for various income ranges: 1.2% for AGIs below $25k, 0.3% for AGIs $25k-50k, 0.2% for AGIs $50k-75k, 0.4% for AGIs $75k-100k, 0.4% for AGIs $100k-200k, 0.3% for AGIs over 200k)
Ordinary dividends: $1,888 (reported on 13.4% of returns)
Here:
$1,888
State:
$7,265
(% of AGI for various income ranges: 0.8% for AGIs below $25k, 0.3% for AGIs $25k-50k, 0.4% for AGIs $50k-75k, 0.4% for AGIs $75k-100k, 0.8% for AGIs $100k-200k)
Net capital gain/loss in AGI: +$1,935 (reported on 9.6% of returns)
Here:
+$1,935
State:
+$16,323
(% of AGI for various income ranges: 0.3% for AGIs $75k-100k, 1.3% for AGIs $100k-200k)
Profit/loss from business: +$5,391 (reported on 19.2% of returns)
Here:
+$5,391
State:
+$7,583
(% of AGI for various income ranges: 8.9% for AGIs below $25k, 2.4% for AGIs $25k-50k, 0.8% for AGIs $50k-75k, 1.5% for AGIs $75k-100k, 1.5% for AGIs $100k-200k)
Taxable individual retirement arrangement distribution: $14,783 (reported on 7.5% of returns)
30292:
$14,783
Georgia:
$17,199
(% of AGI for various income ranges: 2.3% for AGIs below $25k, 1.9% for AGIs $25k-50k, 1.7% for AGIs $50k-75k, 1.3% for AGIs $75k-100k, 4.0% for AGIs $100k-200k)
Total itemized deductions: $21,280 (26% of AGI, reported on 43.1% of returns)
Here:
$21,280
State:
$23,886
Here:
26.2% of AGI
State:
21.5% of AGI
(% of AGI for various income ranges: 11.5% for AGIs below $25k, 18.6% for AGIs $25k-50k, 18.9% for AGIs $50k-75k, 19.2% for AGIs $75k-100k, 19.2% for AGIs $100k-200k, 15.3% for AGIs over 200k)
Charity contributions: $4,472 (reported on 36.8% of returns)
Here:
$4,472
State:
$5,507
(% of AGI for various income ranges: 0.9% for AGIs below $25k, 3.1% for AGIs $25k-50k, 3.3% for AGIs $50k-75k, 3.1% for AGIs $75k-100k, 3.8% for AGIs $100k-200k, 4.2% for AGIs over 200k)
Taxes paid: $6,453 (reported on 41.8% of returns)
30292:
$6,453
State:
$7,838
(% of AGI for various income ranges: 2.0% for AGIs below $25k, 3.6% for AGIs $25k-50k, 5.1% for AGIs $50k-75k, 5.9% for AGIs $75k-100k, 6.7% for AGIs $100k-200k, 6.7% for AGIs over 200k)
Earned income credit: $2,443 (reported on 22.2% of returns)
Here:
$2,443
State:
$2,589
(% of AGI for various income ranges: 9.2% for AGIs below $25k, 1.5% for AGIs $25k-50k)
Percentage of individuals using paid preparers for their 2012 taxes: 58.6%
Here:
59%
State:
55%
(% for various income ranges: 54.7% for AGIs below $25k, 57.4% for AGIs $25k-50k, 58.3% for AGIs $50k-75k, 61.5% for AGIs $75k-100k, 69.2% for AGIs $100k-200k, 75.0% for AGIs over 200k)
Averages for the 2004 tax year for zip code 30292, filed in 2005:
Average Adjusted Gross Income (AGI) in 2004: $46,812 (Individual Income Tax Returns)
Here:
$46,812
State:
$47,553
Salary/wage: $40,906 (reported on 87.2% of returns)
Here:
$40,906
State:
$42,178
(% of AGI for various income ranges: 130.3% for AGIs below $10k, 79.0% for AGIs $10k-25k, 84.7% for AGIs $25k-50k, 86.5% for AGIs $50k-75k, 78.0% for AGIs $75k-100k, 57.9% for AGIs over 100k)
Taxable interest for individuals: $1,223 (reported on 36.7% of returns)
This zip code:
$1,223
Georgia:
$1,772
(% of AGI for various income ranges: 4.9% for AGIs below $10k, 1.4% for AGIs $10k-25k, 1.0% for AGIs $25k-50k, 0.3% for AGIs $50k-75k, 0.7% for AGIs $75k-100k, 1.3% for AGIs over 100k)
Taxable dividends: $1,827 (reported on 15.8% of returns)
Here:
$1,827
State:
$4,283
(% of AGI for various income ranges: 1.1% for AGIs below $10k, 0.3% for AGIs $10k-25k, 0.7% for AGIs $25k-50k, 0.4% for AGIs $50k-75k, 0.7% for AGIs $75k-100k, 0.8% for AGIs over 100k)
Net capital gain/loss: +$9,515 (reported on 12.6% of returns)
Here:
+$9,515
State:
+$16,461
(% of AGI for various income ranges: 0.3% for AGIs below $10k, 0.4% for AGIs $10k-25k, 0.3% for AGIs $25k-50k, 1.5% for AGIs $50k-75k, 1.3% for AGIs $75k-100k, 6.3% for AGIs over 100k)
Profit/loss from business: +$7,923 (reported on 20.0% of returns)
Here:
+$7,923
State:
+$8,201
(% of AGI for various income ranges: 14.9% for AGIs below $10k, 6.5% for AGIs $10k-25k, 3.5% for AGIs $25k-50k, 0.4% for AGIs $50k-75k, 3.5% for AGIs $75k-100k, 4.4% for AGIs over 100k)
IRA payment deduction: $3,355 (reported on 1.5% of returns)
30292:
$3,355
Georgia:
$2,969
Total itemized deductions: $18,424 (25% of AGI, reported on 46.3% of returns)
Here:
$18,424
State:
$19,944
Here:
24.9% of AGI
State:
22.6% of AGI
(% of AGI for various income ranges: 21.1% for AGIs below $10k, 11.9% for AGIs $10k-25k, 19.2% for AGIs $25k-50k, 21.1% for AGIs $50k-75k, 19.7% for AGIs $75k-100k, 15.9% for AGIs over 100k)
Charity contributions deductions: $3,885 (5% of AGI, reported on 40.4% of returns)
Here:
$3,885
State:
$4,354
Here:
5.1% of AGI
State:
4.7% of AGI
(% of AGI for various income ranges: 1.6% for AGIs below $10k, 1.5% for AGIs $10k-25k, 3.4% for AGIs $25k-50k, 3.6% for AGIs $50k-75k, 4.4% for AGIs $75k-100k, 3.1% for AGIs over 100k)
Total tax: $6,382 (reported on 74.4% of returns)
30292:
$6,382
State:
$8,223
(% of AGI for various income ranges: 5.0% for AGIs below $10k, 3.7% for AGIs $10k-25k, 5.6% for AGIs $25k-50k, 7.4% for AGIs $50k-75k, 9.6% for AGIs $75k-100k, 17.6% for AGIs over 100k)
Earned income credit: $1,976 (reported on 19.8% of returns)
Here:
$1,976
State:
$1,986
Percentage of individuals using paid preparers for their 2004 taxes: 63.5%
Here:
64%
State:
62%
(% for various income ranges: 55.2% for AGIs below $10k, 65.4% for AGIs $10k-25k, 65.4% for AGIs $25k-50k, 66.0% for AGIs $50k-75k, 65.2% for AGIs $75k-100k, 63.0% for AGIs over 100k)
Household received Food Stamps/SNAP in the past 12 months: 190 Household did not receive Food Stamps/SNAP in the past 12 months: 2,025
Women who had a birth in the past 12 months: 92 (73 now married, 19 unmarried) Women who did not have a birth in the past 12 months: 1,480 (748 now married, 731 unmarried)
Housing units in zip code 30292 with a mortgage: 1,168 (54 second mortgage, 55 both second mortgage and home equity loan) Houses without a mortgage: 51
Median monthly owner costs for units with a mortgage: $1,622 Median monthly owner costs for units without a mortgage: $528
Residents with income below the poverty level in 2022:
This zip code:
12.2%
Whole state:
12.7%
Residents with income below 50% of the poverty level in 2022:
This zip code:
9.9%
Whole state:
6.3%
Median number of rooms in houses and condos:
Here:
6.6
State:
6.8
Median number of rooms in apartments:
Here:
5.3
State:
4.6
Notable locations in this zip code not listed on our city pages
Notable locations in zip code 30292: Williamson Area Volunteer Fire Department (A), Pike County Volunteer Fire Department Hollonville Station (B). Display/hide their locations on the map
Churches in zip code 30292 include: Corinth Baptist Church (A), Williamson First United Methodist Church (B), Williamson Bible Christian Church (C), Williamson Baptist Church (D), Mount Hebron Church (E), Hollonville Church (F), Liberty Spring Church (G), Free Liberty Church (H), Shoal Creek Church (I). Display/hide their locations on the map
Cemeteries: Hollonville Cemetery (1), Shoal Creek Cemetery (2), Williamson Cemetery (3), Coggin Cemetery (4), Driver Cemetery (5), Bethany Cemetery (6), Anderson Cemetery (7). Display/hide their locations on the map
Lakes and reservoirs: Saras Lake (A), Eagles Landing Lake (B), Browns Pond (C), Lake Lewis (D), Johnson Lake (E), Brown Lake (F), Corley Lake (G). Display/hide their locations on the map
In group quarters: 165 (-1 institutionalized population)
Size of family households: 831 2-persons, 343 3-persons, 391 4-persons, 85 5-persons, 43 6-persons, 23 7-or-more-persons
Size of nonfamily households: 443 1-person, 58 2-persons
1,056 married couples with children.
310 single-parent households (9 men, 301 women).
97.0% of residents of 30292 zip code speak English at home.
1.9% of residents speak Spanish at home (85% very well, 15% well).
0.2% of residents speak other Indo-European language at home (83% very well, 17% not well).
0.5% of residents speak Asian or Pacific Island language at home (55% very well, 45% well).
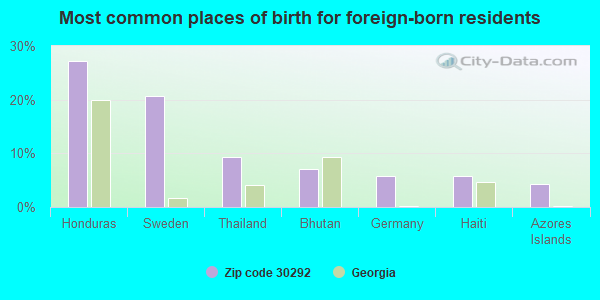
Foreign born population: 145 (2.4%) (84.3% of them are naturalized citizens)
This zip code:
2.4%
Whole state:
10.7%
27%Honduras
21%Sweden
9%Thailand
7%Bhutan
6%Germany
6%Haiti
4%Azores Islands
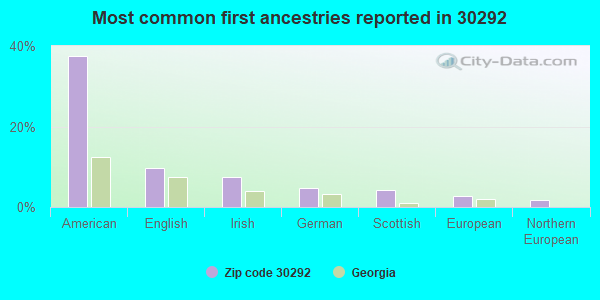
37%American
10%English
7%Irish
5%German
4%Scottish
3%European
2%Northern European
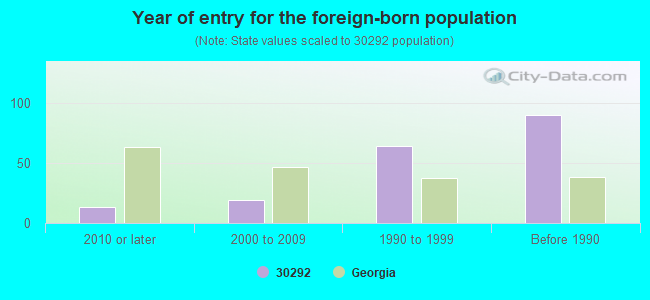
Year of entry for the foreign-born population
132010 or later
192000 to 2009
641990 to 1999
90Before 1990
Facilities with environmental interests located in this zip code:
FLORIDA ROCK INDUSTRIES, INC. (978 ROVER ZETELLA ROAD in WILLIAMSON, GA)
AIR SYNTHETIC MINOR (AIRS/AFS) National Pollutant Discharge Elimination System NON-MAJOR (Tracking pollutant discharge elimination systems) - permit Business SIC classification: CRUSHED AND BROKEN GRANITE Alternative names: FLORIDA ROCK IND.-FLAT CREEK
Housing units lacking complete plumbing facilities: 1.0% Housing units lacking complete kitchen facilities: 0.3%
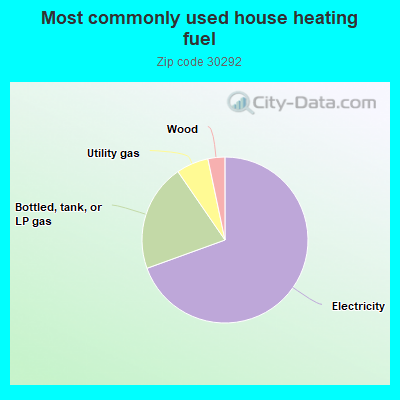
69.6%Electricity
21.0%Bottled, tank, or LP gas
6.3%Utility gas
3.3%Wood
Population in 1990: 2,940. Population change in the 1990s: +1,555 (+52.9%).
Place of birth for U.S.-born residents:
This state: 4,309
Northeast: 172
Midwest: 412
South: 794
West: 195
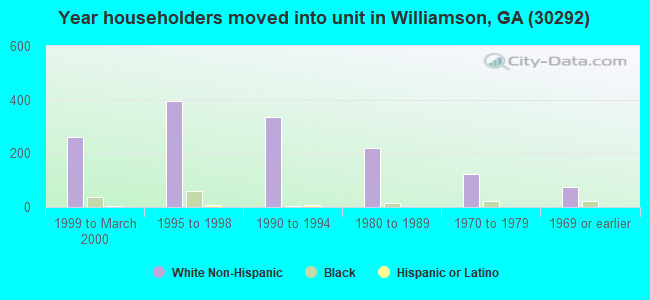
52% of the 30292 zip code residents lived in the same house 5 years ago. Out of people who lived in different houses, 42% lived in this county. Out of people who lived in different counties, 50% lived in Georgia.
92% of the 30292 zip code residents lived in the same house 1 year ago. Out of people who lived in different houses, 14% moved from this county. Out of people who lived in different houses, 54% moved from different county within same state. Out of people who lived in different houses, 35% moved from different state. Out of people who lived in different houses, 2% moved from abroad.
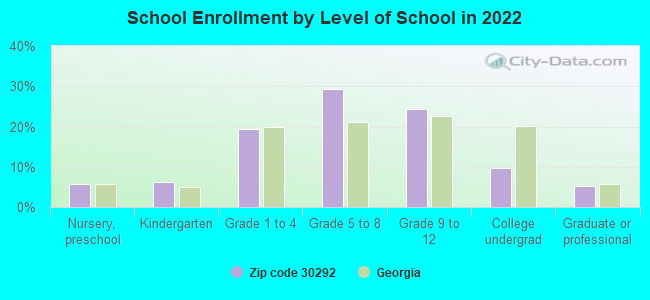
Private vs. public school enrollment:
Students in private schools in grades 1 to 8 (elementary and middle school): 150
Here:
23.1%
Georgia:
12.1%
Students in private schools in grades 9 to 12 (high school): 71
Here:
22.5%
Georgia:
10.8%
Students in private undergraduate colleges: 4
Here:
3.7%
Georgia:
17.1%
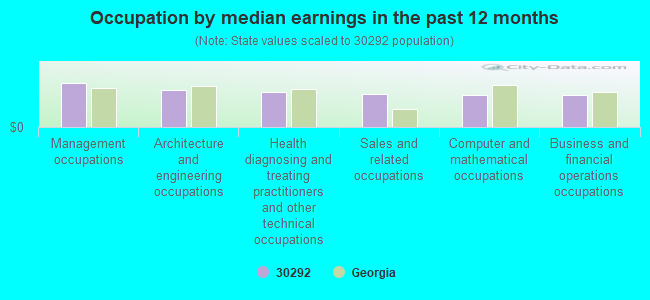
Occupation by median earnings in the past 12 months ($)
103,339Management occupations
87,218Architecture and engineering occupations
81,727Health diagnosing and treating practitioners and other technical occupations
77,847Sales and related occupations
75,792Computer and mathematical occupations
74,650Business and financial operations occupations
Companies with federal contracts located in this zip code:
STONE FENCE FARMS, INC (835 MALOY RD in WILLIAMSON, GA; small business) : $1,413,241 in 57 contractsfrom 2000 to 2006
Contracts for Landscaping/Groundskeeping Services, Maintenance, Repair or Alteration of Real Property -- Recreation Facilities (Non-Building), Construction of Structures and Facilities -- Miscellaneous Buildings by Army, Navy Signed by year:2000: $250,705; 2001: $257,330; 2002: $169,905; 2003: $416,298; 2004: $179,408; 2005: $122,868; 2006: $16,727.
Biggest contracts:
$85,540 with Army for Landscaping/Groundskeeping Services. Signed on 2003-05-14. Completion date: 2002-04-30.
$81,095, same as above.Signed on 2002-05-08. Completion date: 2002-04-30.
$76,578, same as above.Signed on 2000-06-29. Completion date: 2001-06-29.
$75,438, same as above.Signed on 2001-07-09. Completion date: 2002-04-30.
Top industries in this zip code by the number of employees in 2005:
Construction: Site Preparation Contractors (50-99 employees: 1 establishment)
Other Services (except Public Administration): Business Associations (20-49: 1)
Health Care and Social Assistance: Child Day Care Services (20-49: 1)
Construction: Highway, Street, and Bridge Construction (10-19: 1, 1-4: 1)
Mining: Crushed and Broken Granite Mining and Quarrying (10-19: 1)
Construction: New Single-Family Housing Construction (except Operative Builders) (1-4: 7)
Other Services (except Public Administration): Religious Organizations (5-9: 1, 1-4: 3)
Construction: Plumbing, Heating, and Air-Conditioning Contractors (5-9: 1, 1-4: 2)
People in group quarters in 2010:
186 people in state prisons
People in group quarters in 2000:
176 people in state prisons
Fatal accident statistics in 2014:
Fatal accident count: 1
Vehicles involved in fatal accidents: 1
Fatal accidents caused by drunken drivers: 0
Fatalities: 1
Persons involved in fatal accidents: 2
Pedestrians involved in fatal accidents: 1
Fatal accident statistics in 2012:
Fatal accident count: 1
Vehicles involved in fatal accidents: 1
Fatal accidents caused by drunken drivers: 0
Fatalities: 1
Persons involved in fatal accidents: 3
Pedestrians involved in fatal accidents: 0
Home Mortgage Disclosure Act Aggregated Statistics For Year 2009 (Based on 4 partial tracts)
A) FHA, FSA/RHS & VA Home Purchase Loans
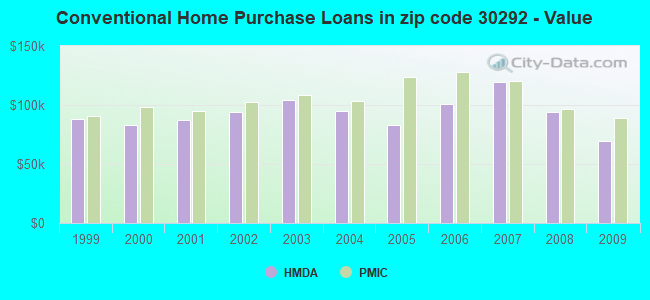
B) Conventional Home Purchase Loans
C) Refinancings
D) Home Improvement Loans
E) Loans on Dwellings For 5+ Families
F) Non-occupant Loans on < 5 Family Dwellings (A B C & D)
G) Loans On Manufactured Home Dwelling (A B C & D)
Number
Average Value
Number
Average Value
Number
Average Value
Number
Average Value
Number
Average Value
Number
Average Value
Number
Average Value
LOANS ORIGINATED
30
$91,169
25
$69,594
122
$118,168
7
$30,709
1
$1,420,000
30
$66,379
2
$58,515
APPLICATIONS APPROVED, NOT ACCEPTED
1
$38,700
1
$53,880
7
$113,596
0
$0
0
$0
2
$52,425
0
$0
APPLICATIONS DENIED
3
$89,670
6
$90,145
54
$116,603
7
$25,989
0
$0
4
$67,465
2
$74,930
APPLICATIONS WITHDRAWN
4
$114,665
4
$38,970
30
$117,799
1
$23,590
0
$0
7
$77,379
0
$0
FILES CLOSED FOR INCOMPLETENESS
0
$0
0
$0
6
$123,910
0
$0
0
$0
1
$126,270
0
$0
Aggregated Statistics For Year 2008 (Based on 4 partial tracts)
A) FHA, FSA/RHS & VA Home Purchase Loans
B) Conventional Home Purchase Loans
C) Refinancings
D) Home Improvement Loans
E) Loans on Dwellings For 5+ Families
F) Non-occupant Loans on < 5 Family Dwellings (A B C & D)
G) Loans On Manufactured Home Dwelling (A B C & D)
Number
Average Value
Number
Average Value
Number
Average Value
Number
Average Value
Number
Average Value
Number
Average Value
Number
Average Value
LOANS ORIGINATED
34
$115,633
47
$94,408
107
$116,123
12
$46,958
3
$345,480
53
$82,660
2
$52,165
APPLICATIONS APPROVED, NOT ACCEPTED
1
$123,030
3
$100,887
14
$102,886
2
$30,850
0
$0
3
$62,710
0
$0
APPLICATIONS DENIED
5
$107,546
17
$139,831
80
$126,823
23
$63,543
0
$0
10
$73,313
2
$44,405
APPLICATIONS WITHDRAWN
9
$101,577
4
$131,908
27
$132,633
2
$114,295
0
$0
4
$83,760
0
$0
FILES CLOSED FOR INCOMPLETENESS
3
$74,247
3
$79,930
9
$135,682
0
$0
0
$0
2
$88,710
0
$0
Aggregated Statistics For Year 2007 (Based on 4 partial tracts)
A) FHA, FSA/RHS & VA Home Purchase Loans
B) Conventional Home Purchase Loans
C) Refinancings
D) Home Improvement Loans
E) Loans on Dwellings For 5+ Families
F) Non-occupant Loans on < 5 Family Dwellings (A B C & D)
G) Loans On Manufactured Home Dwelling (A B C & D)
Number
Average Value
Number
Average Value
Number
Average Value
Number
Average Value
Number
Average Value
Number
Average Value
Number
Average Value
LOANS ORIGINATED
28
$116,364
103
$119,383
136
$107,844
24
$36,947
1
$1,377,950
62
$87,981
3
$74,153
APPLICATIONS APPROVED, NOT ACCEPTED
1
$118,320
11
$102,575
23
$109,787
5
$96,236
0
$0
5
$91,768
1
$64,250
APPLICATIONS DENIED
7
$123,427
33
$110,693
139
$134,456
26
$60,665
0
$0
18
$188,232
1
$61,360
APPLICATIONS WITHDRAWN
1
$172,040
13
$138,260
50
$117,086
9
$97,437
0
$0
7
$120,791
0
$0
FILES CLOSED FOR INCOMPLETENESS
1
$134,960
3
$145,640
14
$160,449
0
$0
0
$0
0
$0
0
$0
Aggregated Statistics For Year 2006 (Based on 4 partial tracts)
A) FHA, FSA/RHS & VA Home Purchase Loans
B) Conventional Home Purchase Loans
C) Refinancings
D) Home Improvement Loans
E) Loans on Dwellings For 5+ Families
F) Non-occupant Loans on < 5 Family Dwellings (A B C & D)
G) Loans On Manufactured Home Dwelling (A B C & D)
Number
Average Value
Number
Average Value
Number
Average Value
Number
Average Value
Number
Average Value
Number
Average Value
Number
Average Value
LOANS ORIGINATED
27
$121,688
160
$101,197
174
$126,770
18
$32,789
2
$249,605
93
$128,163
3
$88,823
APPLICATIONS APPROVED, NOT ACCEPTED
1
$76,280
29
$94,129
42
$107,913
6
$46,590
0
$0
22
$73,763
1
$203,860
APPLICATIONS DENIED
4
$102,505
38
$90,845
180
$112,704
26
$59,254
0
$0
39
$86,834
2
$92,540
APPLICATIONS WITHDRAWN
1
$129,190
23
$106,454
96
$126,065
10
$96,783
0
$0
23
$77,122
0
$0
FILES CLOSED FOR INCOMPLETENESS
0
$0
12
$94,769
22
$117,897
0
$0
0
$0
3
$77,050
0
$0
Aggregated Statistics For Year 2005 (Based on 4 partial tracts)
A) FHA, FSA/RHS & VA Home Purchase Loans
B) Conventional Home Purchase Loans
C) Refinancings
D) Home Improvement Loans
F) Non-occupant Loans on < 5 Family Dwellings (A B C & D)
G) Loans On Manufactured Home Dwelling (A B C & D)
Number
Average Value
Number
Average Value
Number
Average Value
Number
Average Value
Number
Average Value
Number
Average Value
LOANS ORIGINATED
37
$110,711
258
$83,453
188
$104,603
22
$58,640
168
$73,734
4
$36,892
APPLICATIONS APPROVED, NOT ACCEPTED
0
$0
28
$88,930
32
$111,554
4
$66,878
22
$58,440
1
$33,430
APPLICATIONS DENIED
4
$112,350
88
$80,600
156
$116,165
27
$58,416
41
$85,591
7
$44,677
APPLICATIONS WITHDRAWN
2
$96,450
40
$94,469
96
$117,835
15
$106,203
21
$81,903
0
$0
FILES CLOSED FOR INCOMPLETENESS
0
$0
17
$73,842
17
$129,218
0
$0
5
$67,462
1
$65,120
Aggregated Statistics For Year 2004 (Based on 4 partial tracts)
A) FHA, FSA/RHS & VA Home Purchase Loans
B) Conventional Home Purchase Loans
C) Refinancings
D) Home Improvement Loans
E) Loans on Dwellings For 5+ Families
F) Non-occupant Loans on < 5 Family Dwellings (A B C & D)
G) Loans On Manufactured Home Dwelling (A B C & D)
Number
Average Value
Number
Average Value
Number
Average Value
Number
Average Value
Number
Average Value
Number
Average Value
Number
Average Value
LOANS ORIGINATED
26
$116,776
150
$95,016
164
$103,273
15
$42,528
2
$697,240
61
$77,432
4
$61,460
APPLICATIONS APPROVED, NOT ACCEPTED
1
$121,420
16
$87,079
29
$100,388
3
$22,023
0
$0
5
$64,640
1
$99,020
APPLICATIONS DENIED
6
$112,002
33
$118,947
115
$103,991
30
$27,250
0
$0
10
$144,237
3
$34,877
APPLICATIONS WITHDRAWN
4
$102,330
10
$136,489
50
$101,695
6
$50,345
0
$0
4
$140,145
0
$0
FILES CLOSED FOR INCOMPLETENESS
0
$0
7
$68,507
15
$112,973
1
$25,370
0
$0
1
$111,950
1
$59,460
Aggregated Statistics For Year 2003 (Based on 4 partial tracts)
A) FHA, FSA/RHS & VA Home Purchase Loans
B) Conventional Home Purchase Loans
C) Refinancings
D) Home Improvement Loans
F) Non-occupant Loans on < 5 Family Dwellings (A B C & D)
Number
Average Value
Number
Average Value
Number
Average Value
Number
Average Value
Number
Average Value
LOANS ORIGINATED
40
$111,004
83
$103,884
300
$106,078
14
$34,099
58
$89,472
APPLICATIONS APPROVED, NOT ACCEPTED
1
$125,310
5
$90,222
25
$101,230
0
$0
8
$76,784
APPLICATIONS DENIED
3
$105,743
15
$83,989
103
$97,924
9
$21,059
5
$87,672
APPLICATIONS WITHDRAWN
2
$120,050
9
$89,101
59
$96,550
0
$0
15
$75,521
FILES CLOSED FOR INCOMPLETENESS
0
$0
4
$85,388
7
$109,781
0
$0
2
$59,000
Aggregated Statistics For Year 2002 (Based on 4 partial tracts)
A) FHA, FSA/RHS & VA Home Purchase Loans
B) Conventional Home Purchase Loans
C) Refinancings
D) Home Improvement Loans
F) Non-occupant Loans on < 5 Family Dwellings (A B C & D)
Number
Average Value
Number
Average Value
Number
Average Value
Number
Average Value
Number
Average Value
LOANS ORIGINATED
40
$110,780
108
$93,871
213
$100,983
16
$38,013
57
$70,474
APPLICATIONS APPROVED, NOT ACCEPTED
0
$0
10
$69,429
34
$89,088
3
$19,820
5
$64,470
APPLICATIONS DENIED
3
$103,897
25
$97,591
78
$91,544
8
$36,155
15
$76,094
APPLICATIONS WITHDRAWN
1
$155,360
8
$87,129
43
$99,142
3
$20,330
3
$39,993
FILES CLOSED FOR INCOMPLETENESS
0
$0
8
$65,671
15
$97,873
0
$0
4
$67,358
Aggregated Statistics For Year 2001 (Based on 4 partial tracts)
A) FHA, FSA/RHS & VA Home Purchase Loans
B) Conventional Home Purchase Loans
C) Refinancings
D) Home Improvement Loans
F) Non-occupant Loans on < 5 Family Dwellings (A B C & D)
Number
Average Value
Number
Average Value
Number
Average Value
Number
Average Value
Number
Average Value
LOANS ORIGINATED
58
$100,758
91
$87,705
226
$97,444
13
$30,612
61
$68,146
APPLICATIONS APPROVED, NOT ACCEPTED
1
$134,020
8
$76,446
12
$106,696
1
$83,750
2
$75,020
APPLICATIONS DENIED
6
$98,720
18
$83,038
78
$71,393
15
$21,083
13
$60,188
APPLICATIONS WITHDRAWN
6
$89,525
8
$102,864
41
$81,590
3
$17,493
6
$66,648
FILES CLOSED FOR INCOMPLETENESS
2
$96,270
1
$23,590
6
$106,058
0
$0
0
$0
Aggregated Statistics For Year 2000 (Based on 4 partial tracts)
A) FHA, FSA/RHS & VA Home Purchase Loans
B) Conventional Home Purchase Loans
C) Refinancings
D) Home Improvement Loans
F) Non-occupant Loans on < 5 Family Dwellings (A B C & D)
Number
Average Value
Number
Average Value
Number
Average Value
Number
Average Value
Number
Average Value
LOANS ORIGINATED
51
$91,566
78
$83,130
85
$84,260
17
$17,958
35
$60,724
APPLICATIONS APPROVED, NOT ACCEPTED
1
$88,160
7
$67,650
14
$80,237
4
$15,605
1
$62,290
APPLICATIONS DENIED
7
$86,900
29
$71,142
63
$64,785
15
$15,755
11
$66,855
APPLICATIONS WITHDRAWN
3
$104,007
8
$115,100
34
$67,782
0
$0
1
$51,610
FILES CLOSED FOR INCOMPLETENESS
2
$71,255
3
$87,653
11
$83,527
0
$0
1
$82,360
Aggregated Statistics For Year 1999 (Based on 2 partial tracts)
A) FHA, FSA/RHS & VA Home Purchase Loans
B) Conventional Home Purchase Loans
C) Refinancings
D) Home Improvement Loans
F) Non-occupant Loans on < 5 Family Dwellings (A B C & D)
Detailed PMIC statistics for the following Tracts:1607.00
, 1612.00
2002 - 2018 National Fire Incident Reporting System (NFIRS) incidents
According to the data from the years 2002 - 2018 the average number of fire incidents per year is 10. The highest number of reported fire incidents - 27 took place in 2014, and the least - 0 in 2005. The data has an increasing trend.
When looking into fire subcategories, the most incidents belonged to: Outside Fires (51.2%), and Structure Fires (35.8%).
Fire incident types reported to NFIRS in Zip Code 30292


 Nearest zip codes: 30206, 30295, 30205, 30224, 30223, 30256.


 According to the data from the years 2002 - 2018 the average number of fire incidents per year is 10. The highest number of reported fire incidents - 27 took place in 2014, and the least - 0 in 2005. The data has an increasing trend.
 When looking into fire subcategories, the most incidents belonged to: Outside Fires (51.2%), and Structure Fires (35.8%).