Estimated zip code population in 2022: 2,324 Zip code population in 2010: 2,583 Zip code population in 2000: 2,829
Houses and condos: 981 Renter-occupied apartments: 276
% of renters here:
33%
State:
34%
March 2022 cost of living index in zip code 30450: 77.1 (low, U.S. average is 100)
Land area: 49.5 sq. mi. Water area: 1.3 sq. mi.
Population density: 47 people per square mile
(very low).
OSM Map
General Map
Google Map
MSN Map
OSM Map
General Map
Google Map
MSN Map
OSM Map
General Map
Google Map
MSN Map
OSM Map
General Map
Google Map
MSN Map
Please wait while loading the map...
Real estate property taxes paid for housing units in 2022:
This zip code:
0.8% ($924)
Georgia:
0.7% ($2,160)
Median real estate property taxes paid for housing units with mortgages in 2022: $1,188 (0.8%) Median real estate property taxes paid for housing units with no mortgage in 2022: $632 (0.7%)
Estimated median house/condo value in 2022: $114,050
30450:
$114,050
Georgia:
$297,400
According to our research of Georgia and other state lists, there were 7 registered sex offenders living in 30450 zip code as of May 28, 2024. The ratio of all residents to sex offenders in zip code 30450 is 323 to 1. The ratio of registered sex offenders to all residents in this zip code is near the state average.
Median resident age:
This zip code:
44.2 years
Georgia median age:
37.6 years
Average household size:
This zip code:
2.8 people
Georgia:
2.6 people
Averages for the 2020 tax year for zip code 30450, filed in 2021:
Average Adjusted Gross Income (AGI) in 2020: $39,231 (Individual Income Tax Returns)
Here:
$39,231
State:
$70,847
Salary/wage: $37,263 (reported on 82.9% of returns)
Here:
$37,263
State:
$59,126
(% of AGI for various income ranges: 1150.0% for AGIs below $25k, 3717.6% for AGIs $25k-50k, 7492.2% for AGIs $50k-75k, 9510.0% for AGIs $75k-100k, 19452.0% for AGIs $100k-200k)
Taxable interest for individuals: $669 (reported on 14.4% of returns)
This zip code:
$669
Georgia:
$2,011
(% of AGI for various income ranges: 11.2% for AGIs below $25k, 2.8% for AGIs $25k-50k, 42.2% for AGIs $50k-75k, 32.0% for AGIs $100k-200k)
Ordinary dividends: $2,257 (reported on 6.3% of returns)
Here:
$2,257
State:
$8,996
(% of AGI for various income ranges: 13.2% for AGIs below $25k, 260.0% for AGIs $75k-100k)
Net capital gain/loss in AGI: +$5,017 (reported on 5.4% of returns)
Here:
+$5,017
State:
+$28,402
(% of AGI for various income ranges: 6.3% for AGIs below $25k, 10.4% for AGIs $25k-50k, 622.5% for AGIs $75k-100k)
Profit/loss from business: +$3,017 (reported on 20.7% of returns)
Here:
+$3,017
State:
+$6,707
(% of AGI for various income ranges: 159.8% for AGIs below $25k, 60.0% for AGIs $25k-50k)
Taxable individual retirement arrangement distribution: $6,940 (reported on 4.5% of returns)
30450:
$6,940
Georgia:
$20,525
(% of AGI for various income ranges: 29.8% for AGIs below $25k, 250.0% for AGIs $50k-75k)
Total itemized deductions: $26,340 (reported on 4.5% of returns)
Here:
$26,340
State:
$34,001
(% of AGI for various income ranges: 1463.3% for AGIs $50k-75k)
Charity contributions: $8,525 (reported on 3.6% of returns)
Here:
$8,525
State:
$14,164
(% of AGI for various income ranges: 378.9% for AGIs $50k-75k)
Taxes paid: $5,580 (reported on 4.5% of returns)
30450:
$5,580
State:
$7,540
(% of AGI for various income ranges: 19.0% for AGIs below $25k, 223.3% for AGIs $50k-75k)
Earned income credit: $2,833 (reported on 32.4% of returns)
Here:
$2,833
State:
$2,530
(% of AGI for various income ranges: 171.5% for AGIs below $25k, 126.8% for AGIs $25k-50k)
Percentage of individuals using paid preparers for their 2020 taxes: 94.6%
Here:
95%
State:
93%
(% for various income ranges: 96.2% for AGIs below $25k, 93.5% for AGIs $25k-50k, 92.3% for AGIs $50k-75k, 83.3% for AGIs $75k-100k, 100.0% for AGIs $100k-200k)
Averages for the 2012 tax year for zip code 30450, filed in 2013:
Average Adjusted Gross Income (AGI) in 2012: $29,903 (Individual Income Tax Returns)
Here:
$29,903
State:
$56,131
Salary/wage: $27,158 (reported on 82.5% of returns)
Here:
$27,158
State:
$47,942
(% of AGI for various income ranges: 74.7% for AGIs below $25k, 88.1% for AGIs $25k-50k, 78.8% for AGIs $50k-75k, 69.2% for AGIs $75k-100k, 50.4% for AGIs $100k-200k)
Taxable interest for individuals: $1,012 (reported on 16.5% of returns)
This zip code:
$1,012
Georgia:
$1,706
(% of AGI for various income ranges: 0.5% for AGIs below $25k, 0.6% for AGIs $25k-50k, 0.9% for AGIs $50k-75k, 0.6% for AGIs $100k-200k)
Ordinary dividends: $4,771 (reported on 6.8% of returns)
Here:
$4,771
State:
$7,265
(% of AGI for various income ranges: 0.3% for AGIs below $25k, 0.5% for AGIs $25k-50k, 6.9% for AGIs $75k-100k)
Profit/loss from business: +$6,322 (reported on 22.3% of returns)
Here:
+$6,322
State:
+$7,583
(% of AGI for various income ranges: 14.9% for AGIs below $25k, 1.7% for AGIs $25k-50k, 2.4% for AGIs $50k-75k)
Taxable individual retirement arrangement distribution: $9,120 (reported on 4.9% of returns)
30450:
$9,120
Georgia:
$17,199
Total itemized deductions: $17,095 (29% of AGI, reported on 19.4% of returns)
Here:
$17,095
State:
$23,886
Here:
29.3% of AGI
State:
21.5% of AGI
(% of AGI for various income ranges: 4.8% for AGIs below $25k, 13.1% for AGIs $25k-50k, 12.3% for AGIs $50k-75k, 15.7% for AGIs $75k-100k, 12.8% for AGIs $100k-200k)
Charity contributions: $4,344 (reported on 15.5% of returns)
Here:
$4,344
State:
$5,507
(% of AGI for various income ranges: 0.6% for AGIs below $25k, 2.2% for AGIs $25k-50k, 2.5% for AGIs $50k-75k, 3.0% for AGIs $75k-100k, 4.4% for AGIs $100k-200k)
Taxes paid: $4,011 (reported on 18.4% of returns)
30450:
$4,011
State:
$7,838
(% of AGI for various income ranges: 0.7% for AGIs below $25k, 2.3% for AGIs $25k-50k, 3.0% for AGIs $50k-75k, 4.3% for AGIs $75k-100k, 3.5% for AGIs $100k-200k)
Earned income credit: $2,914 (reported on 42.7% of returns)
Here:
$2,914
State:
$2,589
(% of AGI for various income ranges: 14.1% for AGIs below $25k, 1.9% for AGIs $25k-50k)
Percentage of individuals using paid preparers for their 2012 taxes: 69.9%
Here:
70%
State:
55%
(% for various income ranges: 68.3% for AGIs below $25k, 68.0% for AGIs $25k-50k, 88.9% for AGIs $50k-75k, 60.0% for AGIs $75k-100k, 75.0% for AGIs $100k-200k)
Averages for the 2004 tax year for zip code 30450, filed in 2005:
Average Adjusted Gross Income (AGI) in 2004: $24,133 (Individual Income Tax Returns)
Here:
$24,133
State:
$47,553
Salary/wage: $23,335 (reported on 83.6% of returns)
Here:
$23,335
State:
$42,178
(% of AGI for various income ranges: 104.8% for AGIs below $10k, 78.2% for AGIs $10k-25k, 89.7% for AGIs $25k-50k, 83.2% for AGIs $50k-75k, 73.6% for AGIs $75k-100k, 51.3% for AGIs over 100k)
Taxable interest for individuals: $1,112 (reported on 22.1% of returns)
This zip code:
$1,112
Georgia:
$1,772
(% of AGI for various income ranges: 4.2% for AGIs below $10k, 1.3% for AGIs $10k-25k, 0.8% for AGIs $25k-50k, 0.8% for AGIs $50k-75k, 0.3% for AGIs $75k-100k, 0.6% for AGIs over 100k)
Taxable dividends: $1,310 (reported on 9.9% of returns)
Here:
$1,310
State:
$4,283
(% of AGI for various income ranges: 2.8% for AGIs below $10k, 0.4% for AGIs $10k-25k, 0.2% for AGIs $25k-50k, 0.4% for AGIs $50k-75k, 1.8% for AGIs $75k-100k)
Net capital gain/loss: +$2,427 (reported on 8.8% of returns)
Here:
+$2,427
State:
+$16,461
(% of AGI for various income ranges: 1.2% for AGIs below $10k, 0.4% for AGIs $10k-25k, 1.7% for AGIs $25k-50k, 1.6% for AGIs $75k-100k)
Profit/loss from business: +$4,435 (reported on 20.5% of returns)
Here:
+$4,435
State:
+$8,201
(% of AGI for various income ranges: 18.0% for AGIs below $10k, 10.1% for AGIs $10k-25k, 0.9% for AGIs $25k-50k, 0.7% for AGIs $50k-75k)
Total itemized deductions: $15,339 (30% of AGI, reported on 18.1% of returns)
Here:
$15,339
State:
$19,944
Here:
29.8% of AGI
State:
22.6% of AGI
(% of AGI for various income ranges: 8.2% for AGIs $10k-25k, 11.0% for AGIs $25k-50k, 17.3% for AGIs $50k-75k, 13.9% for AGIs $75k-100k, 13.9% for AGIs over 100k)
Charity contributions deductions: $3,068 (6% of AGI, reported on 15.9% of returns)
Here:
$3,068
State:
$4,354
Here:
6.1% of AGI
State:
4.7% of AGI
(% of AGI for various income ranges: 1.3% for AGIs $10k-25k, 1.8% for AGIs $25k-50k, 2.7% for AGIs $50k-75k, 2.3% for AGIs $75k-100k, 4.1% for AGIs over 100k)
Total tax: $2,676 (reported on 57.6% of returns)
30450:
$2,676
State:
$8,223
(% of AGI for various income ranges: 4.8% for AGIs below $10k, 2.9% for AGIs $10k-25k, 4.5% for AGIs $25k-50k, 7.6% for AGIs $50k-75k, 10.4% for AGIs $75k-100k, 16.0% for AGIs over 100k)
Earned income credit: $2,252 (reported on 42.3% of returns)
Here:
$2,252
State:
$1,986
Percentage of individuals using paid preparers for their 2004 taxes: 77.5%
Here:
77%
State:
62%
(% for various income ranges: 73.5% for AGIs below $10k, 82.7% for AGIs $10k-25k, 75.3% for AGIs $25k-50k, 70.0% for AGIs $50k-75k, 77.8% for AGIs $75k-100k, 83.3% for AGIs over 100k)
Household received Food Stamps/SNAP in the past 12 months: 187 Household did not receive Food Stamps/SNAP in the past 12 months: 654
Women who had a birth in the past 12 months: 14 (0 now married, 14 unmarried) Women who did not have a birth in the past 12 months: 537 (189 now married, 348 unmarried)
Housing units in zip code 30450 with a mortgage: 184 (11 second mortgage, 12 both second mortgage and home equity loan) Median monthly owner costs for units with a mortgage: $1,230 Median monthly owner costs for units without a mortgage: $277
Residents with income below the poverty level in 2022:
This zip code:
23.0%
Whole state:
12.7%
Residents with income below 50% of the poverty level in 2022:
This zip code:
13.7%
Whole state:
6.3%
Median number of rooms in houses and condos:
Here:
5.5
State:
6.8
Median number of rooms in apartments:
Here:
6.3
State:
4.6
Notable locations in this zip code not listed on our city pages
Churches in zip code 30450 include: Banks Creek Church (A), Aaron Church (B), Frankville Church (C), Newton Grove Church (D), Oak Grove Baptist Church (E), Pine Grove Church (F), Pleasant Hill Church (G), Poplar Springs Church (H), Scarboro Church (I). Display/hide their locations on the map
Cemeteries: Munlin Cemetery (1), Franklin Cemetery (2), Mincy Cemetery (3), Oak Grove Cemetery (4), Pleasant Hill Cemetery (5), Poplar Springs Cemetery (6), Scarboro Grove Cemetery (7). Display/hide their locations on the map
Lakes and reservoirs: Lake Collins (A), Oglesby Pond (B), Oglesby Pond Dam (C), Fields Pond (D), Lanier Pond (E), Parrish Lake (F), East Oglesby Pond (G). Display/hide their locations on the map
Streams, rivers, and creeks: Wyatts Branch (A), Rattlesnake Creek (B), Coopers Prong (C), Bunks Branch (D), Panther Branch (E). Display/hide their locations on the map
In group quarters: 3 (-1 institutionalized population)
Size of family households: 198 2-persons, 169 3-persons, 112 4-persons, 69 5-persons, 36 6-persons
Size of nonfamily households: 199 1-person, 47 2-persons, 2 3-persons
262 married couples with children.
86 single-parent households (86 women).
98.8% of residents of 30450 zip code speak English at home.
0.7% of residents speak Spanish at home (44% very well, 19% well, 38% not well).
Foreign born population: 17 (0.8%) (61.1% of them are naturalized citizens)
This zip code:
0.8%
Whole state:
10.7%
35%Honduras
18%West Indies
12%Bolivia
9%American
9%English
3%Irish
1%European
1%German
1%French
1%Scotch-Irish
Year of entry for the foreign-born population
82010 or later
72000 to 2009
61990 to 1999
4Before 1990
Facilities with environmental interests located in this zip code:
PORTAL ELEMENTARY SCHOOL (328 GRADY STREET SOUTH in PORTAL, GA)
(National Center for Education Statistics) - STATE ID-0399 Organizations: BULLOCH COUNTY (SCHOOL DISTRICT)
PORTAL MIDDLE/HIGH SCHOOL (27245 HIGHWAY 80 WEST in PORTAL, GA)
(National Center for Education Statistics) - STATE ID-4052 Organizations: BULLOCH COUNTY (SCHOOL DISTRICT)
BIRD LEROY T GIN (BOX 12 in PORTAL, GA)
AIR MINOR (AIRS/AFS) Business SIC classification: COTTON GINNING
Housing units lacking complete plumbing facilities: 3.0% Housing units lacking complete kitchen facilities: 7.2%
83.5%Electricity
7.0%Bottled, tank, or LP gas
3.9%Utility gas
3.6%Wood
2.2%No fuel used
Population in 1990: 3,160.
Place of birth for U.S.-born residents:
This state: 1,853
Northeast: 65
Midwest: 32
South: 303
West: 19
63% of the 30450 zip code residents lived in the same house 5 years ago. Out of people who lived in different houses, 72% lived in this county. Out of people who lived in different counties, 50% lived in Georgia.
91% of the 30450 zip code residents lived in the same house 1 year ago. Out of people who lived in different houses, 25% moved from this county. Out of people who lived in different houses, 62% moved from different county within same state. Out of people who lived in different houses, 12% moved from different state.
Private vs. public school enrollment:
Students in private schools in grades 1 to 8 (elementary and middle school): 7
Here:
7.6%
Georgia:
12.1%
Students in private schools in grades 9 to 12 (high school):
Here:
0.4%
Georgia:
10.8%
Students in private undergraduate colleges: 8
Here:
7.4%
Georgia:
17.1%
Occupation by median earnings in the past 12 months ($)
73,894Management occupations
68,074Computer and mathematical occupations
58,041Education, training, and library occupations
57,636Transportation occupations
51,945Community and social service occupations
44,769Construction and extraction occupations
Top industries in this zip code by the number of employees in 2005:
Construction: Commercial and Institutional Building Construction (50-99 employees: 1 establishment)
Construction: Plumbing, Heating, and Air-Conditioning Contractors (5-9: 1, 1-4: 2)
Health Care and Social Assistance: Child Day Care Services (1-4: 2)
Construction: Site Preparation Contractors (1-4: 2)
Wholesale Trade: Other Chemical and Allied Products Merchant Wholesalers (1-4: 1)
Construction: Framing Contractors (1-4: 1)
Fatal accident statistics in 2014:
Fatal accident count: 1
Vehicles involved in fatal accidents: 1
Fatal accidents caused by drunken drivers: 1
Fatalities: 1
Persons involved in fatal accidents: 2
Pedestrians involved in fatal accidents: 0
Fatal accident statistics in 2013:
Fatal accident count: 1
Vehicles involved in fatal accidents: 1
Fatal accidents caused by drunken drivers: 1
Fatalities: 1
Persons involved in fatal accidents: 1
Pedestrians involved in fatal accidents: 0
2007 - 2018 National Fire Incident Reporting System (NFIRS) incidents
Based on the data from the years 2007 - 2018 the average number of fire incidents per year is 17. The highest number of fire incidents - 40 took place in 2012, and the least - 0 in 2009. The data has a growing trend.
When looking into fire subcategories, the most incidents belonged to: Outside Fires (56.9%), and Structure Fires (27.9%).
Fire incident types reported to NFIRS in Zip Code 30450

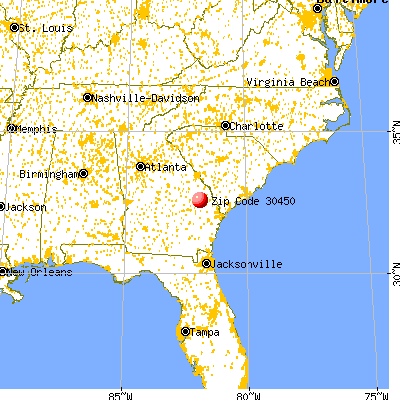


 Nearest zip codes: 30451, 30455, 30458, 30460, 30461, 30425.


 Based on the data from the years 2007 - 2018 the average number of fire incidents per year is 17. The highest number of fire incidents - 40 took place in 2012, and the least - 0 in 2009. The data has a growing trend.
 When looking into fire subcategories, the most incidents belonged to: Outside Fires (56.9%), and Structure Fires (27.9%).