Estimated zip code population in 2022: 5,207 Zip code population in 2010: 4,463 Zip code population in 2000: 3,401
Houses and condos: 2,035 Renter-occupied apartments: 333
% of renters here:
17%
State:
34%
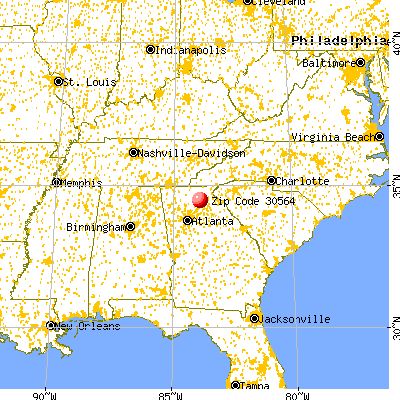
March 2022 cost of living index in zip code 30564: 82.2 (low, U.S. average is 100)
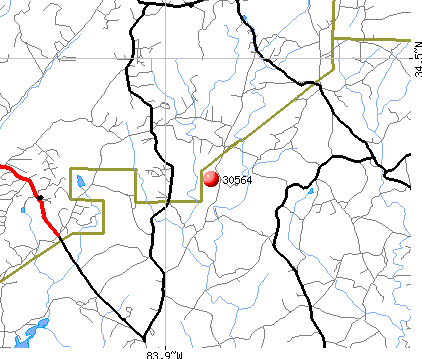
Land area: 30.9 sq. mi. Water area: 0.5 sq. mi.
Population density: 168 people per square mile
(very low).
OSM Map
General Map
Google Map
MSN Map
OSM Map
General Map
Google Map
MSN Map
OSM Map
General Map
Google Map
MSN Map
OSM Map
General Map
Google Map
MSN Map
Please wait while loading the map...
Real estate property taxes paid for housing units in 2022:
This zip code:
0.6% ($2,017)
Georgia:
0.7% ($2,160)
Median real estate property taxes paid for housing units with mortgages in 2022: $1,963 (0.6%) Median real estate property taxes paid for housing units with no mortgage in 2022: $2,091 (0.6%)
Business Search- 14 Million verified businesses
Males: 2,659
(51.1%)
Females: 2,547
(48.9%)
For population 25 years and over in 30564:
High school or higher: 84.3%
Bachelor's degree or higher: 21.9%
Graduate or professional degree: 12.9%
Unemployed: 1.1%
Mean travel time to work (commute): 33.5 minutes
For population 15 years and over in 30564:
Never married: 20.9%
Now married: 67.7%
Separated: 0.4%
Widowed: 4.2%
Divorced: 6.8%
Zip code 30564 compared to state average:
Unemployed percentage significantly below state average.
Black race population percentage significantly below state average.
Median age above state average.
Foreign-born population percentage significantly below state average.
Renting percentage below state average.
Length of stay since moving in above state average.
Percentage of population with a bachelor's degree or higher below state average.
Averages for the 2020 tax year for zip code 30564, filed in 2021:
Average Adjusted Gross Income (AGI) in 2020: $64,555 (Individual Income Tax Returns)
Here:
$64,555
State:
$70,847
Salary/wage: $52,743 (reported on 81.7% of returns)
Here:
$52,743
State:
$59,126
(% of AGI for various income ranges: 1160.5% for AGIs below $25k, 3621.9% for AGIs $25k-50k, 6926.7% for AGIs $50k-75k, 9771.4% for AGIs $75k-100k, 17425.9% for AGIs $100k-200k, 55426.7% for AGIs over 200k)
Taxable interest for individuals: $1,704 (reported on 22.7% of returns)
This zip code:
$1,704
Georgia:
$2,011
(% of AGI for various income ranges: 13.8% for AGIs below $25k, 26.5% for AGIs $25k-50k, 30.0% for AGIs $50k-75k, 77.1% for AGIs $75k-100k, 80.0% for AGIs $100k-200k, 1263.3% for AGIs over 200k)
Ordinary dividends: $6,879 (reported on 14.8% of returns)
Here:
$6,879
State:
$8,996
(% of AGI for various income ranges: 15.4% for AGIs below $25k, 35.3% for AGIs $25k-50k, 22.1% for AGIs $50k-75k, 182.9% for AGIs $75k-100k, 197.6% for AGIs $100k-200k, 4853.3% for AGIs over 200k)
Net capital gain/loss in AGI: +$15,752 (reported on 13.5% of returns)
Here:
+$15,752
State:
+$28,402
(% of AGI for various income ranges: 8.2% for AGIs below $25k, 38.1% for AGIs $25k-50k, 78.3% for AGIs $50k-75k, 184.3% for AGIs $75k-100k, 451.2% for AGIs $100k-200k, 11533.3% for AGIs over 200k)
Profit/loss from business: +$12,162 (reported on 18.3% of returns)
Here:
+$12,162
State:
+$6,707
(% of AGI for various income ranges: 155.2% for AGIs below $25k, 179.3% for AGIs $25k-50k, 261.2% for AGIs $50k-75k, 362.1% for AGIs $75k-100k, 720.0% for AGIs $100k-200k, 3700.0% for AGIs over 200k)
Taxable individual retirement arrangement distribution: $17,260 (reported on 8.7% of returns)
30564:
$17,260
Georgia:
$20,525
(% of AGI for various income ranges: 42.1% for AGIs below $25k, 87.9% for AGIs $25k-50k, 272.5% for AGIs $50k-75k, 580.0% for AGIs $75k-100k, 807.1% for AGIs $100k-200k)
Total itemized deductions: $37,585 (reported on 8.7% of returns)
Here:
$37,585
State:
$34,001
(% of AGI for various income ranges: 133.3% for AGIs $25k-50k, 288.8% for AGIs $50k-75k, 646.4% for AGIs $75k-100k, 1307.1% for AGIs $100k-200k, 10413.3% for AGIs over 200k)
Charity contributions: $12,894 (reported on 7.9% of returns)
Here:
$12,894
State:
$14,164
(% of AGI for various income ranges: 49.5% for AGIs $25k-50k, 163.6% for AGIs $75k-100k, 454.7% for AGIs $100k-200k, 3686.7% for AGIs over 200k)
Taxes paid: $7,715 (reported on 8.7% of returns)
30564:
$7,715
State:
$7,540
(% of AGI for various income ranges: 22.6% for AGIs $25k-50k, 58.3% for AGIs $50k-75k, 159.3% for AGIs $75k-100k, 387.1% for AGIs $100k-200k, 1416.7% for AGIs over 200k)
Earned income credit: $2,254 (reported on 16.2% of returns)
Here:
$2,254
State:
$2,530
(% of AGI for various income ranges: 92.9% for AGIs below $25k, 73.0% for AGIs $25k-50k)
Percentage of individuals using paid preparers for their 2020 taxes: 94.3%
Here:
94%
State:
93%
(% for various income ranges: 93.4% for AGIs below $25k, 94.6% for AGIs $25k-50k, 97.1% for AGIs $50k-75k, 95.7% for AGIs $75k-100k, 93.3% for AGIs $100k-200k, 88.9% for AGIs over 200k)
Averages for the 2012 tax year for zip code 30564, filed in 2013:
Average Adjusted Gross Income (AGI) in 2012: $45,402 (Individual Income Tax Returns)
Here:
$45,402
State:
$56,131
Salary/wage: $39,215 (reported on 81.6% of returns)
Here:
$39,215
State:
$47,942
(% of AGI for various income ranges: 74.4% for AGIs below $25k, 76.1% for AGIs $25k-50k, 73.1% for AGIs $50k-75k, 79.5% for AGIs $75k-100k, 70.1% for AGIs $100k-200k, 42.4% for AGIs over 200k)
Taxable interest for individuals: $1,567 (reported on 24.4% of returns)
This zip code:
$1,567
Georgia:
$1,706
(% of AGI for various income ranges: 1.4% for AGIs below $25k, 0.6% for AGIs $25k-50k, 0.5% for AGIs $50k-75k, 0.3% for AGIs $75k-100k, 1.2% for AGIs $100k-200k, 1.3% for AGIs over 200k)
Ordinary dividends: $2,221 (reported on 14.4% of returns)
Here:
$2,221
State:
$7,265
(% of AGI for various income ranges: 0.8% for AGIs below $25k, 0.4% for AGIs $25k-50k, 0.6% for AGIs $50k-75k, 0.5% for AGIs $75k-100k, 1.5% for AGIs $100k-200k)
Net capital gain/loss in AGI: +$2,300 (reported on 9.5% of returns)
Here:
+$2,300
State:
+$16,323
(% of AGI for various income ranges: 2.5% for AGIs $100k-200k)
Profit/loss from business: +$8,488 (reported on 20.4% of returns)
Here:
+$8,488
State:
+$7,583
(% of AGI for various income ranges: 11.0% for AGIs below $25k, 4.5% for AGIs $25k-50k, 1.7% for AGIs $50k-75k, 1.3% for AGIs $75k-100k, 5.1% for AGIs $100k-200k)
Taxable individual retirement arrangement distribution: $15,275 (reported on 10.0% of returns)
30564:
$15,275
Georgia:
$17,199
(% of AGI for various income ranges: 3.3% for AGIs below $25k, 3.1% for AGIs $25k-50k, 5.7% for AGIs $50k-75k, 5.6% for AGIs $100k-200k)
Total itemized deductions: $21,746 (27% of AGI, reported on 33.8% of returns)
Here:
$21,746
State:
$23,886
Here:
26.7% of AGI
State:
21.5% of AGI
(% of AGI for various income ranges: 13.4% for AGIs below $25k, 14.6% for AGIs $25k-50k, 16.1% for AGIs $50k-75k, 16.6% for AGIs $75k-100k, 17.0% for AGIs $100k-200k, 19.7% for AGIs over 200k)
Charity contributions: $4,048 (reported on 26.9% of returns)
Here:
$4,048
State:
$5,507
(% of AGI for various income ranges: 1.2% for AGIs below $25k, 1.7% for AGIs $25k-50k, 2.3% for AGIs $50k-75k, 2.5% for AGIs $75k-100k, 3.4% for AGIs $100k-200k, 2.9% for AGIs over 200k)
Taxes paid: $6,247 (reported on 33.8% of returns)
30564:
$6,247
State:
$7,838
(% of AGI for various income ranges: 1.9% for AGIs below $25k, 2.9% for AGIs $25k-50k, 3.9% for AGIs $50k-75k, 6.1% for AGIs $75k-100k, 5.8% for AGIs $100k-200k, 7.4% for AGIs over 200k)
Earned income credit: $2,174 (reported on 22.9% of returns)
Here:
$2,174
State:
$2,589
(% of AGI for various income ranges: 7.1% for AGIs below $25k, 1.4% for AGIs $25k-50k)
Percentage of individuals using paid preparers for their 2012 taxes: 59.7%
Here:
60%
State:
55%
(% for various income ranges: 57.0% for AGIs below $25k, 56.9% for AGIs $25k-50k, 65.5% for AGIs $50k-75k, 62.5% for AGIs $75k-100k, 62.5% for AGIs $100k-200k, 100.0% for AGIs over 200k)
Averages for the 2004 tax year for zip code 30564, filed in 2005:
Average Adjusted Gross Income (AGI) in 2004: $41,611 (Individual Income Tax Returns)
Here:
$41,611
State:
$47,553
Salary/wage: $38,354 (reported on 83.8% of returns)
Here:
$38,354
State:
$42,178
(% of AGI for various income ranges: 136.1% for AGIs below $10k, 75.2% for AGIs $10k-25k, 79.5% for AGIs $25k-50k, 84.4% for AGIs $50k-75k, 84.8% for AGIs $75k-100k, 59.9% for AGIs over 100k)
Taxable interest for individuals: $1,729 (reported on 36.8% of returns)
This zip code:
$1,729
Georgia:
$1,772
(% of AGI for various income ranges: 6.8% for AGIs below $10k, 2.3% for AGIs $10k-25k, 1.4% for AGIs $25k-50k, 0.8% for AGIs $50k-75k, 0.4% for AGIs $75k-100k, 2.6% for AGIs over 100k)
Taxable dividends: $1,948 (reported on 17.7% of returns)
Here:
$1,948
State:
$4,283
(% of AGI for various income ranges: 4.6% for AGIs below $10k, 0.8% for AGIs $10k-25k, 0.3% for AGIs $25k-50k, 0.2% for AGIs $50k-75k, 0.3% for AGIs $75k-100k, 2.1% for AGIs over 100k)
Net capital gain/loss: +$8,974 (reported on 12.4% of returns)
Here:
+$8,974
State:
+$16,461
(% of AGI for various income ranges: -1.0% for AGIs below $10k, -0.3% for AGIs $10k-25k, 1.0% for AGIs $25k-50k, 0.0% for AGIs $50k-75k, 1.7% for AGIs $75k-100k, 9.2% for AGIs over 100k)
Profit/loss from business: +$7,966 (reported on 20.9% of returns)
Here:
+$7,966
State:
+$8,201
(% of AGI for various income ranges: -0.4% for AGIs below $10k, 9.7% for AGIs $10k-25k, 5.0% for AGIs $25k-50k, 2.0% for AGIs $50k-75k, 0.4% for AGIs $75k-100k, 5.5% for AGIs over 100k)
IRA payment deduction: $2,979 (reported on 2.6% of returns)
30564:
$2,979
Georgia:
$2,969
Total itemized deductions: $18,106 (26% of AGI, reported on 39.3% of returns)
Here:
$18,106
State:
$19,944
Here:
25.9% of AGI
State:
22.6% of AGI
(% of AGI for various income ranges: 16.6% for AGIs below $10k, 11.1% for AGIs $10k-25k, 16.7% for AGIs $25k-50k, 19.3% for AGIs $50k-75k, 19.2% for AGIs $75k-100k, 16.5% for AGIs over 100k)
Charity contributions deductions: $3,418 (5% of AGI, reported on 33.2% of returns)
Here:
$3,418
State:
$4,354
Here:
4.7% of AGI
State:
4.7% of AGI
(% of AGI for various income ranges: 1.8% for AGIs $10k-25k, 2.0% for AGIs $25k-50k, 3.2% for AGIs $50k-75k, 3.1% for AGIs $75k-100k, 3.2% for AGIs over 100k)
Total tax: $5,235 (reported on 74.7% of returns)
30564:
$5,235
State:
$8,223
(% of AGI for various income ranges: 6.7% for AGIs below $10k, 4.2% for AGIs $10k-25k, 6.6% for AGIs $25k-50k, 7.3% for AGIs $50k-75k, 9.7% for AGIs $75k-100k, 16.3% for AGIs over 100k)
Earned income credit: $1,805 (reported on 18.9% of returns)
Here:
$1,805
State:
$1,986
Percentage of individuals using paid preparers for their 2004 taxes: 66.9%
Here:
67%
State:
62%
(% for various income ranges: 56.7% for AGIs below $10k, 69.4% for AGIs $10k-25k, 68.9% for AGIs $25k-50k, 68.7% for AGIs $50k-75k, 63.0% for AGIs $75k-100k, 79.1% for AGIs over 100k)
Household received Food Stamps/SNAP in the past 12 months: 198 Household did not receive Food Stamps/SNAP in the past 12 months: 1,755
Women who had a birth in the past 12 months: 156 (156 now married, 0 unmarried) Women who did not have a birth in the past 12 months: 808 (434 now married, 373 unmarried)
Housing units in zip code 30564 with a mortgage: 948 (128 second mortgage, 122 both second mortgage and home equity loan) Houses without a mortgage: 54
Median monthly owner costs for units with a mortgage: $1,174 Median monthly owner costs for units without a mortgage: $461
Residents with income below the poverty level in 2022:
This zip code:
10.3%
Whole state:
12.7%
Residents with income below 50% of the poverty level in 2022:
This zip code:
7.4%
Whole state:
6.3%
Median number of rooms in houses and condos:
Here:
6.3
State:
6.8
Median number of rooms in apartments:
Here:
5.3
State:
4.6
Notable locations in this zip code not listed on our city pages
Notable locations in zip code 30564: Hall County Fire Services Station 11 (A), Dahlonega - Lumpkin County Volunteer Fire Department Station 2 (B). Display/hide their locations on the map
Churches in zip code 30564 include: Bethel Church (A), Mount Vernon Church (B), Murrayville Holiness Church (C), Murrayville Church (D), Calvary Church (E), Wahoo Church (F), Yellow Creek Church (G), Zion Church (H). Display/hide their locations on the map
Size of family households: 778 2-persons, 337 3-persons, 248 4-persons, 131 5-persons, 50 6-persons, 33 7-or-more-persons
Size of nonfamily households: 349 1-person, 33 2-persons
933 married couples with children.
103 single-parent households (27 men, 76 women).
94.1% of residents of 30564 zip code speak English at home.
4.5% of residents speak Spanish at home (75% very well, 25% well).
0.6% of residents speak other Indo-European language at home (100% very well).
0.6% of residents speak Asian or Pacific Island language at home (100% well).
0.1% of residents speak other language at home (100% well).
Foreign born population: 199 (3.8%) (60.0% of them are naturalized citizens)
This zip code:
3.8%
Whole state:
10.7%
56%Honduras
16%Thailand
8%Bolivia
6%Egypt
6%England
4%Sweden
4%Guatemala
21%American
21%English
10%Irish
5%Scottish
5%German
4%Scotch-Irish
3%Italian
Year of entry for the foreign-born population
02010 or later
772000 to 2009
531990 to 1999
150Before 1990
Facilities with environmental interests located in this zip code:
STATE MASTER (Georgia's Geographic Environmental Information) - UST-MS-1, UNDERGROUND STORAGE TANK PROGRAM, UST-MS-2, UST-MTS-3, UST-MTS-4, UST-MTS-5, UST-MTS-6, UST-MS-3, UST-MTS-1, UST-MTS-2, CRITERIA AND HAZARDOUS AIR POLLUTANT INVENTORY (Inventory of air pollution sources) TRI REPORTER (Tracking of toxic chemicals releasing facilities) Business SIC classification: POULTRY SLAUGHTERING AND PROCESSING Organizations: DENARD & MOORE CONST (INSTALLER)
Alternative names: FIELDALE MURRAYVILLE COMPLEX
FIELDALE FARMS CORP (5136 THOMPSON BRIDGE RD in MURRAYVILLE, GA)
National Pollutant Discharge Elimination System NON-MAJOR (Tracking pollutant discharge elimination systems) - permit Business SIC classification: SEWERAGE SYSTEMS Alternative names: FIELDALE FARMS CORP. (LAS)
FIELDALE FARMS CORP (GA HIGHWAY 60 in MURRAYVILLE, GA)
AIR MINOR (AIRS/AFS) Business SIC classification: POULTRY SLAUGHTERING AND PROCESSING
BARRETT WOOD PRODUCTS (247 MT. ZION CHURCH R in MURRAYVILLE, GA)
AIR SYNTHETIC MINOR (AIRS/AFS) Business SIC classification: WOOD KITCHEN CABINETS
Housing units lacking complete plumbing facilities: 1.9% Housing units lacking complete kitchen facilities: 1.9%
76.8%Electricity
10.3%Bottled, tank, or LP gas
5.4%Utility gas
3.4%Wood
2.5%No fuel used
1.7%Fuel oil, kerosene, etc.
Population in 1990: 2,126. Population change in the 1990s: +1,275 (+60.0%).
Place of birth for U.S.-born residents:
This state: 3,450
Northeast: 187
Midwest: 242
South: 688
West: 315
57% of the 30564 zip code residents lived in the same house 5 years ago. Out of people who lived in different houses, 47% lived in this county. Out of people who lived in different counties, 50% lived in Georgia.
93% of the 30564 zip code residents lived in the same house 1 year ago. Out of people who lived in different houses, 24% moved from this county. Out of people who lived in different houses, 67% moved from different county within same state. Out of people who lived in different houses, 9% moved from different state.
Private vs. public school enrollment:
Students in private schools in grades 1 to 8 (elementary and middle school): 14
Here:
2.7%
Georgia:
12.1%
Students in private schools in grades 9 to 12 (high school): 7
Here:
2.5%
Georgia:
10.8%
Students in private undergraduate colleges: 14
Here:
8.1%
Georgia:
17.1%
Occupation by median earnings in the past 12 months ($)
74,535Arts, design, entertainment, sports, and media occupations
72,337Business and financial operations occupations
48,866Health technologists and technicians
44,357Installation, maintenance, and repair occupations
42,531Construction and extraction occupations
41,526Building and grounds cleaning and maintenance occupations
Companies with federal contracts located in this zip code:
ATHLETIC SPECIALTIES AND CONST (8058 BEACHWOOD DR in MURRAYVILLE, GA; small business) : $144,453 in 3 contractsfrom 2004 to 2005
$94,995 with Air Force for Recreational and Gymnastic Equipment. Signed on 2005-09-27. Completion date: 2006-01-26.
$44,988 with Air Force for Nets and Booms, Ordnance. Signed on 2004-09-30. Completion date: 2004-11-29.
$4,470 with Air Force for Recreational and Gymnastic Equipment. Signed on 2005-12-07. Completion date: 2006-01-26.
Top industries in this zip code by the number of employees in 2005:
Health Care and Social Assistance: Child Day Care Services (20-49 employees: 1 establishment, 1-4 employees: 1 establishment)
Construction: Structural Steel and Precast Concrete Contractors (20-49: 1)
Wholesale Trade: Metal Service Centers and Other Metal Merchant Wholesalers (20-49: 1)
Professional, Scientific, and Technical Services: Veterinary Services (20-49: 1)
Accommodation and Food Services: Full-Service Restaurants (10-19: 1, 5-9: 1)
People in group quarters in 2010:
8 people in group homes intended for adults
Fatal accident statistics in 2013:
Fatal accident count: 1
Vehicles involved in fatal accidents: 1
Fatal accidents caused by drunken drivers: 0
Fatalities: 1
Persons involved in fatal accidents: 1
Pedestrians involved in fatal accidents: 0
Fatal accident statistics in 2012:
Fatal accident count: 1
Vehicles involved in fatal accidents: 2
Fatal accidents caused by drunken drivers: 0
Fatalities: 1
Persons involved in fatal accidents: 6
Pedestrians involved in fatal accidents: 0
Home Mortgage Disclosure Act Aggregated Statistics For Year 2009 (Based on 4 partial tracts)
A) FHA, FSA/RHS & VA Home Purchase Loans
B) Conventional Home Purchase Loans
C) Refinancings
D) Home Improvement Loans
F) Non-occupant Loans on < 5 Family Dwellings (A B C & D)
G) Loans On Manufactured Home Dwelling (A B C & D)
Number
Average Value
Number
Average Value
Number
Average Value
Number
Average Value
Number
Average Value
Number
Average Value
LOANS ORIGINATED
23
$152,815
47
$283,763
211
$191,793
14
$44,788
47
$238,206
12
$48,302
APPLICATIONS APPROVED, NOT ACCEPTED
1
$132,760
2
$243,030
15
$222,726
0
$0
2
$211,095
2
$27,630
APPLICATIONS DENIED
4
$161,328
10
$202,182
73
$190,845
4
$37,645
7
$194,834
4
$52,178
APPLICATIONS WITHDRAWN
4
$133,408
9
$270,274
62
$196,729
3
$51,467
5
$259,292
1
$49,860
FILES CLOSED FOR INCOMPLETENESS
0
$0
2
$156,240
12
$244,030
1
$35,650
0
$0
0
$0
Aggregated Statistics For Year 2008 (Based on 4 partial tracts)
A) FHA, FSA/RHS & VA Home Purchase Loans
B) Conventional Home Purchase Loans
C) Refinancings
D) Home Improvement Loans
E) Loans on Dwellings For 5+ Families
F) Non-occupant Loans on < 5 Family Dwellings (A B C & D)
G) Loans On Manufactured Home Dwelling (A B C & D)
Number
Average Value
Number
Average Value
Number
Average Value
Number
Average Value
Number
Average Value
Number
Average Value
Number
Average Value
LOANS ORIGINATED
19
$136,631
61
$215,995
159
$193,948
13
$74,328
1
$118,840
42
$197,327
14
$61,618
APPLICATIONS APPROVED, NOT ACCEPTED
1
$92,700
7
$211,434
16
$161,826
2
$50,305
0
$0
2
$214,210
4
$86,452
APPLICATIONS DENIED
4
$168,120
13
$215,681
101
$217,075
14
$70,956
0
$0
12
$168,001
11
$72,677
APPLICATIONS WITHDRAWN
2
$203,215
7
$189,904
45
$201,052
1
$243,650
0
$0
5
$257,310
4
$64,768
FILES CLOSED FOR INCOMPLETENESS
0
$0
2
$197,830
10
$222,100
1
$5,940
0
$0
1
$278,890
0
$0
Aggregated Statistics For Year 2007 (Based on 4 partial tracts)
A) FHA, FSA/RHS & VA Home Purchase Loans
B) Conventional Home Purchase Loans
C) Refinancings
D) Home Improvement Loans
F) Non-occupant Loans on < 5 Family Dwellings (A B C & D)
G) Loans On Manufactured Home Dwelling (A B C & D)
Number
Average Value
Number
Average Value
Number
Average Value
Number
Average Value
Number
Average Value
Number
Average Value
LOANS ORIGINATED
7
$137,887
131
$199,365
189
$197,716
21
$93,512
54
$175,170
16
$65,907
APPLICATIONS APPROVED, NOT ACCEPTED
0
$0
20
$199,948
33
$204,821
4
$123,798
4
$326,938
4
$92,382
APPLICATIONS DENIED
5
$152,590
33
$298,864
123
$205,665
21
$70,912
11
$291,463
7
$70,219
APPLICATIONS WITHDRAWN
1
$121,220
16
$295,703
53
$191,299
4
$196,382
6
$444,543
1
$64,360
FILES CLOSED FOR INCOMPLETENESS
0
$0
5
$191,950
19
$208,769
1
$29,420
2
$217,230
1
$41,590
Aggregated Statistics For Year 2006 (Based on 4 partial tracts)
A) FHA, FSA/RHS & VA Home Purchase Loans
B) Conventional Home Purchase Loans
C) Refinancings
D) Home Improvement Loans
F) Non-occupant Loans on < 5 Family Dwellings (A B C & D)
G) Loans On Manufactured Home Dwelling (A B C & D)
Number
Average Value
Number
Average Value
Number
Average Value
Number
Average Value
Number
Average Value
Number
Average Value
LOANS ORIGINATED
13
$116,156
192
$194,772
188
$185,949
20
$68,812
60
$194,906
22
$79,763
APPLICATIONS APPROVED, NOT ACCEPTED
1
$123,590
18
$245,577
29
$162,486
2
$26,490
4
$201,582
4
$59,328
APPLICATIONS DENIED
4
$126,125
30
$305,918
108
$215,945
14
$48,093
6
$170,012
14
$54,831
APPLICATIONS WITHDRAWN
1
$140,230
20
$310,276
69
$188,705
5
$66,150
5
$280,010
4
$65,345
FILES CLOSED FOR INCOMPLETENESS
0
$0
5
$222,102
23
$171,725
0
$0
1
$281,410
0
$0
Aggregated Statistics For Year 2005 (Based on 4 partial tracts)
A) FHA, FSA/RHS & VA Home Purchase Loans
B) Conventional Home Purchase Loans
C) Refinancings
D) Home Improvement Loans
F) Non-occupant Loans on < 5 Family Dwellings (A B C & D)
G) Loans On Manufactured Home Dwelling (A B C & D)
Number
Average Value
Number
Average Value
Number
Average Value
Number
Average Value
Number
Average Value
Number
Average Value
LOANS ORIGINATED
8
$119,171
156
$168,554
202
$158,115
14
$62,843
49
$193,094
17
$55,532
APPLICATIONS APPROVED, NOT ACCEPTED
0
$0
7
$191,147
36
$169,754
3
$74,960
2
$215,695
2
$82,940
APPLICATIONS DENIED
2
$134,290
34
$179,024
106
$163,882
9
$64,467
7
$300,693
10
$55,373
APPLICATIONS WITHDRAWN
0
$0
19
$106,731
70
$170,959
5
$80,726
3
$172,063
3
$90,560
FILES CLOSED FOR INCOMPLETENESS
1
$103,990
1
$375,230
21
$178,453
1
$88,540
1
$72,830
2
$81,405
Aggregated Statistics For Year 2004 (Based on 4 partial tracts)
A) FHA, FSA/RHS & VA Home Purchase Loans
B) Conventional Home Purchase Loans
C) Refinancings
D) Home Improvement Loans
F) Non-occupant Loans on < 5 Family Dwellings (A B C & D)
G) Loans On Manufactured Home Dwelling (A B C & D)
Detailed PMIC statistics for the following Tracts:0002.02
, 0003.01
2002 - 2018 National Fire Incident Reporting System (NFIRS) incidents
Based on the data from the years 2002 - 2018 the average number of fire incidents per year is 19. The highest number of fires - 36 took place in 2011, and the least - 1 in 2004. The data has an increasing trend.
When looking into fire subcategories, the most reports belonged to: Outside Fires (44.1%), and Structure Fires (38.8%).
Fire incident types reported to NFIRS in Zip Code 30564


 Nearest zip codes: 30527, 30506, 30533, 30501, 30528, 30504.


 Based on the data from the years 2002 - 2018 the average number of fire incidents per year is 19. The highest number of fires - 36 took place in 2011, and the least - 1 in 2004. The data has an increasing trend.
 When looking into fire subcategories, the most reports belonged to: Outside Fires (44.1%), and Structure Fires (38.8%).