Estimated zip code population in 2022: 4,881 Zip code population in 2010: 4,758 Zip code population in 2000: 3,750
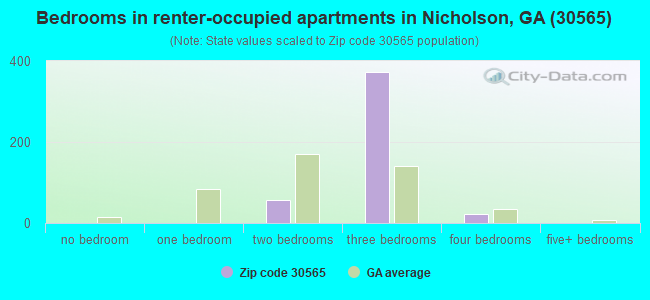
Houses and condos: 2,053 Renter-occupied apartments: 448
% of renters here:
25%
State:
34%
March 2022 cost of living index in zip code 30565: 82.2 (low, U.S. average is 100)
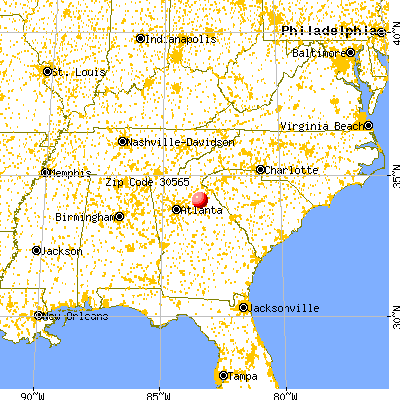
Land area: 34.1 sq. mi. Water area: 0.4 sq. mi.
Population density: 143 people per square mile
(very low).
OSM Map
General Map
Google Map
MSN Map
OSM Map
General Map
Google Map
MSN Map
OSM Map
General Map
Google Map
MSN Map
OSM Map
General Map
Google Map
MSN Map
Please wait while loading the map...
Real estate property taxes paid for housing units in 2022:
This zip code:
0.8% ($1,933)
Georgia:
0.7% ($2,160)
Median real estate property taxes paid for housing units with mortgages in 2022: $2,379 (0.9%) Median real estate property taxes paid for housing units with no mortgage in 2022: $1,451 (0.8%)
Business Search- 14 Million verified businesses
Males: 2,678
(54.9%)
Females: 2,200
(45.1%)
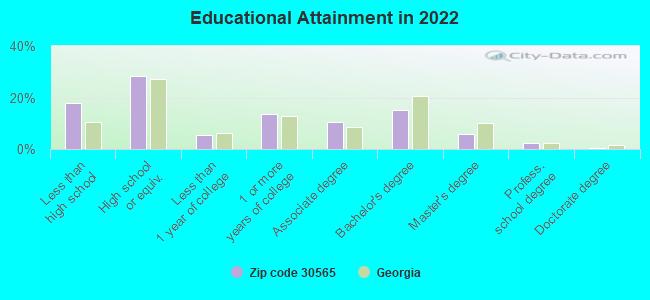
For population 25 years and over in 30565:
High school or higher: 81.8%
Bachelor's degree or higher: 24.0%
Graduate or professional degree: 8.7%
Unemployed: 5.1%
Mean travel time to work (commute): 24.7 minutes
For population 15 years and over in 30565:
Never married: 28.8%
Now married: 52.3%
Separated: 0.4%
Widowed: 5.8%
Divorced: 12.6%
Zip code 30565 compared to state average:
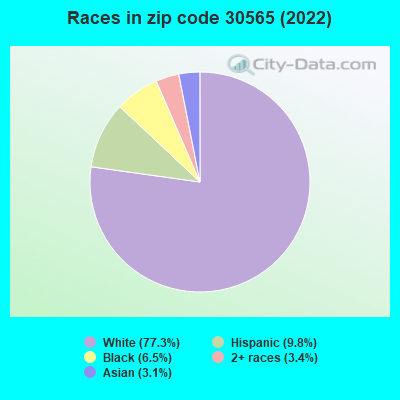
Black race population percentage significantly below state average.
Median age above state average.
Length of stay since moving in significantly above state average.
Averages for the 2020 tax year for zip code 30565, filed in 2021:
Average Adjusted Gross Income (AGI) in 2020: $51,964 (Individual Income Tax Returns)
Here:
$51,964
State:
$70,847
Salary/wage: $45,175 (reported on 84.5% of returns)
Here:
$45,175
State:
$59,126
(% of AGI for various income ranges: 1190.8% for AGIs below $25k, 3567.1% for AGIs $25k-50k, 6863.0% for AGIs $50k-75k, 10250.9% for AGIs $75k-100k, 18171.4% for AGIs $100k-200k)
Taxable interest for individuals: $902 (reported on 19.5% of returns)
This zip code:
$902
Georgia:
$2,011
(% of AGI for various income ranges: 6.3% for AGIs below $25k, 15.0% for AGIs $25k-50k, 16.1% for AGIs $50k-75k, 44.5% for AGIs $75k-100k, 91.4% for AGIs $100k-200k)
Ordinary dividends: $2,283 (reported on 10.5% of returns)
Here:
$2,283
State:
$8,996
(% of AGI for various income ranges: 8.3% for AGIs below $25k, 9.2% for AGIs $25k-50k, 25.7% for AGIs $50k-75k, 66.4% for AGIs $75k-100k, 210.7% for AGIs $100k-200k)
Net capital gain/loss in AGI: +$5,214 (reported on 10.0% of returns)
Here:
+$5,214
State:
+$28,402
(% of AGI for various income ranges: 1.0% for AGIs below $25k, 18.8% for AGIs $25k-50k, 32.6% for AGIs $50k-75k, 151.8% for AGIs $75k-100k, 572.1% for AGIs $100k-200k)
Profit/loss from business: +$6,611 (reported on 15.9% of returns)
Here:
+$6,611
State:
+$6,707
(% of AGI for various income ranges: 136.5% for AGIs below $25k, 94.6% for AGIs $25k-50k, 146.1% for AGIs $50k-75k, 546.4% for AGIs $100k-200k)
Taxable individual retirement arrangement distribution: $17,500 (reported on 6.8% of returns)
30565:
$17,500
Georgia:
$20,525
(% of AGI for various income ranges: 45.8% for AGIs below $25k, 71.2% for AGIs $25k-50k, 324.8% for AGIs $50k-75k, 880.7% for AGIs $100k-200k)
Total itemized deductions: $28,136 (reported on 6.4% of returns)
Here:
$28,136
State:
$34,001
(% of AGI for various income ranges: 210.2% for AGIs $25k-50k, 410.4% for AGIs $50k-75k, 1358.6% for AGIs $100k-200k)
Charity contributions: $9,073 (reported on 5.0% of returns)
Here:
$9,073
State:
$14,164
(% of AGI for various income ranges: 19.8% for AGIs $25k-50k, 80.4% for AGIs $50k-75k, 507.1% for AGIs $100k-200k)
Taxes paid: $6,179 (reported on 6.4% of returns)
30565:
$6,179
State:
$7,540
(% of AGI for various income ranges: 26.3% for AGIs $25k-50k, 90.4% for AGIs $50k-75k, 371.4% for AGIs $100k-200k)
Earned income credit: $2,406 (reported on 22.3% of returns)
Here:
$2,406
State:
$2,530
(% of AGI for various income ranges: 118.8% for AGIs below $25k, 89.6% for AGIs $25k-50k)
Percentage of individuals using paid preparers for their 2020 taxes: 93.2%
Here:
93%
State:
93%
(% for various income ranges: 93.6% for AGIs below $25k, 92.2% for AGIs $25k-50k, 96.8% for AGIs $50k-75k, 94.1% for AGIs $75k-100k, 92.3% for AGIs $100k-200k, 75.0% for AGIs over 200k)
Averages for the 2012 tax year for zip code 30565, filed in 2013:
Average Adjusted Gross Income (AGI) in 2012: $40,628 (Individual Income Tax Returns)
Here:
$40,628
State:
$56,131
Salary/wage: $37,163 (reported on 85.5% of returns)
Here:
$37,163
State:
$47,942
(% of AGI for various income ranges: 78.5% for AGIs below $25k, 81.1% for AGIs $25k-50k, 81.5% for AGIs $50k-75k, 77.3% for AGIs $75k-100k, 72.9% for AGIs $100k-200k)
Taxable interest for individuals: $887 (reported on 23.3% of returns)
This zip code:
$887
Georgia:
$1,706
(% of AGI for various income ranges: 0.6% for AGIs below $25k, 0.4% for AGIs $25k-50k, 1.0% for AGIs $50k-75k, 0.3% for AGIs $75k-100k, 0.2% for AGIs $100k-200k)
Ordinary dividends: $1,576 (reported on 10.9% of returns)
Here:
$1,576
State:
$7,265
(% of AGI for various income ranges: 0.4% for AGIs below $25k, 0.3% for AGIs $25k-50k, 0.4% for AGIs $50k-75k, 0.6% for AGIs $75k-100k, 0.4% for AGIs $100k-200k)
Net capital gain/loss in AGI: +$1,564 (reported on 7.3% of returns)
Here:
+$1,564
State:
+$16,323
(% of AGI for various income ranges: 0.7% for AGIs $75k-100k, 1.0% for AGIs $100k-200k)
Profit/loss from business: +$5,923 (reported on 16.1% of returns)
Here:
+$5,923
State:
+$7,583
(% of AGI for various income ranges: 8.7% for AGIs below $25k, 2.3% for AGIs $25k-50k, 1.2% for AGIs $75k-100k, 1.6% for AGIs $100k-200k)
Taxable individual retirement arrangement distribution: $11,123 (reported on 6.7% of returns)
30565:
$11,123
Georgia:
$17,199
(% of AGI for various income ranges: 2.1% for AGIs below $25k, 1.6% for AGIs $25k-50k, 2.2% for AGIs $50k-75k, 4.6% for AGIs $75k-100k)
Total itemized deductions: $17,765 (25% of AGI, reported on 28.0% of returns)
Here:
$17,765
State:
$23,886
Here:
24.7% of AGI
State:
21.5% of AGI
(% of AGI for various income ranges: 5.5% for AGIs below $25k, 9.9% for AGIs $25k-50k, 13.1% for AGIs $50k-75k, 15.8% for AGIs $75k-100k, 15.3% for AGIs $100k-200k)
Charity contributions: $3,200 (reported on 22.8% of returns)
Here:
$3,200
State:
$5,507
(% of AGI for various income ranges: 0.6% for AGIs below $25k, 1.6% for AGIs $25k-50k, 1.6% for AGIs $50k-75k, 2.4% for AGIs $75k-100k, 2.5% for AGIs $100k-200k)
Taxes paid: $5,496 (reported on 28.0% of returns)
30565:
$5,496
State:
$7,838
(% of AGI for various income ranges: 0.9% for AGIs below $25k, 2.4% for AGIs $25k-50k, 3.8% for AGIs $50k-75k, 4.8% for AGIs $75k-100k, 6.1% for AGIs $100k-200k)
Earned income credit: $2,458 (reported on 26.9% of returns)
Here:
$2,458
State:
$2,589
(% of AGI for various income ranges: 9.0% for AGIs below $25k, 1.6% for AGIs $25k-50k)
Percentage of individuals using paid preparers for their 2012 taxes: 54.9%
Here:
55%
State:
55%
(% for various income ranges: 53.0% for AGIs below $25k, 53.6% for AGIs $25k-50k, 53.8% for AGIs $50k-75k, 64.3% for AGIs $75k-100k, 64.3% for AGIs $100k-200k)
Averages for the 2004 tax year for zip code 30565, filed in 2005:
Average Adjusted Gross Income (AGI) in 2004: $36,491 (Individual Income Tax Returns)
Here:
$36,491
State:
$47,553
Salary/wage: $33,875 (reported on 87.0% of returns)
Here:
$33,875
State:
$42,178
(% of AGI for various income ranges: 100.5% for AGIs below $10k, 82.6% for AGIs $10k-25k, 88.1% for AGIs $25k-50k, 87.7% for AGIs $50k-75k, 85.4% for AGIs $75k-100k, 55.9% for AGIs over 100k)
Taxable interest for individuals: $993 (reported on 29.5% of returns)
This zip code:
$993
Georgia:
$1,772
(% of AGI for various income ranges: 3.8% for AGIs below $10k, 1.3% for AGIs $10k-25k, 0.7% for AGIs $25k-50k, 0.7% for AGIs $50k-75k, 0.5% for AGIs $75k-100k, 0.6% for AGIs over 100k)
Taxable dividends: $850 (reported on 12.5% of returns)
Here:
$850
State:
$4,283
(% of AGI for various income ranges: 0.6% for AGIs below $10k, 0.4% for AGIs $10k-25k, 0.3% for AGIs $25k-50k, 0.2% for AGIs $50k-75k, 0.2% for AGIs $75k-100k, 0.3% for AGIs over 100k)
Net capital gain/loss: +$5,782 (reported on 8.6% of returns)
Here:
+$5,782
State:
+$16,461
(% of AGI for various income ranges: 0.3% for AGIs $10k-25k, 0.3% for AGIs $25k-50k, 0.3% for AGIs $50k-75k, -0.1% for AGIs $75k-100k, 6.0% for AGIs over 100k)
Profit/loss from business: +$6,741 (reported on 16.6% of returns)
Here:
+$6,741
State:
+$8,201
(% of AGI for various income ranges: 8.2% for AGIs below $10k, 5.0% for AGIs $10k-25k, 2.8% for AGIs $25k-50k, 2.0% for AGIs $50k-75k, 0.4% for AGIs $75k-100k, 4.9% for AGIs over 100k)
IRA payment deduction: $2,588 (reported on 1.8% of returns)
30565:
$2,588
Georgia:
$2,969
(% of AGI for various income ranges: 1.3% for AGIs below $10k, 0.2% for AGIs $50k-75k, 0.3% for AGIs $75k-100k)
Total itemized deductions: $15,672 (24% of AGI, reported on 31.6% of returns)
Here:
$15,672
State:
$19,944
Here:
23.9% of AGI
State:
22.6% of AGI
(% of AGI for various income ranges: 13.3% for AGIs below $10k, 9.3% for AGIs $10k-25k, 12.8% for AGIs $25k-50k, 14.2% for AGIs $50k-75k, 17.8% for AGIs $75k-100k, 13.4% for AGIs over 100k)
Charity contributions deductions: $2,949 (4% of AGI, reported on 26.4% of returns)
Here:
$2,949
State:
$4,354
Here:
4.3% of AGI
State:
4.7% of AGI
(% of AGI for various income ranges: 0.9% for AGIs below $10k, 1.2% for AGIs $10k-25k, 1.5% for AGIs $25k-50k, 2.2% for AGIs $50k-75k, 2.2% for AGIs $75k-100k, 3.6% for AGIs over 100k)
Total tax: $4,286 (reported on 71.5% of returns)
30565:
$4,286
State:
$8,223
(% of AGI for various income ranges: 4.4% for AGIs below $10k, 4.0% for AGIs $10k-25k, 5.9% for AGIs $25k-50k, 8.0% for AGIs $50k-75k, 9.5% for AGIs $75k-100k, 14.9% for AGIs over 100k)
Earned income credit: $1,894 (reported on 22.6% of returns)
Here:
$1,894
State:
$1,986
Percentage of individuals using paid preparers for their 2004 taxes: 61.1%
Here:
61%
State:
62%
(% for various income ranges: 54.1% for AGIs below $10k, 63.5% for AGIs $10k-25k, 63.2% for AGIs $25k-50k, 62.3% for AGIs $50k-75k, 63.1% for AGIs $75k-100k, 61.0% for AGIs over 100k)
Likely homosexual households (counted as self-reported same-sex unmarried-partner households)
Lesbian couples: 0.2% of all households
Gay men: 0.0% of all households
Household received Food Stamps/SNAP in the past 12 months: 240 Household did not receive Food Stamps/SNAP in the past 12 months: 1,574
Women who had a birth in the past 12 months: 68 (56 now married, 12 unmarried) Women who did not have a birth in the past 12 months: 878 (447 now married, 430 unmarried)
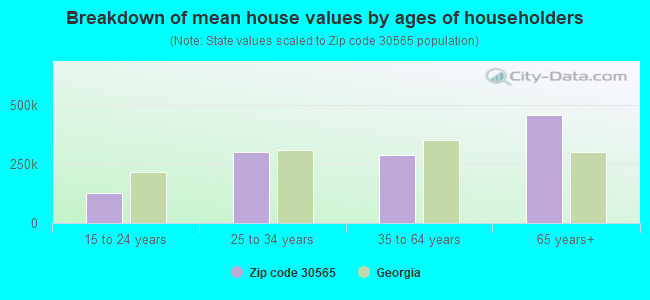
Housing units in zip code 30565 with a mortgage: 656 (45 second mortgage, 48 both second mortgage and home equity loan) Median monthly owner costs for units with a mortgage: $1,432 Median monthly owner costs for units without a mortgage: $417
Residents with income below the poverty level in 2022:
This zip code:
5.8%
Whole state:
12.7%
Residents with income below 50% of the poverty level in 2022:
This zip code:
2.4%
Whole state:
6.3%
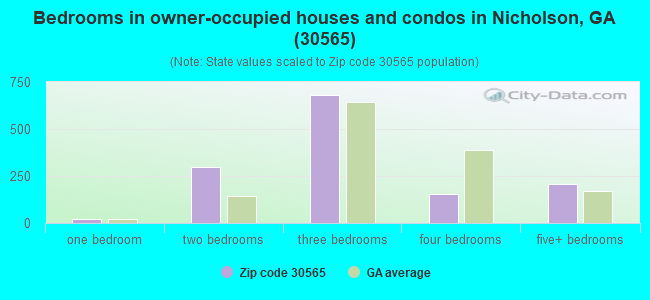
Median number of rooms in houses and condos:
Here:
6.3
State:
6.8
Median number of rooms in apartments:
Here:
5.3
State:
4.6
Notable locations in this zip code not listed on our city pages
Churches in zip code 30565 include: Huff Grove Church (A), Little Valley Church (B), New Harmony Church (C), Antioch Church (D). Display/hide their locations on the map
Cemeteries: Stapler Cemetery (1), Stone Cemetery (2), Antioch Cemetery (3), New Harmony Cemetery (4), Nicholson City Cemetery (5), Pittman Cemetery (6), Wilson Cemetery (7). Display/hide their locations on the map
Reservoirs: Lake Uamacutah (A), Hunnicutt Lake (B), Lake Yamacutah (C), Jarrett Lake (D), Reservoir Eight (E), Bishops Lake (F), Bishop Lake (G). Display/hide their locations on the map
Streams, rivers, and creeks: Curry Creek (A), Shankles Creek (B), Nowhere Branch (C), Long Branch (D), Little Sandy Creek (E), Cabin Creek (F). Display/hide their locations on the map
Size of family households: 489 2-persons, 220 3-persons, 280 4-persons, 113 5-persons, 71 6-persons
Size of nonfamily households: 403 1-person, 233 2-persons, 4 3-persons
565 married couples with children.
200 single-parent households (11 men, 189 women).
89.0% of residents of 30565 zip code speak English at home.
7.3% of residents speak Spanish at home (65% very well, 13% well, 15% not well, 8% not at all).
0.1% of residents speak other Indo-European language at home (100% very well).
3.3% of residents speak Asian or Pacific Island language at home (100% very well).
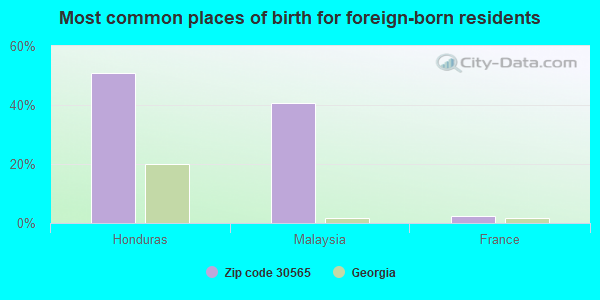
Foreign born population: 361 (7.4%) (54.0% of them are naturalized citizens)
This zip code:
7.4%
Whole state:
10.7%
51%Honduras
41%Malaysia
2%France
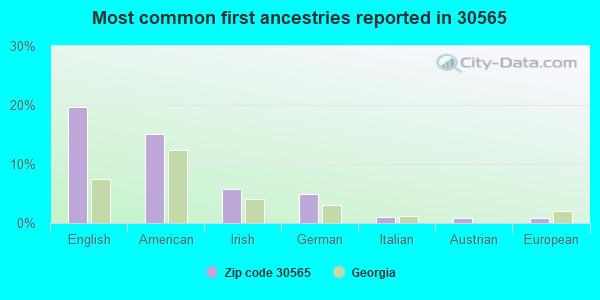
20%English
15%American
6%Irish
5%German
1%Italian
1%Austrian
1%European
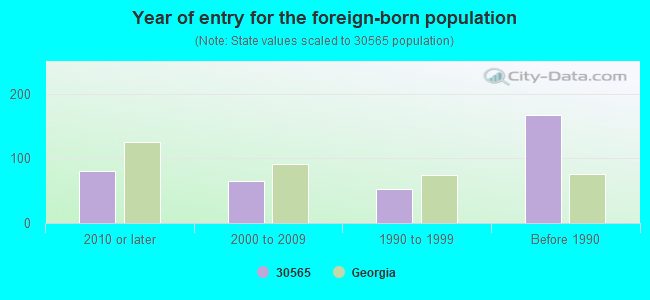
Year of entry for the foreign-born population
812010 or later
652000 to 2009
521990 to 1999
167Before 1990
Facilities with environmental interests located in this zip code:
BENTON ELEMENTARY SCHOOL (5488 U.S. HIGHWAY 441 SOUTH in NICHOLSON, GA)
(National Center for Education Statistics) - STATE ID-1050 Organizations: JACKSON COUNTY (SCHOOL DISTRICT)
Housing units lacking complete plumbing facilities: 0.5% Housing units lacking complete kitchen facilities: 3.1%
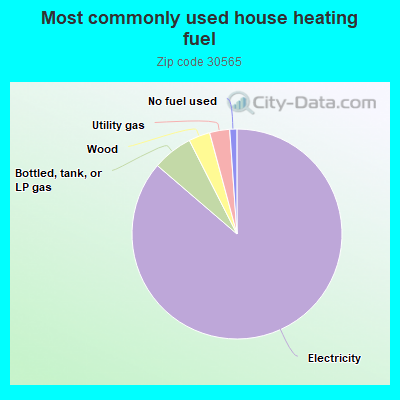
86.4%Electricity
6.2%Bottled, tank, or LP gas
3.3%Wood
3.1%Utility gas
1.1%No fuel used
Population in 1990: 3,352. Population change in the 1990s: +398 (+11.9%).
Place of birth for U.S.-born residents:
This state: 3,244
Northeast: 176
Midwest: 300
South: 639
West: 117
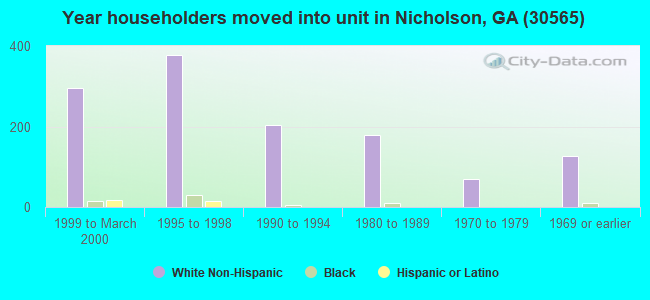
52% of the 30565 zip code residents lived in the same house 5 years ago. Out of people who lived in different houses, 42% lived in this county. Out of people who lived in different counties, 50% lived in Georgia.
93% of the 30565 zip code residents lived in the same house 1 year ago. Out of people who lived in different houses, 26% moved from this county. Out of people who lived in different houses, 66% moved from different county within same state. Out of people who lived in different houses, 6% moved from different state. Out of people who lived in different houses, 3% moved from abroad.
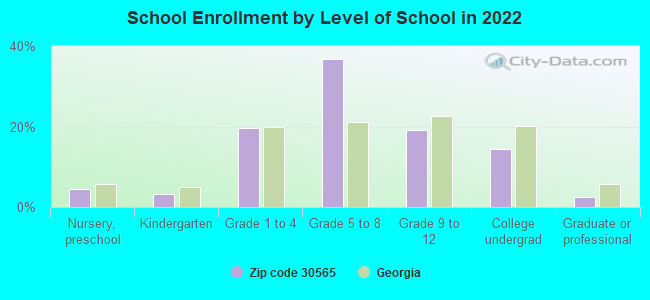
Private vs. public school enrollment:
Students in private schools in grades 1 to 8 (elementary and middle school): 10
Here:
1.8%
Georgia:
12.1%
Students in private schools in grades 9 to 12 (high school): 29
Here:
15.0%
Georgia:
10.8%
Students in private undergraduate colleges: 7
Here:
5.2%
Georgia:
17.1%
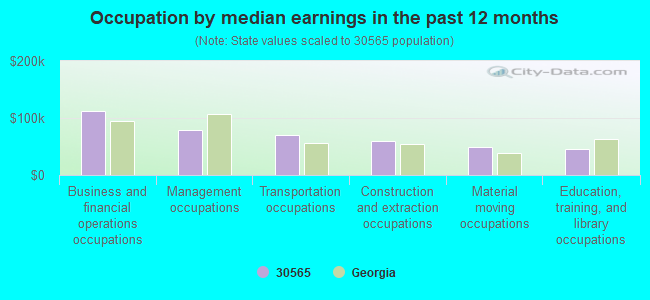
Occupation by median earnings in the past 12 months ($)
113,110Business and financial operations occupations
79,214Management occupations
69,364Transportation occupations
59,688Construction and extraction occupations
48,313Material moving occupations
46,183Education, training, and library occupations
Top industries in this zip code by the number of employees in 2005:
Construction: Tile and Terrazzo Contractors (20-49 employees: 2 establishments)
Construction: Drywall and Insulation Contractors (10-19: 1, 1-4: 1)
Administrative and Support and Waste Management and Remediation Services: Landscaping Services (5-9: 1, 1-4: 1)
Construction: Commercial and Institutional Building Construction (5-9: 1, 1-4: 1)
Real Estate and Rental and Leasing: Truck, Utility Trailer, and RV (Recreational Vehicle) Rental and Leasing (5-9: 1)
Construction: Masonry Contractors (5-9: 1)
Construction: Flooring Contractors (5-9: 1)
Fatal accident statistics in 2014:
Fatal accident count: 2
Vehicles involved in fatal accidents: 2
Fatal accidents caused by drunken drivers: 0
Fatalities: 2
Persons involved in fatal accidents: 2
Pedestrians involved in fatal accidents: 1
Fatal accident statistics in 2012:
Fatal accident count: 1
Vehicles involved in fatal accidents: 1
Fatal accidents caused by drunken drivers: 0
Fatalities: 1
Persons involved in fatal accidents: 1
Pedestrians involved in fatal accidents: 1
2002 - 2018 National Fire Incident Reporting System (NFIRS) incidents
According to the data from the years 2002 - 2018 the average number of fires per year is 15. The highest number of fires - 44 took place in 2017, and the least - 1 in 2006. The data has an increasing trend.
When looking into fire subcategories, the most incidents belonged to: Structure Fires (60.3%), and Outside Fires (28.6%).
Fire incident types reported to NFIRS in Zip Code 30565


 Nearest zip codes: 30607, 30601, 30646, 30530, 30609, 30602.


 According to the data from the years 2002 - 2018 the average number of fires per year is 15. The highest number of fires - 44 took place in 2017, and the least - 1 in 2006. The data has an increasing trend.
 When looking into fire subcategories, the most incidents belonged to: Structure Fires (60.3%), and Outside Fires (28.6%).