Estimated zip code population in 2022: 15,648 Zip code population in 2010: 12,486 Zip code population in 2000: 5,354
Houses and condos: 5,077 Renter-occupied apartments: 871
% of renters here:
17%
State:
34%
March 2022 cost of living index in zip code 30620: 101.7 (near average, U.S. average is 100)
Land area: 23.8 sq. mi. Water area: 0.9 sq. mi.
Population density: 658 people per square mile
(low).
OSM Map
General Map
Google Map
MSN Map
OSM Map
General Map
Google Map
MSN Map
OSM Map
General Map
Google Map
MSN Map
OSM Map
General Map
Google Map
MSN Map
Please wait while loading the map...
Real estate property taxes paid for housing units in 2022:
This zip code:
0.8% ($2,301)
Georgia:
0.7% ($2,160)
Median real estate property taxes paid for housing units with mortgages in 2022: $2,339 (0.8%) Median real estate property taxes paid for housing units with no mortgage in 2022: $2,096 (0.7%)
Estimated median house/condo value in 2022: $299,214
30620:
$299,214
Georgia:
$297,400
According to our research of Georgia and other state lists, there were 26 registered sex offenders living in 30620 zip code as of May 28, 2024. The ratio of all residents to sex offenders in zip code 30620 is 485 to 1. The ratio of registered sex offenders to all residents in this zip code is lower than the state average.
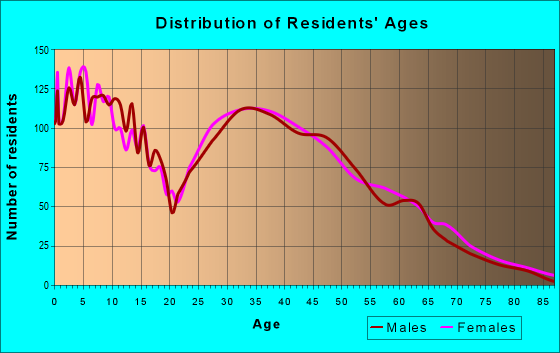
Median resident age:
This zip code:
34.4 years
Georgia median age:
37.6 years
Average household size:
This zip code:
3.2 people
Georgia:
2.6 people
Averages for the 2020 tax year for zip code 30620, filed in 2021:
Average Adjusted Gross Income (AGI) in 2020: $56,445 (Individual Income Tax Returns)
Here:
$56,445
State:
$70,847
Salary/wage: $52,320 (reported on 86.2% of returns)
Here:
$52,320
State:
$59,126
(% of AGI for various income ranges: 1194.4% for AGIs below $25k, 3755.5% for AGIs $25k-50k, 7096.2% for AGIs $50k-75k, 9926.8% for AGIs $75k-100k, 19112.8% for AGIs $100k-200k, 55980.0% for AGIs over 200k)
Taxable interest for individuals: $767 (reported on 15.5% of returns)
This zip code:
$767
Georgia:
$2,011
(% of AGI for various income ranges: 6.9% for AGIs below $25k, 8.4% for AGIs $25k-50k, 12.8% for AGIs $50k-75k, 9.4% for AGIs $75k-100k, 35.0% for AGIs $100k-200k, 652.5% for AGIs over 200k)
Ordinary dividends: $2,239 (reported on 10.0% of returns)
Here:
$2,239
State:
$8,996
(% of AGI for various income ranges: 8.1% for AGIs below $25k, 8.0% for AGIs $25k-50k, 22.3% for AGIs $50k-75k, 33.4% for AGIs $75k-100k, 148.7% for AGIs $100k-200k, 412.5% for AGIs over 200k)
Net capital gain/loss in AGI: +$9,239 (reported on 8.6% of returns)
Here:
+$9,239
State:
+$28,402
(% of AGI for various income ranges: 4.9% for AGIs below $25k, 10.4% for AGIs $25k-50k, 32.6% for AGIs $50k-75k, 83.9% for AGIs $75k-100k, 263.1% for AGIs $100k-200k, 8527.5% for AGIs over 200k)
Profit/loss from business: +$6,188 (reported on 22.7% of returns)
Here:
+$6,188
State:
+$6,707
(% of AGI for various income ranges: 153.3% for AGIs below $25k, 207.7% for AGIs $25k-50k, 164.5% for AGIs $50k-75k, 108.9% for AGIs $75k-100k, 245.2% for AGIs $100k-200k, 2290.0% for AGIs over 200k)
Taxable individual retirement arrangement distribution: $13,919 (reported on 4.3% of returns)
30620:
$13,919
Georgia:
$20,525
(% of AGI for various income ranges: 27.8% for AGIs below $25k, 38.2% for AGIs $25k-50k, 70.0% for AGIs $50k-75k, 158.7% for AGIs $75k-100k, 318.0% for AGIs $100k-200k)
Total itemized deductions: $28,396 (reported on 9.9% of returns)
Here:
$28,396
State:
$34,001
(% of AGI for various income ranges: 45.4% for AGIs below $25k, 182.0% for AGIs $25k-50k, 428.2% for AGIs $50k-75k, 548.2% for AGIs $75k-100k, 1022.0% for AGIs $100k-200k, 10202.5% for AGIs over 200k)
Charity contributions: $11,476 (reported on 8.0% of returns)
Here:
$11,476
State:
$14,164
(% of AGI for various income ranges: 5.9% for AGIs below $25k, 37.7% for AGIs $25k-50k, 75.1% for AGIs $50k-75k, 119.8% for AGIs $75k-100k, 332.4% for AGIs $100k-200k, 7067.5% for AGIs over 200k)
Taxes paid: $6,830 (reported on 9.9% of returns)
30620:
$6,830
State:
$7,540
(% of AGI for various income ranges: 7.6% for AGIs below $25k, 36.8% for AGIs $25k-50k, 111.2% for AGIs $50k-75k, 164.4% for AGIs $75k-100k, 305.6% for AGIs $100k-200k, 1357.5% for AGIs over 200k)
Earned income credit: $2,491 (reported on 18.8% of returns)
Here:
$2,491
State:
$2,530
(% of AGI for various income ranges: 113.7% for AGIs below $25k, 93.3% for AGIs $25k-50k, 2.1% for AGIs $50k-75k)
Percentage of individuals using paid preparers for their 2020 taxes: 93.8%
Here:
94%
State:
93%
(% for various income ranges: 92.2% for AGIs below $25k, 94.2% for AGIs $25k-50k, 94.6% for AGIs $50k-75k, 94.0% for AGIs $75k-100k, 94.7% for AGIs $100k-200k, 100.0% for AGIs over 200k)
Averages for the 2012 tax year for zip code 30620, filed in 2013:
Average Adjusted Gross Income (AGI) in 2012: $48,353 (Individual Income Tax Returns)
Here:
$48,353
State:
$56,131
Salary/wage: $44,465 (reported on 89.0% of returns)
Here:
$44,465
State:
$47,942
(% of AGI for various income ranges: 78.0% for AGIs below $25k, 87.7% for AGIs $25k-50k, 87.2% for AGIs $50k-75k, 87.9% for AGIs $75k-100k, 82.7% for AGIs $100k-200k, 40.3% for AGIs over 200k)
Taxable interest for individuals: $832 (reported on 20.1% of returns)
This zip code:
$832
Georgia:
$1,706
(% of AGI for various income ranges: 0.6% for AGIs below $25k, 0.3% for AGIs $25k-50k, 0.2% for AGIs $50k-75k, 0.2% for AGIs $75k-100k, 0.2% for AGIs $100k-200k, 1.3% for AGIs over 200k)
Ordinary dividends: $3,421 (reported on 12.0% of returns)
Here:
$3,421
State:
$7,265
(% of AGI for various income ranges: 0.7% for AGIs below $25k, 0.3% for AGIs $25k-50k, 0.3% for AGIs $50k-75k, 0.6% for AGIs $75k-100k, 0.7% for AGIs $100k-200k, 4.8% for AGIs over 200k)
Net capital gain/loss in AGI: +$1,547 (reported on 7.1% of returns)
Here:
+$1,547
State:
+$16,323
(% of AGI for various income ranges: 0.5% for AGIs $75k-100k, 0.4% for AGIs $100k-200k, 0.6% for AGIs over 200k)
Profit/loss from business: +$6,198 (reported on 18.3% of returns)
Here:
+$6,198
State:
+$7,583
(% of AGI for various income ranges: 9.1% for AGIs below $25k, 2.3% for AGIs $25k-50k, 2.6% for AGIs $50k-75k, 0.7% for AGIs $75k-100k, 1.3% for AGIs $100k-200k)
Taxable individual retirement arrangement distribution: $12,128 (reported on 5.7% of returns)
30620:
$12,128
Georgia:
$17,199
(% of AGI for various income ranges: 1.9% for AGIs below $25k, 1.3% for AGIs $25k-50k, 0.9% for AGIs $50k-75k, 1.2% for AGIs $75k-100k, 2.6% for AGIs $100k-200k)
Total itemized deductions: $17,717 (23% of AGI, reported on 41.3% of returns)
Here:
$17,717
State:
$23,886
Here:
23.2% of AGI
State:
21.5% of AGI
(% of AGI for various income ranges: 10.2% for AGIs below $25k, 15.3% for AGIs $25k-50k, 16.8% for AGIs $50k-75k, 16.6% for AGIs $75k-100k, 16.8% for AGIs $100k-200k, 8.5% for AGIs over 200k)
Charity contributions: $3,123 (reported on 33.1% of returns)
Here:
$3,123
State:
$5,507
(% of AGI for various income ranges: 0.9% for AGIs below $25k, 1.5% for AGIs $25k-50k, 2.3% for AGIs $50k-75k, 2.2% for AGIs $75k-100k, 3.0% for AGIs $100k-200k, 2.3% for AGIs over 200k)
Taxes paid: $5,131 (reported on 41.1% of returns)
30620:
$5,131
State:
$7,838
(% of AGI for various income ranges: 1.4% for AGIs below $25k, 3.0% for AGIs $25k-50k, 4.5% for AGIs $50k-75k, 5.2% for AGIs $75k-100k, 6.1% for AGIs $100k-200k, 4.4% for AGIs over 200k)
Earned income credit: $2,324 (reported on 22.8% of returns)
Here:
$2,324
State:
$2,589
(% of AGI for various income ranges: 8.0% for AGIs below $25k, 1.6% for AGIs $25k-50k)
Percentage of individuals using paid preparers for their 2012 taxes: 46.3%
Here:
46%
State:
55%
(% for various income ranges: 45.7% for AGIs below $25k, 43.0% for AGIs $25k-50k, 46.7% for AGIs $50k-75k, 50.0% for AGIs $75k-100k, 51.3% for AGIs $100k-200k, 75.0% for AGIs over 200k)
Averages for the 2004 tax year for zip code 30620, filed in 2005:
Average Adjusted Gross Income (AGI) in 2004: $43,705 (Individual Income Tax Returns)
Here:
$43,705
State:
$47,553
Salary/wage: $41,467 (reported on 90.7% of returns)
Here:
$41,467
State:
$42,178
(% of AGI for various income ranges: 126.0% for AGIs below $10k, 81.5% for AGIs $10k-25k, 92.1% for AGIs $25k-50k, 91.9% for AGIs $50k-75k, 90.9% for AGIs $75k-100k, 64.8% for AGIs over 100k)
Taxable interest for individuals: $688 (reported on 29.9% of returns)
This zip code:
$688
Georgia:
$1,772
(% of AGI for various income ranges: 3.7% for AGIs below $10k, 1.1% for AGIs $10k-25k, 0.4% for AGIs $25k-50k, 0.2% for AGIs $50k-75k, 0.3% for AGIs $75k-100k, 0.6% for AGIs over 100k)
Taxable dividends: $1,121 (reported on 13.1% of returns)
Here:
$1,121
State:
$4,283
(% of AGI for various income ranges: 1.9% for AGIs below $10k, 0.4% for AGIs $10k-25k, 0.1% for AGIs $25k-50k, 0.1% for AGIs $50k-75k, 0.3% for AGIs $75k-100k, 0.9% for AGIs over 100k)
Net capital gain/loss: +$11,535 (reported on 8.6% of returns)
Here:
+$11,535
State:
+$16,461
(% of AGI for various income ranges: 1.8% for AGIs below $10k, -0.0% for AGIs $10k-25k, 0.4% for AGIs $25k-50k, 0.0% for AGIs $50k-75k, 1.6% for AGIs $75k-100k, 9.6% for AGIs over 100k)
Profit/loss from business: +$6,408 (reported on 17.3% of returns)
Here:
+$6,408
State:
+$8,201
(% of AGI for various income ranges: 9.2% for AGIs below $10k, 7.3% for AGIs $10k-25k, 1.9% for AGIs $25k-50k, 2.0% for AGIs $50k-75k, 1.3% for AGIs $75k-100k, 2.9% for AGIs over 100k)
IRA payment deduction: $2,813 (reported on 1.9% of returns)
30620:
$2,813
Georgia:
$2,969
(% of AGI for various income ranges: 0.2% for AGIs $25k-50k, 0.1% for AGIs $50k-75k, 0.2% for AGIs $75k-100k, 0.1% for AGIs over 100k)
Self-employed pension: $5,417 (reported on 0.3% of returns)
Here:
$5,417
Georgia:
$16,203
Total itemized deductions: $15,451 (25% of AGI, reported on 52.6% of returns)
Here:
$15,451
State:
$19,944
Here:
25.0% of AGI
State:
22.6% of AGI
(% of AGI for various income ranges: 22.2% for AGIs below $10k, 15.3% for AGIs $10k-25k, 20.5% for AGIs $25k-50k, 20.0% for AGIs $50k-75k, 18.1% for AGIs $75k-100k, 15.5% for AGIs over 100k)
Charity contributions deductions: $2,507 (4% of AGI, reported on 43.2% of returns)
Here:
$2,507
State:
$4,354
Here:
3.9% of AGI
State:
4.7% of AGI
(% of AGI for various income ranges: 1.0% for AGIs below $10k, 1.7% for AGIs $10k-25k, 2.3% for AGIs $25k-50k, 2.3% for AGIs $50k-75k, 2.6% for AGIs $75k-100k, 3.3% for AGIs over 100k)
Total tax: $4,961 (reported on 77.5% of returns)
30620:
$4,961
State:
$8,223
(% of AGI for various income ranges: 4.7% for AGIs below $10k, 4.1% for AGIs $10k-25k, 6.1% for AGIs $25k-50k, 7.4% for AGIs $50k-75k, 9.2% for AGIs $75k-100k, 16.5% for AGIs over 100k)
Earned income credit: $1,831 (reported on 16.5% of returns)
Here:
$1,831
State:
$1,986
Percentage of individuals using paid preparers for their 2004 taxes: 56.6%
Here:
57%
State:
62%
(% for various income ranges: 51.7% for AGIs below $10k, 62.3% for AGIs $10k-25k, 55.4% for AGIs $25k-50k, 55.2% for AGIs $50k-75k, 54.1% for AGIs $75k-100k, 63.1% for AGIs over 100k)
Likely homosexual households (counted as self-reported same-sex unmarried-partner households)
Lesbian couples: 0.1% of all households
Gay men: 0.0% of all households
Household received Food Stamps/SNAP in the past 12 months: 642 Household did not receive Food Stamps/SNAP in the past 12 months: 4,343
Women who had a birth in the past 12 months: 271 (242 now married, 29 unmarried) Women who did not have a birth in the past 12 months: 3,635 (1,847 now married, 1,783 unmarried)
Housing units in zip code 30620 with a mortgage: 2,966 (128 second mortgage, 50 both second mortgage and home equity loan) Houses without a mortgage: 4
Median monthly owner costs for units with a mortgage: $1,488 Median monthly owner costs for units without a mortgage: $471
Residents with income below the poverty level in 2022:
This zip code:
9.2%
Whole state:
12.7%
Residents with income below 50% of the poverty level in 2022:
This zip code:
4.3%
Whole state:
6.3%
Median number of rooms in houses and condos:
Here:
6.8
State:
6.8
Median number of rooms in apartments:
Here:
5.3
State:
4.6
Notable locations in this zip code not listed on our city pages
Churches in zip code 30620 include: Ebenezer Church (A), Bethlehem African Methodist Episcopal Zion Church (B), Omer Church (C), Carter Hill Church (D), Bethlehem Church (E), Bethel Church (F), Apalachee Shoals Church (G). Display/hide their locations on the map
In group quarters: 3 (-1 institutionalized population)
Size of family households: 1,140 2-persons, 1,072 3-persons, 572 4-persons, 484 5-persons, 469 6-persons, 130 7-or-more-persons
Size of nonfamily households: 884 1-person, 251 2-persons, 21 3-persons
2,786 married couples with children.
1,452 single-parent households (355 men, 1,097 women).
80.0% of residents of 30620 zip code speak English at home.
14.2% of residents speak Spanish at home (75% very well, 11% well, 9% not well, 4% not at all).
2.6% of residents speak other Indo-European language at home (75% very well, 21% well, 3% not well).
2.2% of residents speak Asian or Pacific Island language at home (42% very well, 42% well, 11% not well, 4% not at all).
0.6% of residents speak other language at home (42% very well, 41% well, 17% not at all).
Foreign born population: 1,718 (11.0%) (48.7% of them are naturalized citizens)
This zip code:
11.0%
Whole state:
10.7%
36%Honduras
13%Grenada
8%Colombia
7%Dominica
5%Haiti
5%Indonesia
5%Chile
16%English
12%American
7%German
4%Polish
3%Irish
3%European
3%Haitian
Year of entry for the foreign-born population
5542010 or later
4342000 to 2009
6341990 to 1999
390Before 1990
Facilities with environmental interests located in this zip code:
KANGAROO #29 (634 CHRISTMAS AVE in BETHLEHEM, GA)
STATE MASTER (Georgia's Geographic Environmental Information) - UST-1, UNDERGROUND STORAGE TANK PROGRAM, UST-2, UST-3, (Resource Conservation and Recovery Act (tracking hazardous waste)) Organizations: THE PANTRY INC (CONTACT/OPERATOR)
, KANGAROO #29 (CONTACT/OWNER)
, THE PUMP SHOP (INSTALLER)
Alternative names: PANTRY 3325, PANTRY 3325 DBA KANGAROO
BETHLEHEM ELEMENTARY SCHOOL (54 STAR STREET WEST in BETHLEHEM, GA)
(Geographic Names Information System) (National Center for Education Statistics) - STATE ID-2050 Organizations: BARROW COUNTY (SCHOOL DISTRICT)
PAT'S TAVERN/DAN MYERS DUMP SITE (1093 MONROE HWY (GA 11) in BETHLEHEM, GA)
(Resource Conservation and Recovery Act (tracking hazardous waste)) Organizations: DAN MYERS (DUMPER AT TAVERN) (CONTACT/OWNER)
AUTOMATED PACKAGING INC (737 HARRY MCCARTY RD. SUITE 403 in BETHLEHEM, GA)
CRITERIA AND HAZARDOUS AIR POLLUTANT INVENTORY (Inventory of air pollution sources) TRI REPORTER (Tracking of toxic chemicals releasing facilities) Business SIC classification: SOAP AND OTHER DETERGENTS, EXCEPT SPECIALTY CLEANERS; SPECIALTY CLEANING, POLISHING, AND SANITATION PREPARATIONS
Housing units lacking complete plumbing facilities: 2.5% Housing units lacking complete kitchen facilities: 2.0%
83.7%Electricity
10.0%Utility gas
3.1%Bottled, tank, or LP gas
1.7%No fuel used
1.4%Wood
Population in 1990: 2,181. Population change in the 1990s: +3,173 (+145.5%).
Place of birth for U.S.-born residents:
This state: 8,262
Northeast: 1,382
Midwest: 1,140
South: 2,322
West: 492
46% of the 30620 zip code residents lived in the same house 5 years ago. Out of people who lived in different houses, 31% lived in this county. Out of people who lived in different counties, 50% lived in Georgia.
89% of the 30620 zip code residents lived in the same house 1 year ago. Out of people who lived in different houses, 20% moved from this county. Out of people who lived in different houses, 77% moved from different county within same state. Out of people who lived in different houses, 1% moved from abroad.
Private vs. public school enrollment:
Students in private schools in grades 1 to 8 (elementary and middle school): 345
Here:
13.5%
Georgia:
12.1%
Students in private schools in grades 9 to 12 (high school): 143
Here:
12.2%
Georgia:
10.8%
Students in private undergraduate colleges: 54
Here:
10.3%
Georgia:
17.1%
Occupation by median earnings in the past 12 months ($)
118,454Fire fighting and prevention, and other protective service workers including supervisors
103,932Life, physical, and social science occupations
101,645Computer and mathematical occupations
68,492Community and social service occupations
67,526Health diagnosing and treating practitioners and other technical occupations
65,249Construction and extraction occupations
Top industries in this zip code by the number of employees in 2005:
Construction: Poured Concrete Foundation and Structure Contractors (100-249 employees: 1 establishment)
Other Services (except Public Administration): Religious Organizations (20-49: 1, 10-19: 1, 5-9: 1, 1-4: 1)
Administrative and Support and Waste Management and Remediation Services: Landscaping Services (10-19: 1, 1-4: 4)
Construction: New Single-Family Housing Construction (except Operative Builders) (5-9: 2, 1-4: 4)
Construction: Drywall and Insulation Contractors (10-19: 1, 1-4: 1)
Construction: New Housing Operative Builders (10-19: 1, 1-4: 1)
Construction: Commercial and Institutional Building Construction (5-9: 2)
Fatal accident statistics in 2014:
Fatal accident count: 4
Vehicles involved in fatal accidents: 7
Fatal accidents caused by drunken drivers: 1
Fatalities: 4
Persons involved in fatal accidents: 10
Pedestrians involved in fatal accidents: 0
Fatal accident statistics in 2013:
Fatal accident count: 1
Vehicles involved in fatal accidents: 2
Fatal accidents caused by drunken drivers: 0
Fatalities: 1
Persons involved in fatal accidents: 2
Pedestrians involved in fatal accidents: 0
Home Mortgage Disclosure Act Aggregated Statistics For Year 2009 (Based on 2 partial tracts)
A) FHA, FSA/RHS & VA Home Purchase Loans
B) Conventional Home Purchase Loans
C) Refinancings
D) Home Improvement Loans
F) Non-occupant Loans on < 5 Family Dwellings (A B C & D)
G) Loans On Manufactured Home Dwelling (A B C & D)
Number
Average Value
Number
Average Value
Number
Average Value
Number
Average Value
Number
Average Value
Number
Average Value
LOANS ORIGINATED
126
$122,948
31
$110,489
237
$132,997
3
$70,340
27
$139,282
13
$61,102
APPLICATIONS APPROVED, NOT ACCEPTED
4
$111,982
1
$5,970
30
$145,793
2
$67,685
0
$0
1
$5,970
APPLICATIONS DENIED
25
$119,806
5
$88,392
148
$134,984
15
$53,751
6
$88,425
11
$100,897
APPLICATIONS WITHDRAWN
14
$124,141
2
$101,035
79
$135,022
3
$8,627
1
$99,540
0
$0
FILES CLOSED FOR INCOMPLETENESS
7
$88,449
0
$0
22
$149,039
2
$114,470
0
$0
0
$0
Aggregated Statistics For Year 2008 (Based on 2 partial tracts)
A) FHA, FSA/RHS & VA Home Purchase Loans
B) Conventional Home Purchase Loans
C) Refinancings
D) Home Improvement Loans
F) Non-occupant Loans on < 5 Family Dwellings (A B C & D)
G) Loans On Manufactured Home Dwelling (A B C & D)
Number
Average Value
Number
Average Value
Number
Average Value
Number
Average Value
Number
Average Value
Number
Average Value
LOANS ORIGINATED
144
$137,013
95
$123,094
178
$132,254
18
$64,037
49
$96,493
17
$65,696
APPLICATIONS APPROVED, NOT ACCEPTED
8
$144,332
10
$142,442
40
$138,012
9
$39,373
2
$122,930
2
$86,600
APPLICATIONS DENIED
18
$138,692
27
$133,679
185
$152,969
39
$55,155
13
$84,915
4
$88,590
APPLICATIONS WITHDRAWN
11
$135,465
13
$123,200
76
$139,042
8
$92,696
3
$122,103
2
$109,990
FILES CLOSED FOR INCOMPLETENESS
2
$127,910
2
$162,250
16
$137,863
1
$7,960
1
$87,600
1
$74,660
Aggregated Statistics For Year 2007 (Based on 2 partial tracts)
A) FHA, FSA/RHS & VA Home Purchase Loans
B) Conventional Home Purchase Loans
C) Refinancings
D) Home Improvement Loans
F) Non-occupant Loans on < 5 Family Dwellings (A B C & D)
G) Loans On Manufactured Home Dwelling (A B C & D)
Number
Average Value
Number
Average Value
Number
Average Value
Number
Average Value
Number
Average Value
Number
Average Value
LOANS ORIGINATED
84
$145,032
333
$121,747
295
$115,483
36
$61,770
63
$101,357
25
$63,944
APPLICATIONS APPROVED, NOT ACCEPTED
1
$112,480
29
$133,933
66
$130,699
5
$23,094
4
$101,282
3
$101,200
APPLICATIONS DENIED
14
$141,844
84
$118,322
304
$131,638
49
$55,966
28
$102,171
13
$81,699
APPLICATIONS WITHDRAWN
8
$131,518
31
$135,824
115
$156,330
5
$66,294
3
$162,583
4
$84,858
FILES CLOSED FOR INCOMPLETENESS
0
$0
8
$182,408
35
$152,296
2
$14,930
1
$107,500
0
$0
Aggregated Statistics For Year 2006 (Based on 2 partial tracts)
A) FHA, FSA/RHS & VA Home Purchase Loans
B) Conventional Home Purchase Loans
C) Refinancings
D) Home Improvement Loans
F) Non-occupant Loans on < 5 Family Dwellings (A B C & D)
G) Loans On Manufactured Home Dwelling (A B C & D)
Number
Average Value
Number
Average Value
Number
Average Value
Number
Average Value
Number
Average Value
Number
Average Value
LOANS ORIGINATED
82
$140,084
458
$102,235
293
$108,441
42
$34,318
92
$89,056
21
$59,819
APPLICATIONS APPROVED, NOT ACCEPTED
1
$63,710
28
$105,975
87
$114,288
13
$37,672
4
$79,632
3
$44,460
APPLICATIONS DENIED
7
$117,173
117
$106,729
308
$116,759
54
$31,060
19
$93,777
4
$59,475
APPLICATIONS WITHDRAWN
9
$146,988
37
$109,359
161
$131,875
8
$37,328
4
$65,945
2
$111,985
FILES CLOSED FOR INCOMPLETENESS
0
$0
16
$95,496
48
$141,928
2
$14,930
1
$114,470
0
$0
Aggregated Statistics For Year 2005 (Based on 2 partial tracts)
A) FHA, FSA/RHS & VA Home Purchase Loans
B) Conventional Home Purchase Loans
C) Refinancings
D) Home Improvement Loans
F) Non-occupant Loans on < 5 Family Dwellings (A B C & D)
G) Loans On Manufactured Home Dwelling (A B C & D)
Number
Average Value
Number
Average Value
Number
Average Value
Number
Average Value
Number
Average Value
Number
Average Value
LOANS ORIGINATED
140
$135,773
633
$92,280
369
$107,986
43
$32,663
93
$89,896
26
$70,673
APPLICATIONS APPROVED, NOT ACCEPTED
2
$132,390
39
$88,744
72
$102,678
6
$13,770
4
$59,228
0
$0
APPLICATIONS DENIED
2
$117,455
110
$89,378
321
$117,234
51
$39,855
20
$90,780
28
$68,754
APPLICATIONS WITHDRAWN
13
$134,149
66
$92,497
212
$131,844
22
$110,851
12
$98,047
1
$39,820
FILES CLOSED FOR INCOMPLETENESS
1
$144,330
18
$111,540
57
$142,918
3
$82,950
2
$68,185
4
$79,135
Aggregated Statistics For Year 2004 (Based on 2 partial tracts)
A) FHA, FSA/RHS & VA Home Purchase Loans
B) Conventional Home Purchase Loans
C) Refinancings
D) Home Improvement Loans
F) Non-occupant Loans on < 5 Family Dwellings (A B C & D)
G) Loans On Manufactured Home Dwelling (A B C & D)
Number
Average Value
Number
Average Value
Number
Average Value
Number
Average Value
Number
Average Value
Number
Average Value
LOANS ORIGINATED
160
$134,006
349
$96,879
346
$110,469
43
$26,621
80
$83,253
20
$54,250
APPLICATIONS APPROVED, NOT ACCEPTED
0
$0
26
$107,580
56
$113,956
4
$22,645
4
$83,365
3
$81,953
APPLICATIONS DENIED
14
$129,900
45
$103,433
261
$111,294
46
$47,130
11
$99,449
12
$88,092
APPLICATIONS WITHDRAWN
15
$127,212
34
$107,445
111
$114,005
9
$37,493
7
$78,779
7
$84,751
FILES CLOSED FOR INCOMPLETENESS
0
$0
11
$105,875
45
$115,356
6
$35,668
1
$89,590
3
$68,350
Aggregated Statistics For Year 2003 (Based on 2 partial tracts)
A) FHA, FSA/RHS & VA Home Purchase Loans
B) Conventional Home Purchase Loans
C) Refinancings
D) Home Improvement Loans
F) Non-occupant Loans on < 5 Family Dwellings (A B C & D)
Detailed PMIC statistics for the following Tracts:1805.00
2002 - 2018 National Fire Incident Reporting System (NFIRS) incidents
Based on the data from the years 2002 - 2018 the average number of fire incidents per year is 21. The highest number of reported fires - 55 took place in 2011, and the least - 0 in 2005. The data has an increasing trend.
When looking into fire subcategories, the most reports belonged to: Outside Fires (58.0%), and Structure Fires (24.2%).
Fire incident types reported to NFIRS in Zip Code 30620
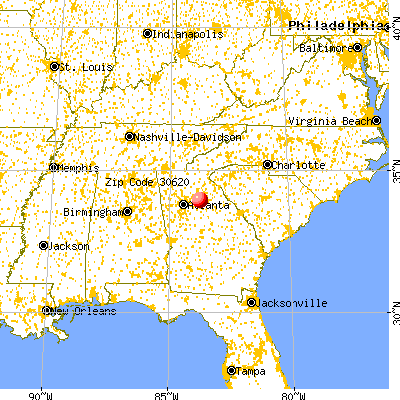


 Nearest zip codes: 30656, 30680, 30011, 30019, 30655, 30548.


 Based on the data from the years 2002 - 2018 the average number of fire incidents per year is 21. The highest number of reported fires - 55 took place in 2011, and the least - 0 in 2005. The data has an increasing trend.
 When looking into fire subcategories, the most reports belonged to: Outside Fires (58.0%), and Structure Fires (24.2%).