Estimated zip code population in 2022: 2,070 Zip code population in 2010: 2,281 Zip code population in 2000: 2,349
Houses and condos: 898 Renter-occupied apartments: 237
% of renters here:
31%
State:
34%
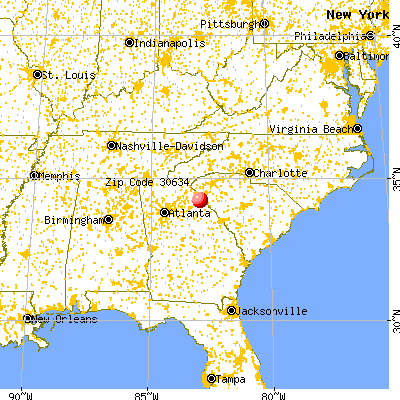
March 2022 cost of living index in zip code 30634: 81.6 (low, U.S. average is 100)
Land area: 48.2 sq. mi. Water area: 0.3 sq. mi.
Population density: 43 people per square mile
(very low).
OSM Map
General Map
Google Map
MSN Map
OSM Map
General Map
Google Map
MSN Map
OSM Map
General Map
Google Map
MSN Map
OSM Map
General Map
Google Map
MSN Map
Please wait while loading the map...
Real estate property taxes paid for housing units in 2022:
This zip code:
0.7% ($1,244)
Georgia:
0.7% ($2,160)
Median real estate property taxes paid for housing units with mortgages in 2022: $1,446 (0.9%) Median real estate property taxes paid for housing units with no mortgage in 2022: $1,200 (0.7%)
Business Search- 14 Million verified businesses
Males: 1,034
(50.0%)
Females: 1,035
(50.0%)
For population 25 years and over in 30634:
High school or higher: 67.7%
Bachelor's degree or higher: 5.9%
Graduate or professional degree: 4.6%
Unemployed: 2.6%
Mean travel time to work (commute): 20.9 minutes
For population 15 years and over in 30634:
Never married: 20.0%
Now married: 64.9%
Separated: 2.6%
Widowed: 8.2%
Divorced: 4.3%
Zip code 30634 compared to state average:
Median house value below state average.
Black race population percentage significantly below state average.
Length of stay since moving in significantly above state average.
Number of college students significantly below state average.
Percentage of population with a bachelor's degree or higher significantly below state average.
Averages for the 2020 tax year for zip code 30634, filed in 2021:
Average Adjusted Gross Income (AGI) in 2020: $46,869 (Individual Income Tax Returns)
Here:
$46,869
State:
$70,847
Salary/wage: $41,956 (reported on 80.0% of returns)
Here:
$41,956
State:
$59,126
(% of AGI for various income ranges: 1204.5% for AGIs below $25k, 3789.6% for AGIs $25k-50k, 6725.0% for AGIs $50k-75k, 8942.0% for AGIs $75k-100k, 20320.0% for AGIs $100k-200k)
Taxable interest for individuals: $996 (reported on 23.0% of returns)
This zip code:
$996
Georgia:
$2,011
(% of AGI for various income ranges: 9.3% for AGIs below $25k, 39.1% for AGIs $25k-50k, 48.0% for AGIs $50k-75k, 128.0% for AGIs $100k-200k)
Ordinary dividends: $3,200 (reported on 10.0% of returns)
Here:
$3,200
State:
$8,996
(% of AGI for various income ranges: 16.6% for AGIs below $25k, 136.0% for AGIs $50k-75k, 272.0% for AGIs $100k-200k)
Net capital gain/loss in AGI: +$12,000 (reported on 9.0% of returns)
Here:
+$12,000
State:
+$28,402
(% of AGI for various income ranges: 25.9% for AGIs below $25k, 45.0% for AGIs $50k-75k, 1920.0% for AGIs $100k-200k)
Profit/loss from business: +$9,000 (reported on 20.0% of returns)
Here:
+$9,000
State:
+$6,707
(% of AGI for various income ranges: 232.1% for AGIs below $25k, 133.9% for AGIs $25k-50k, 94.0% for AGIs $50k-75k, 1450.0% for AGIs $100k-200k)
Taxable individual retirement arrangement distribution: $10,100 (reported on 7.0% of returns)
30634:
$10,100
Georgia:
$20,525
(% of AGI for various income ranges: 187.0% for AGIs $25k-50k, 554.0% for AGIs $75k-100k)
Total itemized deductions: $31,020 (reported on 5.0% of returns)
Here:
$31,020
State:
$34,001
(% of AGI for various income ranges: 340.4% for AGIs $25k-50k, 1536.0% for AGIs $100k-200k)
Charity contributions: $12,750 (reported on 4.0% of returns)
Here:
$12,750
State:
$14,164
(% of AGI for various income ranges: 1020.0% for AGIs $100k-200k)
Taxes paid: $6,560 (reported on 5.0% of returns)
30634:
$6,560
State:
$7,540
(% of AGI for various income ranges: 50.4% for AGIs $25k-50k, 424.0% for AGIs $100k-200k)
Earned income credit: $2,733 (reported on 27.0% of returns)
Here:
$2,733
State:
$2,530
(% of AGI for various income ranges: 168.3% for AGIs below $25k, 108.7% for AGIs $25k-50k)
Percentage of individuals using paid preparers for their 2020 taxes: 96.0%
Here:
96%
State:
93%
(% for various income ranges: 92.3% for AGIs below $25k, 96.7% for AGIs $25k-50k, 100.0% for AGIs $50k-75k, 100.0% for AGIs $75k-100k, 100.0% for AGIs $100k-200k)
Averages for the 2012 tax year for zip code 30634, filed in 2013:
Average Adjusted Gross Income (AGI) in 2012: $35,865 (Individual Income Tax Returns)
Here:
$35,865
State:
$56,131
Salary/wage: $32,039 (reported on 86.8% of returns)
Here:
$32,039
State:
$47,942
(% of AGI for various income ranges: 79.8% for AGIs below $25k, 83.1% for AGIs $25k-50k, 77.7% for AGIs $50k-75k, 79.8% for AGIs $75k-100k, 64.3% for AGIs $100k-200k)
Taxable interest for individuals: $983 (reported on 19.8% of returns)
This zip code:
$983
Georgia:
$1,706
(% of AGI for various income ranges: 1.0% for AGIs below $25k, 0.6% for AGIs $25k-50k, 0.6% for AGIs $50k-75k, 0.1% for AGIs $75k-100k, 0.2% for AGIs $100k-200k)
Ordinary dividends: $1,950 (reported on 8.8% of returns)
Here:
$1,950
State:
$7,265
(% of AGI for various income ranges: 0.3% for AGIs below $25k, 1.1% for AGIs $25k-50k, 0.7% for AGIs $75k-100k)
Profit/loss from business: +$6,106 (reported on 17.6% of returns)
Here:
+$6,106
State:
+$7,583
(% of AGI for various income ranges: 8.8% for AGIs below $25k, 2.0% for AGIs $25k-50k, 4.2% for AGIs $50k-75k)
Taxable individual retirement arrangement distribution: $5,760 (reported on 5.5% of returns)
30634:
$5,760
Georgia:
$17,199
(% of AGI for various income ranges: 2.6% for AGIs below $25k, 1.4% for AGIs $25k-50k)
Total itemized deductions: $16,636 (26% of AGI, reported on 24.2% of returns)
Here:
$16,636
State:
$23,886
Here:
26.1% of AGI
State:
21.5% of AGI
(% of AGI for various income ranges: 5.7% for AGIs below $25k, 9.1% for AGIs $25k-50k, 12.9% for AGIs $50k-75k, 16.2% for AGIs $75k-100k, 14.3% for AGIs $100k-200k)
Charity contributions: $4,547 (reported on 18.7% of returns)
Here:
$4,547
State:
$5,507
(% of AGI for various income ranges: 2.0% for AGIs $25k-50k, 2.7% for AGIs $50k-75k, 4.2% for AGIs $75k-100k, 3.5% for AGIs $100k-200k)
Taxes paid: $4,400 (reported on 23.1% of returns)
30634:
$4,400
State:
$7,838
(% of AGI for various income ranges: 0.6% for AGIs below $25k, 1.5% for AGIs $25k-50k, 3.0% for AGIs $50k-75k, 4.7% for AGIs $75k-100k, 5.7% for AGIs $100k-200k)
Earned income credit: $2,425 (reported on 30.8% of returns)
Here:
$2,425
State:
$2,589
(% of AGI for various income ranges: 9.2% for AGIs below $25k, 1.7% for AGIs $25k-50k)
Percentage of individuals using paid preparers for their 2012 taxes: 62.6%
Here:
63%
State:
55%
(% for various income ranges: 62.8% for AGIs below $25k, 60.7% for AGIs $25k-50k, 63.6% for AGIs $50k-75k, 60.0% for AGIs $75k-100k, 75.0% for AGIs $100k-200k)
Averages for the 2004 tax year for zip code 30634, filed in 2005:
Average Adjusted Gross Income (AGI) in 2004: $30,404 (Individual Income Tax Returns)
Here:
$30,404
State:
$47,553
Salary/wage: $29,009 (reported on 86.9% of returns)
Here:
$29,009
State:
$42,178
(% of AGI for various income ranges: 98.7% for AGIs below $10k, 84.4% for AGIs $10k-25k, 84.3% for AGIs $25k-50k, 84.0% for AGIs $50k-75k, 85.9% for AGIs $75k-100k, 67.4% for AGIs over 100k)
Taxable interest for individuals: $1,415 (reported on 27.2% of returns)
This zip code:
$1,415
Georgia:
$1,772
(% of AGI for various income ranges: 2.9% for AGIs below $10k, 1.9% for AGIs $10k-25k, 1.7% for AGIs $25k-50k, 0.6% for AGIs $50k-75k, 0.3% for AGIs $75k-100k, 0.8% for AGIs over 100k)
Taxable dividends: $1,169 (reported on 9.8% of returns)
Here:
$1,169
State:
$4,283
(% of AGI for various income ranges: 1.0% for AGIs $10k-25k, 0.2% for AGIs $25k-50k, 0.4% for AGIs $50k-75k, 0.4% for AGIs $75k-100k)
Net capital gain/loss: +$935 (reported on 8.5% of returns)
Here:
+$935
State:
+$16,461
(% of AGI for various income ranges: 0.3% for AGIs $10k-25k, 0.0% for AGIs $25k-50k, 0.4% for AGIs $50k-75k, 1.2% for AGIs $75k-100k)
Profit/loss from business: +$6,623 (reported on 16.7% of returns)
Here:
+$6,623
State:
+$8,201
(% of AGI for various income ranges: 10.3% for AGIs below $10k, 4.7% for AGIs $10k-25k, 3.5% for AGIs $25k-50k, 5.5% for AGIs $50k-75k)
Profit/loss from farming: +$45 (reported on 7.4% of returns)
Here:
+$45
State:
-$6,357
(% of AGI for various income ranges: 1.9% for AGIs below $10k, -1.0% for AGIs $10k-25k, 0.2% for AGIs $25k-50k, 0.4% for AGIs $50k-75k, -0.3% for AGIs $75k-100k)
IRA payment deduction: $3,053 (reported on 2.1% of returns)
30634:
$3,053
Georgia:
$2,969
Total itemized deductions: $14,201 (24% of AGI, reported on 21.5% of returns)
Here:
$14,201
State:
$19,944
Here:
24.1% of AGI
State:
22.6% of AGI
(% of AGI for various income ranges: 5.4% for AGIs $10k-25k, 9.2% for AGIs $25k-50k, 12.3% for AGIs $50k-75k, 17.2% for AGIs $75k-100k, 11.3% for AGIs over 100k)
Charity contributions deductions: $3,940 (6% of AGI, reported on 18.5% of returns)
Here:
$3,940
State:
$4,354
Here:
6.4% of AGI
State:
4.7% of AGI
(% of AGI for various income ranges: 1.0% for AGIs $10k-25k, 2.0% for AGIs $25k-50k, 3.4% for AGIs $50k-75k, 4.6% for AGIs $75k-100k, 2.3% for AGIs over 100k)
Total tax: $3,473 (reported on 66.2% of returns)
30634:
$3,473
State:
$8,223
(% of AGI for various income ranges: 3.5% for AGIs below $10k, 3.3% for AGIs $10k-25k, 6.2% for AGIs $25k-50k, 7.8% for AGIs $50k-75k, 10.4% for AGIs $75k-100k, 16.2% for AGIs over 100k)
Earned income credit: $1,873 (reported on 26.2% of returns)
Here:
$1,873
State:
$1,986
Percentage of individuals using paid preparers for their 2004 taxes: 67.4%
Here:
67%
State:
62%
(% for various income ranges: 58.3% for AGIs below $10k, 67.5% for AGIs $10k-25k, 72.7% for AGIs $25k-50k, 72.6% for AGIs $50k-75k, 64.5% for AGIs $75k-100k, 61.9% for AGIs over 100k)
Household received Food Stamps/SNAP in the past 12 months: 82 Household did not receive Food Stamps/SNAP in the past 12 months: 672
Women who did not have a birth in the past 12 months: 434 (217 now married, 216 unmarried)
Housing units in zip code 30634 with a mortgage: 104 Median monthly owner costs for units with a mortgage: $1,014 Median monthly owner costs for units without a mortgage: $373
Residents with income below the poverty level in 2022:
This zip code:
5.9%
Whole state:
12.7%
Residents with income below 50% of the poverty level in 2022:
This zip code:
2.2%
Whole state:
6.3%
Median number of rooms in houses and condos:
Here:
6.6
State:
6.8
Median number of rooms in apartments:
Here:
5.5
State:
4.6
Notable locations in this zip code not listed on our city pages
Churches in zip code 30634 include: Dewy Rose Baptist Church (A), Liberty Church (B), Victory Church (C), Hall Grove Church (D), Ruckers Grove Church (E), Shiloh Church (F), Deep Creek Church (G), Stinchcomb Church (H), Antioch Church (I). Display/hide their locations on the map
Cemeteries: Antioch Cemetery (1), Deep Creek Cemetery (2), Dewy Rose Cemetery (3), Hall Grove Cemetery (4), Stinchcomb Cemetery (5), Liberty Cemetery (6), Ruckers Grove Cemetery (7). Display/hide their locations on the map
In group quarters: 19 (-1 institutionalized population)
Size of family households: 269 2-persons, 122 3-persons, 167 4-persons, 17 5-persons, 20 6-persons, 8 7-or-more-persons
Size of nonfamily households: 106 1-person, 17 2-persons, 29 3-persons
314 married couples with children.
29 single-parent households (21 men, 8 women).
80.9% of residents of 30634 zip code speak English at home.
13.5% of residents speak Spanish at home (48% very well, 13% well, 11% not well, 27% not at all).
5.4% of residents speak Asian or Pacific Island language at home (35% well, 36% not well, 30% not at all).
Foreign born population: 248 (12.0%) (30.8% of them are naturalized citizens)
This zip code:
12.0%
Whole state:
10.7%
51%Honduras
31%Thailand
17%El Salvador
29%American
17%English
3%Scotch-Irish
3%Irish
2%European
1%German
Year of entry for the foreign-born population
862010 or later
972000 to 2009
741990 to 1999
0Before 1990
Housing units lacking complete plumbing facilities: 4.7% Housing units lacking complete kitchen facilities: 10.4%
70.0%Electricity
13.2%Utility gas
12.5%Bottled, tank, or LP gas
3.4%No fuel used
1.2%Wood
Population in 1990: 1,138. Population change in the 1990s: +1,211 (+106.4%).
Place of birth for U.S.-born residents:
This state: 1,202
Northeast: 29
Midwest: 62
South: 440
West: 80
66% of the 30634 zip code residents lived in the same house 5 years ago. Out of people who lived in different houses, 39% lived in this county. Out of people who lived in different counties, 50% lived in Georgia.
98% of the 30634 zip code residents lived in the same house 1 year ago. Out of people who lived in different houses, 113% moved from different county within same state.
Private vs. public school enrollment:
Students in private schools in grades 1 to 8 (elementary and middle school): 83
Here:
27.2%
Georgia:
12.1%
Students in private schools in grades 9 to 12 (high school): 5
Here:
5.4%
Georgia:
10.8%
Students in private undergraduate colleges:
Here:
0.0%
Georgia:
17.1%
Occupation by median earnings in the past 12 months ($)
60,319Management occupations
32,903Office and administrative support occupations
32,740Sales and related occupations
23,880Production occupations
20,368Education, training, and library occupations
3,818Building and grounds cleaning and maintenance occupations
Top industries in this zip code by the number of employees in 2005:
Accommodation and Food Services: RV (Recreational Vehicle) Parks and Campgrounds (5-9 employees: 1 establishment)
Mining: Dimension Stone Mining and Quarrying (5-9: 1)
Professional, Scientific, and Technical Services: Other Scientific and Technical Consulting Services (5-9: 1)
Health Care and Social Assistance: Other Residential Care Facilities (5-9: 1)
Construction: Electrical Contractors (5-9: 1)
Other Services (except Public Administration): Religious Organizations (1-4: 2)
People in group quarters in 2010:
8 people in group homes intended for adults
People in group quarters in 2000:
234 people in local jails and other confinement facilities (including police lockups)
3 people in other noninstitutional group quarters
Fatal accident statistics in 2014:
Fatal accident count: 1
Vehicles involved in fatal accidents: 1
Fatal accidents caused by drunken drivers: 0
Fatalities: 1
Persons involved in fatal accidents: 1
Pedestrians involved in fatal accidents: 0
Fatal accident statistics in 2013:
Fatal accident count: 1
Vehicles involved in fatal accidents: 2
Fatal accidents caused by drunken drivers: 0
Fatalities: 1
Persons involved in fatal accidents: 2
Pedestrians involved in fatal accidents: 0
2005 - 2018 National Fire Incident Reporting System (NFIRS) incidents
According to the data from the years 2005 - 2018 the average number of fires per year is 13. The highest number of reported fires - 26 took place in 2014, and the least - 4 in 2018. The data has a dropping trend.
When looking into fire subcategories, the most reports belonged to: Outside Fires (50.3%), and Structure Fires (35.0%).
Fire incident types reported to NFIRS in Zip Code 30634


+$45
-$6,357
(% of AGI for various income ranges: 1.9% for AGIs below $10k, -1.0% for AGIs $10k-25k, 0.2% for AGIs $25k-50k, 0.4% for AGIs $50k-75k, -0.3% for AGIs $75k-100k)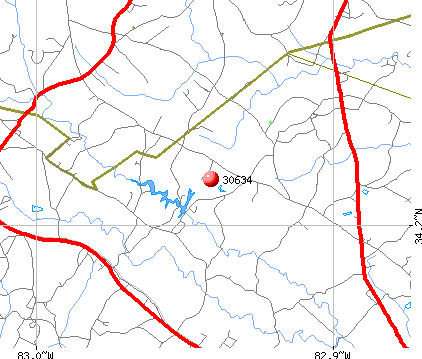 Nearest zip codes: 30624, 30643, 30635, 30520, 30516, 30629.


 According to the data from the years 2005 - 2018 the average number of fires per year is 13. The highest number of reported fires - 26 took place in 2014, and the least - 4 in 2018. The data has a dropping trend.
 When looking into fire subcategories, the most reports belonged to: Outside Fires (50.3%), and Structure Fires (35.0%).