Estimated zip code population in 2022: 2,464 Zip code population in 2010: 2,428 Zip code population in 2000: 2,296
Houses and condos: 1,503 Renter-occupied apartments: 342
% of renters here:
30%
State:
34%
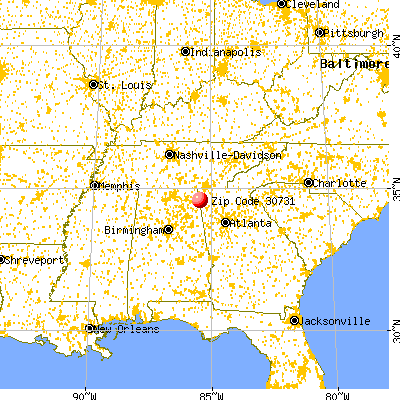
March 2022 cost of living index in zip code 30731: 81.0 (low, U.S. average is 100)
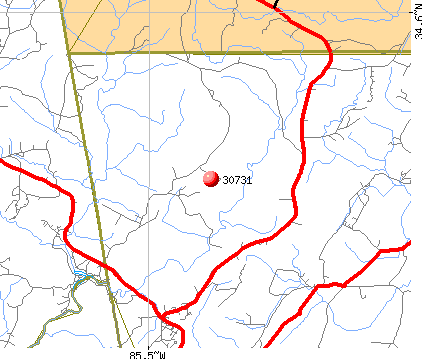
Land area: 86.7 sq. mi. Water area: 0.1 sq. mi.
Population density: 28 people per square mile
(very low).
OSM Map
General Map
Google Map
MSN Map
OSM Map
General Map
Google Map
MSN Map
OSM Map
General Map
Google Map
MSN Map
OSM Map
General Map
Google Map
MSN Map
Please wait while loading the map...
Real estate property taxes paid for housing units in 2022:
This zip code:
0.7% ($1,095)
Georgia:
0.7% ($2,160)
Median real estate property taxes paid for housing units with mortgages in 2022: $1,361 (0.6%) Median real estate property taxes paid for housing units with no mortgage in 2022: $1,042 (0.7%)
Averages for the 2020 tax year for zip code 30731, filed in 2021:
Average Adjusted Gross Income (AGI) in 2020: $49,901 (Individual Income Tax Returns)
Here:
$49,901
State:
$70,847
Salary/wage: $41,484 (reported on 76.8% of returns)
Here:
$41,484
State:
$59,126
(% of AGI for various income ranges: 981.4% for AGIs below $25k, 3308.2% for AGIs $25k-50k, 5844.4% for AGIs $50k-75k, 10580.0% for AGIs $75k-100k, 15645.7% for AGIs $100k-200k)
Taxable interest for individuals: $776 (reported on 25.3% of returns)
This zip code:
$776
Georgia:
$2,011
(% of AGI for various income ranges: 12.9% for AGIs below $25k, 7.7% for AGIs $25k-50k, 21.1% for AGIs $50k-75k, 14.0% for AGIs $75k-100k, 164.3% for AGIs $100k-200k)
Ordinary dividends: $3,714 (reported on 14.1% of returns)
Here:
$3,714
State:
$8,996
(% of AGI for various income ranges: 27.1% for AGIs below $25k, 21.8% for AGIs $25k-50k, 64.4% for AGIs $50k-75k, 482.9% for AGIs $100k-200k)
Net capital gain/loss in AGI: +$8,867 (reported on 15.2% of returns)
Here:
+$8,867
State:
+$28,402
(% of AGI for various income ranges: 14.3% for AGIs below $25k, 28.6% for AGIs $25k-50k, 67.8% for AGIs $50k-75k, 1665.7% for AGIs $100k-200k)
Profit/loss from business: +$8,378 (reported on 18.2% of returns)
Here:
+$8,378
State:
+$6,707
(% of AGI for various income ranges: 213.6% for AGIs below $25k, 90.0% for AGIs $25k-50k, 297.8% for AGIs $50k-75k, 634.3% for AGIs $100k-200k)
Taxable individual retirement arrangement distribution: $21,738 (reported on 8.1% of returns)
30731:
$21,738
Georgia:
$20,525
(% of AGI for various income ranges: 93.2% for AGIs below $25k, 523.3% for AGIs $50k-75k, 1438.6% for AGIs $100k-200k)
Total itemized deductions: $23,375 (reported on 4.0% of returns)
Here:
$23,375
State:
$34,001
(% of AGI for various income ranges: 1870.0% for AGIs $75k-100k)
Charity contributions: $8,075 (reported on 4.0% of returns)
Here:
$8,075
State:
$14,164
(% of AGI for various income ranges: 646.0% for AGIs $75k-100k)
Taxes paid: $5,150 (reported on 4.0% of returns)
30731:
$5,150
State:
$7,540
(% of AGI for various income ranges: 412.0% for AGIs $75k-100k)
Earned income credit: $2,229 (reported on 24.2% of returns)
Here:
$2,229
State:
$2,530
(% of AGI for various income ranges: 116.1% for AGIs below $25k, 95.5% for AGIs $25k-50k)
Percentage of individuals using paid preparers for their 2020 taxes: 94.9%
Here:
95%
State:
93%
(% for various income ranges: 91.9% for AGIs below $25k, 96.3% for AGIs $25k-50k, 100.0% for AGIs $50k-75k, 100.0% for AGIs $75k-100k, 92.9% for AGIs $100k-200k)
Averages for the 2012 tax year for zip code 30731, filed in 2013:
Average Adjusted Gross Income (AGI) in 2012: $43,158 (Individual Income Tax Returns)
Here:
$43,158
State:
$56,131
Salary/wage: $36,327 (reported on 81.4% of returns)
Here:
$36,327
State:
$47,942
(% of AGI for various income ranges: 71.4% for AGIs below $25k, 77.9% for AGIs $25k-50k, 83.6% for AGIs $50k-75k, 64.5% for AGIs $75k-100k, 48.9% for AGIs $100k-200k)
Taxable interest for individuals: $543 (reported on 26.7% of returns)
This zip code:
$543
Georgia:
$1,706
(% of AGI for various income ranges: 0.9% for AGIs below $25k, 0.3% for AGIs $25k-50k, 0.2% for AGIs $50k-75k, 0.2% for AGIs $75k-100k, 0.3% for AGIs $100k-200k)
Ordinary dividends: $2,556 (reported on 10.5% of returns)
Here:
$2,556
State:
$7,265
(% of AGI for various income ranges: 1.2% for AGIs $25k-50k, 0.8% for AGIs $50k-75k, 0.6% for AGIs $100k-200k)
Net capital gain/loss in AGI: +$3,614 (reported on 8.1% of returns)
Here:
+$3,614
State:
+$16,323
Profit/loss from business: +$8,606 (reported on 19.8% of returns)
Here:
+$8,606
State:
+$7,583
(% of AGI for various income ranges: 11.9% for AGIs below $25k, 4.4% for AGIs $25k-50k, 1.0% for AGIs $50k-75k, 4.2% for AGIs $100k-200k)
Taxable individual retirement arrangement distribution: $23,875 (reported on 9.3% of returns)
30731:
$23,875
Georgia:
$17,199
Total itemized deductions: $18,759 (25% of AGI, reported on 25.6% of returns)
Here:
$18,759
State:
$23,886
Here:
25.2% of AGI
State:
21.5% of AGI
(% of AGI for various income ranges: 7.0% for AGIs below $25k, 11.7% for AGIs $25k-50k, 11.9% for AGIs $50k-75k, 12.7% for AGIs $75k-100k, 11.0% for AGIs $100k-200k)
Charity contributions: $3,881 (reported on 18.6% of returns)
Here:
$3,881
State:
$5,507
(% of AGI for various income ranges: 2.2% for AGIs $25k-50k, 1.6% for AGIs $50k-75k, 1.5% for AGIs $75k-100k, 2.2% for AGIs $100k-200k)
Taxes paid: $4,773 (reported on 25.6% of returns)
30731:
$4,773
State:
$7,838
(% of AGI for various income ranges: 1.1% for AGIs below $25k, 1.7% for AGIs $25k-50k, 3.4% for AGIs $50k-75k, 3.3% for AGIs $75k-100k, 3.9% for AGIs $100k-200k)
Earned income credit: $2,448 (reported on 26.7% of returns)
Here:
$2,448
State:
$2,589
(% of AGI for various income ranges: 9.1% for AGIs below $25k, 1.4% for AGIs $25k-50k)
Percentage of individuals using paid preparers for their 2012 taxes: 62.8%
Here:
63%
State:
55%
(% for various income ranges: 61.1% for AGIs below $25k, 64.0% for AGIs $25k-50k, 61.5% for AGIs $50k-75k, 66.7% for AGIs $75k-100k, 66.7% for AGIs $100k-200k)
Averages for the 2004 tax year for zip code 30731, filed in 2005:
Average Adjusted Gross Income (AGI) in 2004: $32,983 (Individual Income Tax Returns)
Here:
$32,983
State:
$47,553
Salary/wage: $31,347 (reported on 84.9% of returns)
Here:
$31,347
State:
$42,178
(% of AGI for various income ranges: 96.9% for AGIs below $10k, 85.3% for AGIs $10k-25k, 84.3% for AGIs $25k-50k, 85.8% for AGIs $50k-75k, 75.9% for AGIs $75k-100k, 63.0% for AGIs over 100k)
Taxable interest for individuals: $856 (reported on 33.6% of returns)
This zip code:
$856
Georgia:
$1,772
(% of AGI for various income ranges: 5.1% for AGIs below $10k, 2.0% for AGIs $10k-25k, 0.5% for AGIs $25k-50k, 0.4% for AGIs $50k-75k, 0.4% for AGIs $75k-100k, 0.8% for AGIs over 100k)
Taxable dividends: $1,338 (reported on 14.0% of returns)
Here:
$1,338
State:
$4,283
(% of AGI for various income ranges: 1.2% for AGIs below $10k, 0.2% for AGIs $10k-25k, 0.6% for AGIs $25k-50k, 0.5% for AGIs $50k-75k, 0.2% for AGIs $75k-100k, 1.2% for AGIs over 100k)
Net capital gain/loss: +$5,404 (reported on 9.3% of returns)
Here:
+$5,404
State:
+$16,461
(% of AGI for various income ranges: -2.6% for AGIs below $10k, 0.5% for AGIs $10k-25k, 0.5% for AGIs $25k-50k, 1.7% for AGIs $50k-75k, 6.6% for AGIs over 100k)
Profit/loss from business: +$7,166 (reported on 17.7% of returns)
Here:
+$7,166
State:
+$8,201
(% of AGI for various income ranges: 16.0% for AGIs below $10k, 4.7% for AGIs $10k-25k, 4.4% for AGIs $25k-50k, 2.2% for AGIs $50k-75k, 6.3% for AGIs $75k-100k)
IRA payment deduction: $2,864 (reported on 2.3% of returns)
30731:
$2,864
Georgia:
$2,969
Total itemized deductions: $15,629 (24% of AGI, reported on 20.7% of returns)
Here:
$15,629
State:
$19,944
Here:
23.9% of AGI
State:
22.6% of AGI
(% of AGI for various income ranges: 12.5% for AGIs below $10k, 5.0% for AGIs $10k-25k, 7.5% for AGIs $25k-50k, 8.8% for AGIs $50k-75k, 18.3% for AGIs $75k-100k, 13.3% for AGIs over 100k)
Charity contributions deductions: $3,239 (5% of AGI, reported on 16.7% of returns)
Here:
$3,239
State:
$4,354
Here:
4.6% of AGI
State:
4.7% of AGI
(% of AGI for various income ranges: 0.4% for AGIs $10k-25k, 0.8% for AGIs $25k-50k, 1.7% for AGIs $50k-75k, 4.4% for AGIs $75k-100k, 2.4% for AGIs over 100k)
Total tax: $4,150 (reported on 70.0% of returns)
30731:
$4,150
State:
$8,223
(% of AGI for various income ranges: 4.9% for AGIs below $10k, 3.7% for AGIs $10k-25k, 6.3% for AGIs $25k-50k, 9.1% for AGIs $50k-75k, 10.3% for AGIs $75k-100k, 18.4% for AGIs over 100k)
Earned income credit: $1,685 (reported on 24.3% of returns)
Here:
$1,685
State:
$1,986
Percentage of individuals using paid preparers for their 2004 taxes: 65.8%
Here:
66%
State:
62%
(% for various income ranges: 63.7% for AGIs below $10k, 67.0% for AGIs $10k-25k, 66.4% for AGIs $25k-50k, 60.8% for AGIs $50k-75k, 66.7% for AGIs $75k-100k, 76.7% for AGIs over 100k)
Household received Food Stamps/SNAP in the past 12 months: 114 Household did not receive Food Stamps/SNAP in the past 12 months: 1,019
Women who had a birth in the past 12 months: 78 (59 now married, 19 unmarried) Women who did not have a birth in the past 12 months: 341 (169 now married, 172 unmarried)
Housing units in zip code 30731 with a mortgage: 244 (26 second mortgage, 27 both second mortgage and home equity loan) Houses without a mortgage: 20
Median monthly owner costs for units with a mortgage: $1,040 Median monthly owner costs for units without a mortgage: $278
Residents with income below the poverty level in 2022:
This zip code:
18.1%
Whole state:
12.7%
Residents with income below 50% of the poverty level in 2022:
This zip code:
13.0%
Whole state:
6.3%
Median number of rooms in houses and condos:
Here:
5.7
State:
6.8
Median number of rooms in apartments:
Here:
3.9
State:
4.6
Notable locations in this zip code not listed on our city pages
Notable locations in zip code 30731: Camp Adahi (A), Cloudland Park Club (B), Valley View Ranch Camp (C), Lookout (D), Camp Juliette Low (E), Menlo Volunteer Fire Department (F), Cloudland Volunteer Fire Department (G), Tri - County Volunteer Fire and Rescue (H), Walker County Emergency Services Station 18 Dougherty Gap (I). Display/hide their locations on the map
Churches in zip code 30731 include: Lookout Baptist Church (A), High Church (B), Mount Carmel Church (C), Mount Olive Church (D), Pleasant Grove Church (E), Head River Baptist Church (F), Chelsea Baptist Church (G), Alpine Church (H). Display/hide their locations on the map
Cemeteries: Lawrence Cemetery (1), Ami Cemetery (2), Menlo Cemetery (3), Forester Cemetery (4), Mount Carmel Cemetery (5), Gamble Cemetery (6), Pleasant Green Church Memorial Monument (7). Display/hide their locations on the map
Reservoirs: Scott Lake (A), Green Pond (B), Hair Lake (C), Camp Adahi Lake (D), Mountain Cove Lake (E), Carver Lake (F). Display/hide their locations on the map
Streams, rivers, and creeks: Weathers Branch (A), Wade Branch (B), Hale Branch (C), Gilreath Creek (D), Gamble Branch (E), Coulter Branch (F), Berry Creek (G), Murray Branch (H), Long Branch (I). Display/hide their locations on the map
Size of family households: 368 2-persons, 65 3-persons, 121 4-persons, 84 5-persons, 3 6-persons, 3 7-or-more-persons
Size of nonfamily households: 469 1-person, 11 2-persons
297 married couples with children.
300 single-parent households (24 men, 276 women).
100.0% of residents of 30731 zip code speak English at home.
0.1% of residents speak Spanish at home (100% very well).
Foreign born population: 3 (0.1%) (68.8% of them are naturalized citizens)
This zip code:
0.1%
Whole state:
10.7%
33%France
48%American
22%English
5%Irish
3%German
3%Scotch-Irish
2%Greek
1%Scottish
Year of entry for the foreign-born population
12010 or later
02000 to 2009
01990 to 1999
1Before 1990
Facilities with environmental interests located in this zip code:
MENLO LUMBER & PALLET CO INC (HWY 48 EAST in MENLO, GA)
STATE MASTER (Georgia's Geographic Environmental Information) - UST-1, UNDERGROUND STORAGE TANK PROGRAM Conditionally Exempt Small Quantity Generators, less than 100 kg/month of hazardous waste (Resource Conservation and Recovery Act (tracking hazardous waste)) - notification Organizations: W O BLALOCK (CONTACT/OWNER)
BEST MANUFACTURING CO MENLO DIV (579 EDISON STREET in MENLO, GA)
AIR MAJOR (AIRS/AFS) CRITERIA AND HAZARDOUS AIR POLLUTANT INVENTORY (Inventory of air pollution sources) Conditionally Exempt Small Quantity Generators, less than 100 kg/month of hazardous waste (Resource Conservation and Recovery Act (tracking hazardous waste)) TRI REPORTER (Tracking of toxic chemicals releasing facilities) Business SIC classification: DRESS AND WORK GLOVES, EXCEPT KNIT AND ALL-LEATHER; FABRICATED RUBBER PRODUCTS Organizations: OPERNAME (CONTACT/OPERATOR)
, BEST MFG. - PILLOTSON CORP (CONTACT/OPERATOR)
, OWNERNAME (CONTACT/OWNER)
, PILLOTSON CORP - BEST MFG. (CONTACT/OWNER)
MENLO ELEMENTARY SCHOOL (ALPINE ROAD in MENLO, GA)
(Geographic Names Information System) (National Center for Education Statistics) - STATE ID-3050 Organizations: CHATTOOGA COUNTY (SCHOOL DISTRICT)
MENLO PREK (15 WILMOT STREET in MENLO, GA)
(National Center for Education Statistics) - STATE ID-6196 Organizations: CHATTOOGA COUNTY (SCHOOL DISTRICT)
MENLO WPCP (1550 PEACH ORCHARD RD in MENLO, GA)
National Pollutant Discharge Elimination System NON-MAJOR (Tracking pollutant discharge elimination systems) - permit Business SIC classification: SEWERAGE SYSTEMS Organizations: CITY OF MENLO (CONTACT/OWNER)
Alternative names: MENTO, CITY OF
Housing units lacking complete plumbing facilities: 1.1% Housing units lacking complete kitchen facilities: 3.0%
73.1%Electricity
13.3%Bottled, tank, or LP gas
7.3%Utility gas
6.3%Wood
Population in 1990: 3,222.
Place of birth for U.S.-born residents:
This state: 1,711
Northeast: 53
Midwest: 20
South: 631
West: 26
66% of the 30731 zip code residents lived in the same house 5 years ago. Out of people who lived in different houses, 47% lived in this county. Out of people who lived in different counties, 50% lived in Georgia.
89% of the 30731 zip code residents lived in the same house 1 year ago. Out of people who lived in different houses, 25% moved from this county. Out of people who lived in different houses, 70% moved from different county within same state. Out of people who lived in different houses, 2% moved from different state.
Private vs. public school enrollment:
Students in private schools in grades 1 to 8 (elementary and middle school): 15
Here:
5.0%
Georgia:
12.1%
Students in private schools in grades 9 to 12 (high school):
Here:
0.0%
Georgia:
10.8%
Students in private undergraduate colleges:
Here:
0.0%
Georgia:
17.1%
Occupation by median earnings in the past 12 months ($)
123,846Management occupations
76,951Architecture and engineering occupations
64,119Construction and extraction occupations
53,853Sales and related occupations
53,371Installation, maintenance, and repair occupations
40,548Community and social service occupations
Top industries in this zip code by the number of employees in 2005:
Other Services (except Public Administration): Religious Organizations (1-4 employees: 2 establishments)
Accommodation and Food Services: Recreational and Vacation Camps (except Campgrounds) (1-4: 2)
Wholesale Trade: Other Construction Material Merchant Wholesalers (1-4: 1)
People in group quarters in 2000:
22 people in other workers' dormitories
Fatal accident statistics in 2013:
Fatal accident count: 1
Vehicles involved in fatal accidents: 1
Fatal accidents caused by drunken drivers: 0
Fatalities: 1
Persons involved in fatal accidents: 1
Pedestrians involved in fatal accidents: 0
Fatal accident statistics in 2012:
Fatal accident count: 2
Vehicles involved in fatal accidents: 3
Fatal accidents caused by drunken drivers: 1
Fatalities: 2
Persons involved in fatal accidents: 5
Pedestrians involved in fatal accidents: 0
Home Mortgage Disclosure Act Aggregated Statistics For Year 2009 (Based on 2 partial tracts)
A) FHA, FSA/RHS & VA Home Purchase Loans
B) Conventional Home Purchase Loans
C) Refinancings
D) Home Improvement Loans
F) Non-occupant Loans on < 5 Family Dwellings (A B C & D)
G) Loans On Manufactured Home Dwelling (A B C & D)
Number
Average Value
Number
Average Value
Number
Average Value
Number
Average Value
Number
Average Value
Number
Average Value
LOANS ORIGINATED
4
$105,468
4
$118,305
24
$132,725
3
$43,477
7
$133,867
2
$45,245
APPLICATIONS APPROVED, NOT ACCEPTED
0
$0
0
$0
2
$142,660
0
$0
0
$0
0
$0
APPLICATIONS DENIED
0
$0
2
$99,045
9
$126,537
1
$92,930
1
$255,570
1
$102,720
APPLICATIONS WITHDRAWN
0
$0
1
$94,560
4
$185,355
0
$0
0
$0
0
$0
FILES CLOSED FOR INCOMPLETENESS
0
$0
1
$98,640
2
$111,275
0
$0
0
$0
1
$71,740
Aggregated Statistics For Year 2008 (Based on 2 partial tracts)
A) FHA, FSA/RHS & VA Home Purchase Loans
B) Conventional Home Purchase Loans
C) Refinancings
D) Home Improvement Loans
F) Non-occupant Loans on < 5 Family Dwellings (A B C & D)
G) Loans On Manufactured Home Dwelling (A B C & D)
Number
Average Value
Number
Average Value
Number
Average Value
Number
Average Value
Number
Average Value
Number
Average Value
LOANS ORIGINATED
3
$100,677
9
$146,691
22
$114,406
2
$52,785
7
$151,161
5
$64,726
APPLICATIONS APPROVED, NOT ACCEPTED
1
$74,590
1
$61,960
1
$114,130
0
$0
1
$267,790
2
$61,345
APPLICATIONS DENIED
2
$113,110
2
$70,515
11
$131,951
3
$43,613
2
$96,600
2
$25,885
APPLICATIONS WITHDRAWN
1
$163,040
2
$57,065
4
$163,550
0
$0
1
$142,250
1
$74,180
FILES CLOSED FOR INCOMPLETENESS
0
$0
0
$0
0
$0
0
$0
0
$0
0
$0
Aggregated Statistics For Year 2007 (Based on 2 partial tracts)
A) FHA, FSA/RHS & VA Home Purchase Loans
B) Conventional Home Purchase Loans
C) Refinancings
D) Home Improvement Loans
F) Non-occupant Loans on < 5 Family Dwellings (A B C & D)
G) Loans On Manufactured Home Dwelling (A B C & D)
Number
Average Value
Number
Average Value
Number
Average Value
Number
Average Value
Number
Average Value
Number
Average Value
LOANS ORIGINATED
2
$83,760
13
$149,965
29
$132,597
7
$32,609
8
$215,978
4
$60,935
APPLICATIONS APPROVED, NOT ACCEPTED
0
$0
3
$123,367
2
$72,755
0
$0
1
$255,970
1
$44,840
APPLICATIONS DENIED
1
$159,370
2
$162,020
23
$135,695
1
$109,240
0
$0
1
$26,090
APPLICATIONS WITHDRAWN
0
$0
1
$98,640
9
$112,181
1
$110,050
0
$0
0
$0
FILES CLOSED FOR INCOMPLETENESS
0
$0
1
$176,900
3
$72,280
0
$0
0
$0
1
$40,760
Aggregated Statistics For Year 2006 (Based on 2 partial tracts)
A) FHA, FSA/RHS & VA Home Purchase Loans
B) Conventional Home Purchase Loans
C) Refinancings
D) Home Improvement Loans
F) Non-occupant Loans on < 5 Family Dwellings (A B C & D)
G) Loans On Manufactured Home Dwelling (A B C & D)
Number
Average Value
Number
Average Value
Number
Average Value
Number
Average Value
Number
Average Value
Number
Average Value
LOANS ORIGINATED
1
$112,090
16
$124,012
24
$96,737
7
$42,799
7
$140,680
6
$53,463
APPLICATIONS APPROVED, NOT ACCEPTED
0
$0
3
$77,037
5
$84,618
1
$33,830
0
$0
2
$61,550
APPLICATIONS DENIED
0
$0
5
$83,232
14
$102,657
3
$33,560
1
$101,900
4
$61,038
APPLICATIONS WITHDRAWN
0
$0
2
$110,865
7
$98,581
0
$0
0
$0
0
$0
FILES CLOSED FOR INCOMPLETENESS
0
$0
0
$0
3
$154,887
0
$0
0
$0
0
$0
Aggregated Statistics For Year 2005 (Based on 2 partial tracts)
A) FHA, FSA/RHS & VA Home Purchase Loans
B) Conventional Home Purchase Loans
C) Refinancings
D) Home Improvement Loans
F) Non-occupant Loans on < 5 Family Dwellings (A B C & D)
G) Loans On Manufactured Home Dwelling (A B C & D)
Number
Average Value
Number
Average Value
Number
Average Value
Number
Average Value
Number
Average Value
Number
Average Value
LOANS ORIGINATED
1
$88,450
15
$100,460
29
$99,904
6
$27,513
5
$153,014
4
$63,482
APPLICATIONS APPROVED, NOT ACCEPTED
0
$0
3
$70,650
6
$85,663
0
$0
1
$140,210
2
$87,635
APPLICATIONS DENIED
0
$0
7
$60,150
16
$110,740
6
$39,605
1
$127,170
7
$64,284
APPLICATIONS WITHDRAWN
0
$0
2
$92,525
8
$114,740
1
$44,430
1
$41,580
0
$0
FILES CLOSED FOR INCOMPLETENESS
0
$0
0
$0
1
$362,760
0
$0
0
$0
0
$0
Aggregated Statistics For Year 2004 (Based on 2 partial tracts)
A) FHA, FSA/RHS & VA Home Purchase Loans
B) Conventional Home Purchase Loans
C) Refinancings
D) Home Improvement Loans
F) Non-occupant Loans on < 5 Family Dwellings (A B C & D)
G) Loans On Manufactured Home Dwelling (A B C & D)
Number
Average Value
Number
Average Value
Number
Average Value
Number
Average Value
Number
Average Value
Number
Average Value
LOANS ORIGINATED
1
$70,110
13
$93,905
26
$91,334
7
$37,150
4
$69,700
5
$36,440
APPLICATIONS APPROVED, NOT ACCEPTED
0
$0
3
$91,167
5
$70,270
1
$72,550
1
$85,190
1
$92,930
APPLICATIONS DENIED
0
$0
9
$91,348
20
$88,184
2
$25,680
1
$101,080
7
$57,879
APPLICATIONS WITHDRAWN
0
$0
2
$73,370
7
$115,874
0
$0
0
$0
0
$0
FILES CLOSED FOR INCOMPLETENESS
0
$0
0
$0
3
$101,900
0
$0
0
$0
0
$0
Aggregated Statistics For Year 2003 (Based on 2 partial tracts)
A) FHA, FSA/RHS & VA Home Purchase Loans
B) Conventional Home Purchase Loans
C) Refinancings
D) Home Improvement Loans
F) Non-occupant Loans on < 5 Family Dwellings (A B C & D)
Number
Average Value
Number
Average Value
Number
Average Value
Number
Average Value
Number
Average Value
LOANS ORIGINATED
1
$180,160
12
$82,165
43
$104,611
4
$25,068
6
$105,025
APPLICATIONS APPROVED, NOT ACCEPTED
0
$0
4
$85,595
4
$70,108
0
$0
1
$81,110
APPLICATIONS DENIED
0
$0
6
$64,468
22
$72,645
2
$3,465
0
$0
APPLICATIONS WITHDRAWN
0
$0
0
$0
7
$89,614
0
$0
0
$0
FILES CLOSED FOR INCOMPLETENESS
0
$0
0
$0
2
$96,600
0
$0
0
$0
Aggregated Statistics For Year 2002 (Based on 2 partial tracts)
A) FHA, FSA/RHS & VA Home Purchase Loans
B) Conventional Home Purchase Loans
C) Refinancings
D) Home Improvement Loans
F) Non-occupant Loans on < 5 Family Dwellings (A B C & D)
Number
Average Value
Number
Average Value
Number
Average Value
Number
Average Value
Number
Average Value
LOANS ORIGINATED
2
$138,990
12
$76,901
31
$90,014
6
$23,302
2
$32,200
APPLICATIONS APPROVED, NOT ACCEPTED
0
$0
1
$31,790
6
$69,360
0
$0
0
$0
APPLICATIONS DENIED
0
$0
9
$44,519
15
$69,265
4
$30,162
1
$41,580
APPLICATIONS WITHDRAWN
1
$85,190
2
$61,140
6
$106,927
0
$0
0
$0
FILES CLOSED FOR INCOMPLETENESS
0
$0
0
$0
1
$108,010
0
$0
0
$0
Aggregated Statistics For Year 2001 (Based on 2 partial tracts)
A) FHA, FSA/RHS & VA Home Purchase Loans
B) Conventional Home Purchase Loans
C) Refinancings
D) Home Improvement Loans
F) Non-occupant Loans on < 5 Family Dwellings (A B C & D)
Number
Average Value
Number
Average Value
Number
Average Value
Number
Average Value
Number
Average Value
LOANS ORIGINATED
4
$61,445
17
$86,819
36
$100,643
6
$31,182
2
$87,025
APPLICATIONS APPROVED, NOT ACCEPTED
0
$0
4
$64,808
7
$75,756
1
$11,820
1
$92,930
APPLICATIONS DENIED
0
$0
12
$58,661
22
$79,927
5
$15,814
2
$27,105
APPLICATIONS WITHDRAWN
0
$0
1
$59,920
11
$91,006
2
$13,860
1
$60,320
FILES CLOSED FOR INCOMPLETENESS
0
$0
0
$0
2
$83,150
0
$0
0
$0
Aggregated Statistics For Year 2000 (Based on 2 partial tracts)
A) FHA, FSA/RHS & VA Home Purchase Loans
B) Conventional Home Purchase Loans
C) Refinancings
D) Home Improvement Loans
F) Non-occupant Loans on < 5 Family Dwellings (A B C & D)
Number
Average Value
Number
Average Value
Number
Average Value
Number
Average Value
Number
Average Value
LOANS ORIGINATED
1
$86,410
18
$67,503
19
$66,653
7
$20,963
4
$51,358
APPLICATIONS APPROVED, NOT ACCEPTED
0
$0
4
$98,842
3
$43,750
2
$9,170
1
$257,200
APPLICATIONS DENIED
2
$44,020
12
$47,077
11
$48,467
3
$35,053
0
$0
APPLICATIONS WITHDRAWN
1
$55,030
2
$67,255
11
$63,882
0
$0
0
$0
FILES CLOSED FOR INCOMPLETENESS
0
$0
0
$0
1
$72,150
0
$0
0
$0
Aggregated Statistics For Year 1999 (Based on 1 partial tract)
B) Conventional Home Purchase Loans
C) Refinancings
D) Home Improvement Loans
F) Non-occupant Loans on < 5 Family Dwellings (A B C & D)
Detailed PMIC statistics for the following Tracts:0208.00
2002 - 2018 National Fire Incident Reporting System (NFIRS) incidents
Based on the data from the years 2002 - 2018 the average number of fires per year is 14. The highest number of reported fire incidents - 69 took place in 2016, and the least - 2 in 2005. The data has an increasing trend.
When looking into fire subcategories, the most reports belonged to: Outside Fires (48.0%), and Structure Fires (41.1%).
Fire incident types reported to NFIRS in Zip Code 30731


 Nearest zip codes: 35984, 35989, 30753, 30747, 30738, 35981.


 Based on the data from the years 2002 - 2018 the average number of fires per year is 14. The highest number of reported fire incidents - 69 took place in 2016, and the least - 2 in 2005. The data has an increasing trend.
 When looking into fire subcategories, the most reports belonged to: Outside Fires (48.0%), and Structure Fires (41.1%).