Estimated zip code population in 2022: 1,752 Zip code population in 2010: 1,915 Zip code population in 2000: 2,189
Houses and condos: 1,079 Renter-occupied apartments: 138
% of renters here:
21%
State:
34%
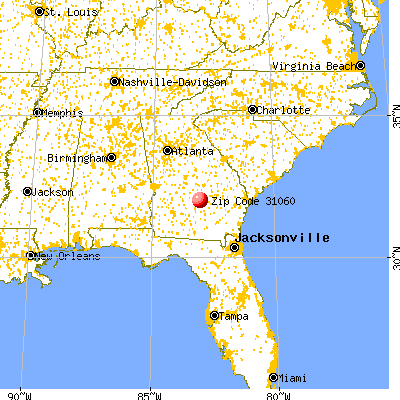
March 2022 cost of living index in zip code 31060: 79.0 (low, U.S. average is 100)
Land area: 101.8 sq. mi. Water area: 1.2 sq. mi.
Population density: 17 people per square mile
(very low).
OSM Map
General Map
Google Map
MSN Map
OSM Map
General Map
Google Map
MSN Map
OSM Map
General Map
Google Map
MSN Map
OSM Map
General Map
Google Map
MSN Map
Please wait while loading the map...
Real estate property taxes paid for housing units in 2022:
This zip code:
1.3% ($1,077)
Georgia:
0.7% ($2,160)
Median real estate property taxes paid for housing units with mortgages in 2022: $1,254 (0.9%) Median real estate property taxes paid for housing units with no mortgage in 2022: $996 (1.4%)
Business Search- 14 Million verified businesses
Males: 947
(54.1%)
Females: 804
(45.9%)
For population 25 years and over in 31060:
High school or higher: 78.5%
Bachelor's degree or higher: 11.9%
Graduate or professional degree: 6.2%
Unemployed: 4.5%
Mean travel time to work (commute): 45.6 minutes
For population 15 years and over in 31060:
Never married: 41.0%
Now married: 36.2%
Separated: 1.5%
Widowed: 13.3%
Divorced: 8.0%
Zip code 31060 compared to state average:
Median household income below state average.
Median house value significantly below state average.
Hispanic race population percentage significantly below state average.
Median age significantly above state average.
Foreign-born population percentage significantly below state average.
Renting percentage below state average.
Length of stay since moving in significantly above state average.
Number of college students significantly below state average.
Percentage of population with a bachelor's degree or higher significantly below state average.
Averages for the 2020 tax year for zip code 31060, filed in 2021:
Average Adjusted Gross Income (AGI) in 2020: $39,965 (Individual Income Tax Returns)
Here:
$39,965
State:
$70,847
Salary/wage: $38,671 (reported on 75.0% of returns)
Here:
$38,671
State:
$59,126
(% of AGI for various income ranges: 1123.2% for AGIs below $25k, 3282.3% for AGIs $25k-50k, 6738.0% for AGIs $50k-75k, 9196.7% for AGIs $75k-100k, 16243.3% for AGIs $100k-200k)
Taxable interest for individuals: $876 (reported on 28.3% of returns)
This zip code:
$876
Georgia:
$2,011
(% of AGI for various income ranges: 14.2% for AGIs below $25k, 29.2% for AGIs $25k-50k, 116.0% for AGIs $50k-75k, 86.7% for AGIs $100k-200k)
Ordinary dividends: $1,975 (reported on 6.7% of returns)
Here:
$1,975
State:
$8,996
(% of AGI for various income ranges: 158.0% for AGIs $50k-75k)
Net capital gain/loss in AGI: +$2,300 (reported on 8.3% of returns)
Here:
+$2,300
State:
+$28,402
(% of AGI for various income ranges: 13.7% for AGIs below $25k, 178.0% for AGIs $50k-75k)
Profit/loss from business: +$5,100 (reported on 23.3% of returns)
Here:
+$5,100
State:
+$6,707
(% of AGI for various income ranges: 132.1% for AGIs below $25k, 178.5% for AGIs $25k-50k, 770.0% for AGIs $75k-100k)
Taxable individual retirement arrangement distribution: $8,033 (reported on 5.0% of returns)
31060:
$8,033
Georgia:
$20,525
(% of AGI for various income ranges: 185.4% for AGIs $25k-50k)
Earned income credit: $2,526 (reported on 31.7% of returns)
Here:
$2,526
State:
$2,530
(% of AGI for various income ranges: 170.5% for AGIs below $25k, 120.0% for AGIs $25k-50k)
Percentage of individuals using paid preparers for their 2020 taxes: 98.3%
Here:
98%
State:
93%
(% for various income ranges: 100.0% for AGIs below $25k, 94.1% for AGIs $25k-50k, 100.0% for AGIs $50k-75k, 100.0% for AGIs $75k-100k, 100.0% for AGIs $100k-200k)
Averages for the 2012 tax year for zip code 31060, filed in 2013:
Average Adjusted Gross Income (AGI) in 2012: $35,995 (Individual Income Tax Returns)
Here:
$35,995
State:
$56,131
Salary/wage: $30,809 (reported on 75.4% of returns)
Here:
$30,809
State:
$47,942
(% of AGI for various income ranges: 63.7% for AGIs below $25k, 72.1% for AGIs $25k-50k, 68.1% for AGIs $50k-75k, 62.9% for AGIs $75k-100k, 51.8% for AGIs $100k-200k)
Taxable interest for individuals: $1,017 (reported on 31.6% of returns)
This zip code:
$1,017
Georgia:
$1,706
(% of AGI for various income ranges: 0.9% for AGIs below $25k, 1.1% for AGIs $25k-50k, 0.7% for AGIs $50k-75k, 1.0% for AGIs $75k-100k, 0.8% for AGIs $100k-200k)
Ordinary dividends: $1,975 (reported on 7.0% of returns)
Here:
$1,975
State:
$7,265
Net capital gain/loss in AGI: +$2,620 (reported on 8.8% of returns)
Here:
+$2,620
State:
+$16,323
Profit/loss from business: +$8,015 (reported on 22.8% of returns)
Here:
+$8,015
State:
+$7,583
(% of AGI for various income ranges: 15.8% for AGIs below $25k, 2.5% for AGIs $25k-50k, 7.3% for AGIs $50k-75k)
Taxable individual retirement arrangement distribution: $5,160 (reported on 8.8% of returns)
31060:
$5,160
Georgia:
$17,199
Total itemized deductions: $20,242 (28% of AGI, reported on 21.1% of returns)
Here:
$20,242
State:
$23,886
Here:
27.6% of AGI
State:
21.5% of AGI
(% of AGI for various income ranges: 15.0% for AGIs $25k-50k, 13.1% for AGIs $50k-75k, 15.5% for AGIs $75k-100k, 13.7% for AGIs $100k-200k)
Charity contributions: $5,867 (reported on 21.1% of returns)
Here:
$5,867
State:
$5,507
(% of AGI for various income ranges: 3.6% for AGIs $25k-50k, 3.8% for AGIs $50k-75k, 4.9% for AGIs $75k-100k, 4.7% for AGIs $100k-200k)
Taxes paid: $4,558 (reported on 21.1% of returns)
31060:
$4,558
State:
$7,838
(% of AGI for various income ranges: 2.1% for AGIs $25k-50k, 2.7% for AGIs $50k-75k, 3.7% for AGIs $75k-100k, 5.0% for AGIs $100k-200k)
Earned income credit: $2,633 (reported on 31.6% of returns)
Here:
$2,633
State:
$2,589
(% of AGI for various income ranges: 11.2% for AGIs below $25k, 1.6% for AGIs $25k-50k)
Percentage of individuals using paid preparers for their 2012 taxes: 78.9%
Here:
79%
State:
55%
(% for various income ranges: 74.1% for AGIs below $25k, 80.0% for AGIs $25k-50k, 87.5% for AGIs $50k-75k, 75.0% for AGIs $75k-100k, 100.0% for AGIs $100k-200k)
Averages for the 2004 tax year for zip code 31060, filed in 2005:
Average Adjusted Gross Income (AGI) in 2004: $26,755 (Individual Income Tax Returns)
Here:
$26,755
State:
$47,553
Salary/wage: $25,676 (reported on 79.1% of returns)
Here:
$25,676
State:
$42,178
(% of AGI for various income ranges: 143.1% for AGIs below $10k, 73.1% for AGIs $10k-25k, 81.1% for AGIs $25k-50k, 74.2% for AGIs $50k-75k, 72.8% for AGIs $75k-100k, 55.6% for AGIs over 100k)
Taxable interest for individuals: $1,540 (reported on 39.6% of returns)
This zip code:
$1,540
Georgia:
$1,772
(% of AGI for various income ranges: 14.3% for AGIs below $10k, 3.4% for AGIs $10k-25k, 2.1% for AGIs $25k-50k, 1.6% for AGIs $50k-75k, 0.7% for AGIs $75k-100k, 1.0% for AGIs over 100k)
Taxable dividends: $764 (reported on 10.3% of returns)
Here:
$764
State:
$4,283
(% of AGI for various income ranges: 3.7% for AGIs below $10k, 0.3% for AGIs $10k-25k, 0.1% for AGIs $25k-50k, 0.1% for AGIs $50k-75k, 0.6% for AGIs $75k-100k)
Net capital gain/loss: +$453 (reported on 7.5% of returns)
Here:
+$453
State:
+$16,461
Profit/loss from business: +$5,879 (reported on 15.2% of returns)
Here:
+$5,879
State:
+$8,201
(% of AGI for various income ranges: 17.4% for AGIs below $10k, 3.3% for AGIs $10k-25k, 6.8% for AGIs $25k-50k, 0.8% for AGIs $75k-100k)
Total itemized deductions: $17,959 (34% of AGI, reported on 20.8% of returns)
Here:
$17,959
State:
$19,944
Here:
33.8% of AGI
State:
22.6% of AGI
(% of AGI for various income ranges: 9.4% for AGIs $10k-25k, 15.3% for AGIs $25k-50k, 17.7% for AGIs $50k-75k, 12.7% for AGIs $75k-100k, 15.6% for AGIs over 100k)
Charity contributions deductions: $4,926 (9% of AGI, reported on 19.4% of returns)
Here:
$4,926
State:
$4,354
Here:
9.0% of AGI
State:
4.7% of AGI
(% of AGI for various income ranges: 2.0% for AGIs $10k-25k, 3.2% for AGIs $25k-50k, 4.6% for AGIs $50k-75k, 4.1% for AGIs $75k-100k, 5.9% for AGIs over 100k)
Total tax: $3,130 (reported on 62.4% of returns)
31060:
$3,130
State:
$8,223
(% of AGI for various income ranges: 5.2% for AGIs below $10k, 3.1% for AGIs $10k-25k, 5.9% for AGIs $25k-50k, 8.9% for AGIs $50k-75k, 9.7% for AGIs $75k-100k, 14.0% for AGIs over 100k)
Earned income credit: $1,991 (reported on 30.2% of returns)
Here:
$1,991
State:
$1,986
Percentage of individuals using paid preparers for their 2004 taxes: 82.8%
Here:
83%
State:
62%
(% for various income ranges: 78.7% for AGIs below $10k, 81.6% for AGIs $10k-25k, 83.1% for AGIs $25k-50k, 88.6% for AGIs $50k-75k, 93.1% for AGIs $75k-100k, 100.0% for AGIs over 100k)
Household received Food Stamps/SNAP in the past 12 months: 149 Household did not receive Food Stamps/SNAP in the past 12 months: 505
Women who had a birth in the past 12 months: 3 (0 now married, 3 unmarried) Women who did not have a birth in the past 12 months: 350 (78 now married, 273 unmarried)
Housing units in zip code 31060 with a mortgage: 83 Houses without a mortgage: 4
Median monthly owner costs for units with a mortgage: $877 Median monthly owner costs for units without a mortgage: $446
Residents with income below the poverty level in 2022:
This zip code:
19.5%
Whole state:
12.7%
Residents with income below 50% of the poverty level in 2022:
This zip code:
7.0%
Whole state:
6.3%
Median number of rooms in houses and condos:
Here:
6.3
State:
6.8
Median number of rooms in apartments:
Here:
4.5
State:
4.6
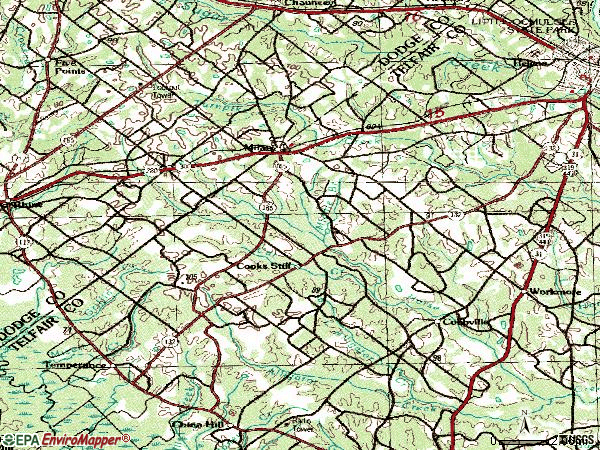
Notable locations in this zip code not listed on our city pages
Churches in zip code 31060 include: Milan Baptist Church (A), Cook Chapel (B), Harmony Church (C), Mount Zion Church (D), Rebecca Church (E), Rockwell Church (F), Sand Grove Church (G), El Bethel Church (H), Siloam Church (I). Display/hide their locations on the map
Cemeteries: Antioch Cemetery (1), Hulett Cemetery (2), Milan City Cemetery (3), Mount Zion Cemetery (4), Rockwell Cemetery (5), Studstill Cemetery (6). Display/hide their locations on the map
Streams, rivers, and creeks: Hurricane Branch (A), Cat Creek (B), Big Branch Horse Creek (C), Middle Branch Horse Creek (D). Display/hide their locations on the map
In group quarters: 41 (-1 institutionalized population)
Size of family households: 143 2-persons, 123 3-persons, 121 4-persons, 8 5-persons, 1 6-persons, 3 7-or-more-persons
Size of nonfamily households: 215 1-person, 28 2-persons
85 married couples with children.
246 single-parent households (190 men, 56 women).
100.4% of residents of 31060 zip code speak English at home.
Foreign born population: 0 (0.1%) (0.0% of them are naturalized citizens)
:
0.1%
Whole state:
10.7%
15%American
6%English
2%Scotch-Irish
1%Irish
1%German
1%French
0%Scottish
Year of entry for the foreign-born population
02010 or later
12000 to 2009
01990 to 1999
0Before 1990
Facilities with environmental interests located in this zip code:
1896 LEONARD JONES ROAD ( in MILAN, GA)
National Pollutant Discharge Elimination System NON-MAJOR (Tracking pollutant discharge elimination systems) - permit Business SIC classification: SEWERAGE SYSTEMS Organizations: CITY OF MILAN (CONTACT/OWNER)
Alternative names: MILAN, CITY OF, MILAN (LAS)
JONES M C LUMBER CO (OFF GA HWY 165 in MILAN, GA)
AIR MINOR (AIRS/AFS) Business SIC classification: SAWMILLS AND PLANING MILLS, GENERAL
MILAN PEANUT CO (US HWY 280 in MILAN, GA)
AIR MINOR (AIRS/AFS) Business SIC classification: FARM-PRODUCT RAW MATERIALS
Housing units lacking complete plumbing facilities: 11.2% Housing units lacking complete kitchen facilities: 9.8%
68.0%Electricity
17.3%Bottled, tank, or LP gas
15.1%Utility gas
Population in 1990: 1,627. Population change in the 1990s: +562 (+34.5%).
Place of birth for U.S.-born residents:
This state: 1,383
Northeast: 83
Midwest: 37
South: 228
80% of the 31060 zip code residents lived in the same house 5 years ago. Out of people who lived in different houses, 61% lived in this county. Out of people who lived in different counties, 50% lived in Georgia.
94% of the 31060 zip code residents lived in the same house 1 year ago. Out of people who lived in different houses, 6% moved from this county. Out of people who lived in different houses, 1% moved from different county within same state. Out of people who lived in different houses, 80% moved from different state. Out of people who lived in different houses, 28% moved from abroad.
Private vs. public school enrollment:
Students in private schools in grades 1 to 8 (elementary and middle school): 11
Here:
8.7%
Georgia:
12.1%
Students in private schools in grades 9 to 12 (high school): 9
Here:
6.6%
Georgia:
10.8%
Students in private undergraduate colleges:
Here:
0.0%
Georgia:
17.1%
Occupation by median earnings in the past 12 months ($)
133,498Management occupations
61,238Construction and extraction occupations
43,940Installation, maintenance, and repair occupations
42,428Office and administrative support occupations
37,923Transportation occupations
33,877Production occupations
Top industries in this zip code by the number of employees in 2005:
Other Services (except Public Administration): Home and Garden Equipment Repair and Maintenance (20-49: 1)
Finance and Insurance: Commercial Banking (10-19: 1, 5-9: 1)
Accommodation and Food Services: Limited-Service Restaurants (10-19: 1)
Other Services (except Public Administration): Religious Organizations (1-4: 4)
People in group quarters in 2000:
250 people in state prisons
Fatal accident statistics in 2011:
Fatal accident count: 2
Vehicles involved in fatal accidents: 3
Fatal accidents caused by drunken drivers: 2
Fatalities: 2
Persons involved in fatal accidents: 4
Pedestrians involved in fatal accidents: 0
2002 - 2018 National Fire Incident Reporting System (NFIRS) incidents
Based on the data from the years 2002 - 2018 the average number of fire incidents per year is 20. The highest number of reported fire incidents - 59 took place in 2014, and the least - 2 in 2008. The data has a constant trend.
When looking into fire subcategories, the most reports belonged to: Structure Fires (48.7%), and Outside Fires (39.1%).
Fire incident types reported to NFIRS in Zip Code 31060


 Nearest zip codes: 31037, 31077, 31011, 31055, 31544, 31023.


 Based on the data from the years 2002 - 2018 the average number of fire incidents per year is 20. The highest number of reported fire incidents - 59 took place in 2014, and the least - 2 in 2008. The data has a constant trend.
 When looking into fire subcategories, the most reports belonged to: Structure Fires (48.7%), and Outside Fires (39.1%).