Estimated zip code population in 2022: 16,625 Zip code population in 2010: 13,839 Zip code population in 2000: 11,279
Houses and condos: 6,752 Renter-occupied apartments: 2,236
% of renters here:
36%
State:
34%
March 2022 cost of living index in zip code 31220: 88.2 (less than average, U.S. average is 100)
Land area: 47.5 sq. mi. Water area: 2.6 sq. mi.
Population density: 350 people per square mile
(very low).
OSM Map
General Map
Google Map
MSN Map
OSM Map
General Map
Google Map
MSN Map
OSM Map
General Map
Google Map
MSN Map
OSM Map
General Map
Google Map
MSN Map
Please wait while loading the map...
Real estate property taxes paid for housing units in 2022:
This zip code:
1.0% ($2,210)
Georgia:
0.7% ($2,160)
Median real estate property taxes paid for housing units with mortgages in 2022: $2,090 (1.0%) Median real estate property taxes paid for housing units with no mortgage in 2022: $2,506 (1.1%)
Business Search- 14 Million verified businesses
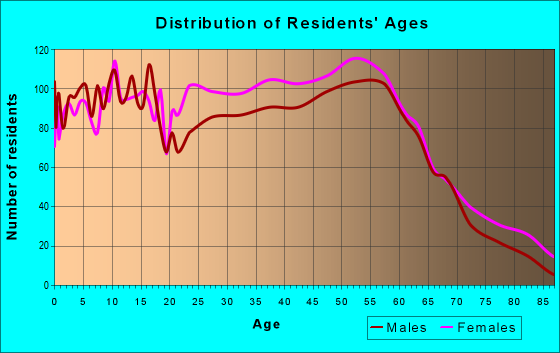
Males: 7,697
(46.3%)
Females: 8,929
(53.7%)
For population 25 years and over in 31220:
High school or higher: 95.2%
Bachelor's degree or higher: 36.1%
Graduate or professional degree: 16.0%
Unemployed: 5.3%
Mean travel time to work (commute): 23.8 minutes
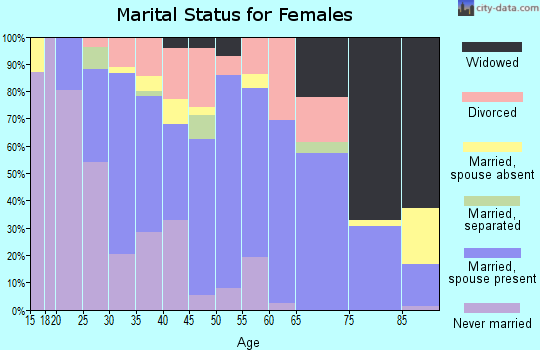
For population 15 years and over in 31220:
Never married: 27.5%
Now married: 57.0%
Separated: 0.9%
Widowed: 6.1%
Divorced: 8.5%
Zip code 31220 compared to state average:
Hispanic race population percentage significantly below state average.
Foreign-born population percentage significantly below state average.
Length of stay since moving in significantly above state average.
Estimated median house/condo value in 2022: $211,409
31220:
$211,409
Georgia:
$297,400
According to our research of Georgia and other state lists, there were 16 registered sex offenders living in 31220 zip code as of May 28, 2024. The ratio of all residents to sex offenders in zip code 31220 is 881 to 1. The ratio of registered sex offenders to all residents in this zip code is lower than the state average.
Median resident age:
This zip code:
41.4 years
Georgia median age:
37.6 years
Average household size:
This zip code:
2.6 people
Georgia:
2.6 people
Averages for the 2020 tax year for zip code 31220, filed in 2021:
Average Adjusted Gross Income (AGI) in 2020: $66,253 (Individual Income Tax Returns)
Here:
$66,253
State:
$70,847
Salary/wage: $54,664 (reported on 81.9% of returns)
Here:
$54,664
State:
$59,126
(% of AGI for various income ranges: 1259.9% for AGIs below $25k, 3760.5% for AGIs $25k-50k, 6514.3% for AGIs $50k-75k, 9764.1% for AGIs $75k-100k, 18678.3% for AGIs $100k-200k, 70775.5% for AGIs over 200k)
Taxable interest for individuals: $1,704 (reported on 26.5% of returns)
This zip code:
$1,704
Georgia:
$2,011
(% of AGI for various income ranges: 10.7% for AGIs below $25k, 24.1% for AGIs $25k-50k, 28.8% for AGIs $50k-75k, 55.6% for AGIs $75k-100k, 152.4% for AGIs $100k-200k, 1429.1% for AGIs over 200k)
Ordinary dividends: $6,678 (reported on 15.0% of returns)
Here:
$6,678
State:
$8,996
(% of AGI for various income ranges: 17.5% for AGIs below $25k, 23.0% for AGIs $25k-50k, 73.9% for AGIs $50k-75k, 145.3% for AGIs $75k-100k, 316.3% for AGIs $100k-200k, 3624.5% for AGIs over 200k)
Net capital gain/loss in AGI: +$13,150 (reported on 13.8% of returns)
Here:
+$13,150
State:
+$28,402
(% of AGI for various income ranges: 7.5% for AGIs below $25k, 20.6% for AGIs $25k-50k, 39.4% for AGIs $50k-75k, 104.4% for AGIs $75k-100k, 498.3% for AGIs $100k-200k, 8648.2% for AGIs over 200k)
Profit/loss from business: +$5,445 (reported on 22.3% of returns)
Here:
+$5,445
State:
+$6,707
(% of AGI for various income ranges: 82.6% for AGIs $50k-75k, 277.1% for AGIs $75k-100k, 465.9% for AGIs $100k-200k, 6130.9% for AGIs over 200k)
Taxable individual retirement arrangement distribution: $20,427 (reported on 7.9% of returns)
31220:
$20,427
Georgia:
$20,525
(% of AGI for various income ranges: 35.4% for AGIs below $25k, 62.7% for AGIs $25k-50k, 234.5% for AGIs $50k-75k, 381.8% for AGIs $75k-100k, 892.2% for AGIs $100k-200k, 2810.9% for AGIs over 200k)
Self-employed (Keogh) retirement plans: $31,367 (reported on 0.4% of returns)
31220:
$31,367
Georgia:
$27,751
(% of AGI for various income ranges: 855.5% for AGIs over 200k)
Total itemized deductions: $34,091 (reported on 13.5% of returns)
Here:
$34,091
State:
$34,001
(% of AGI for various income ranges: 60.4% for AGIs below $25k, 219.7% for AGIs $25k-50k, 572.5% for AGIs $50k-75k, 1078.2% for AGIs $75k-100k, 1950.7% for AGIs $100k-200k, 10987.3% for AGIs over 200k)
Charity contributions: $16,215 (reported on 12.2% of returns)
Here:
$16,215
State:
$14,164
(% of AGI for various income ranges: 12.4% for AGIs below $25k, 59.5% for AGIs $25k-50k, 191.3% for AGIs $50k-75k, 365.0% for AGIs $75k-100k, 772.0% for AGIs $100k-200k, 6320.0% for AGIs over 200k)
Taxes paid: $7,224 (reported on 13.1% of returns)
31220:
$7,224
State:
$7,540
(% of AGI for various income ranges: 8.1% for AGIs below $25k, 35.3% for AGIs $25k-50k, 114.2% for AGIs $50k-75k, 267.4% for AGIs $75k-100k, 522.2% for AGIs $100k-200k, 1879.1% for AGIs over 200k)
Earned income credit: $2,437 (reported on 20.9% of returns)
Here:
$2,437
State:
$2,530
(% of AGI for various income ranges: 123.8% for AGIs below $25k, 87.4% for AGIs $25k-50k)
Percentage of individuals using paid preparers for their 2020 taxes: 92.5%
Here:
93%
State:
93%
(% for various income ranges: 91.5% for AGIs below $25k, 93.6% for AGIs $25k-50k, 91.9% for AGIs $50k-75k, 90.9% for AGIs $75k-100k, 94.0% for AGIs $100k-200k, 94.3% for AGIs over 200k)
Averages for the 2012 tax year for zip code 31220, filed in 2013:
Average Adjusted Gross Income (AGI) in 2012: $60,183 (Individual Income Tax Returns)
Here:
$60,183
State:
$56,131
Salary/wage: $50,837 (reported on 84.5% of returns)
Here:
$50,837
State:
$47,942
(% of AGI for various income ranges: 78.5% for AGIs below $25k, 82.3% for AGIs $25k-50k, 77.5% for AGIs $50k-75k, 74.3% for AGIs $75k-100k, 74.3% for AGIs $100k-200k, 54.6% for AGIs over 200k)
Taxable interest for individuals: $1,834 (reported on 32.1% of returns)
This zip code:
$1,834
Georgia:
$1,706
(% of AGI for various income ranges: 1.1% for AGIs below $25k, 0.6% for AGIs $25k-50k, 0.8% for AGIs $50k-75k, 0.8% for AGIs $75k-100k, 0.7% for AGIs $100k-200k, 1.6% for AGIs over 200k)
Ordinary dividends: $5,486 (reported on 16.0% of returns)
Here:
$5,486
State:
$7,265
(% of AGI for various income ranges: 1.0% for AGIs below $25k, 0.6% for AGIs $25k-50k, 0.9% for AGIs $50k-75k, 0.9% for AGIs $75k-100k, 1.0% for AGIs $100k-200k, 3.2% for AGIs over 200k)
Net capital gain/loss in AGI: +$13,322 (reported on 13.3% of returns)
Here:
+$13,322
State:
+$16,323
(% of AGI for various income ranges: 0.3% for AGIs $25k-50k, 0.3% for AGIs $50k-75k, 0.8% for AGIs $75k-100k, 0.8% for AGIs $100k-200k, 10.3% for AGIs over 200k)
Profit/loss from business: +$10,799 (reported on 18.6% of returns)
Here:
+$10,799
State:
+$7,583
(% of AGI for various income ranges: 6.7% for AGIs below $25k, 1.2% for AGIs $25k-50k, 0.8% for AGIs $50k-75k, 1.6% for AGIs $75k-100k, 2.5% for AGIs $100k-200k, 6.7% for AGIs over 200k)
Taxable individual retirement arrangement distribution: $17,447 (reported on 8.5% of returns)
31220:
$17,447
Georgia:
$17,199
(% of AGI for various income ranges: 2.1% for AGIs below $25k, 1.6% for AGIs $25k-50k, 2.3% for AGIs $50k-75k, 2.9% for AGIs $75k-100k, 2.6% for AGIs $100k-200k, 2.8% for AGIs over 200k)
Self-employment retirement plans: $23,400 (reported on 0.6% of returns)
31220:
$23,400
Georgia:
$23,277
Total itemized deductions: $23,598 (23% of AGI, reported on 42.6% of returns)
Here:
$23,598
State:
$23,886
Here:
23.0% of AGI
State:
21.5% of AGI
(% of AGI for various income ranges: 14.1% for AGIs below $25k, 17.1% for AGIs $25k-50k, 18.0% for AGIs $50k-75k, 17.6% for AGIs $75k-100k, 17.9% for AGIs $100k-200k, 14.9% for AGIs over 200k)
Charity contributions: $5,831 (reported on 37.5% of returns)
Here:
$5,831
State:
$5,507
(% of AGI for various income ranges: 1.6% for AGIs below $25k, 3.0% for AGIs $25k-50k, 3.4% for AGIs $50k-75k, 3.7% for AGIs $75k-100k, 3.9% for AGIs $100k-200k, 4.5% for AGIs over 200k)
Taxes paid: $7,537 (reported on 42.3% of returns)
31220:
$7,537
State:
$7,838
(% of AGI for various income ranges: 2.3% for AGIs below $25k, 3.5% for AGIs $25k-50k, 4.6% for AGIs $50k-75k, 5.5% for AGIs $75k-100k, 6.4% for AGIs $100k-200k, 6.4% for AGIs over 200k)
Earned income credit: $2,375 (reported on 22.1% of returns)
Here:
$2,375
State:
$2,589
(% of AGI for various income ranges: 8.7% for AGIs below $25k, 1.4% for AGIs $25k-50k)
Percentage of individuals using paid preparers for their 2012 taxes: 52.1%
Here:
52%
State:
55%
(% for various income ranges: 47.7% for AGIs below $25k, 51.3% for AGIs $25k-50k, 53.4% for AGIs $50k-75k, 53.6% for AGIs $75k-100k, 56.3% for AGIs $100k-200k, 81.8% for AGIs over 200k)
Averages for the 2004 tax year for zip code 31220, filed in 2005:
Average Adjusted Gross Income (AGI) in 2004: $61,155 (Individual Income Tax Returns)
Here:
$61,155
State:
$47,553
Salary/wage: $50,345 (reported on 86.5% of returns)
Here:
$50,345
State:
$42,178
(% of AGI for various income ranges: 169.4% for AGIs below $10k, 77.8% for AGIs $10k-25k, 82.9% for AGIs $25k-50k, 82.9% for AGIs $50k-75k, 83.1% for AGIs $75k-100k, 57.0% for AGIs over 100k)
Taxable interest for individuals: $1,726 (reported on 42.0% of returns)
This zip code:
$1,726
Georgia:
$1,772
(% of AGI for various income ranges: 10.5% for AGIs below $10k, 2.2% for AGIs $10k-25k, 0.7% for AGIs $25k-50k, 0.6% for AGIs $50k-75k, 0.7% for AGIs $75k-100k, 1.5% for AGIs over 100k)
Taxable dividends: $2,768 (reported on 22.8% of returns)
Here:
$2,768
State:
$4,283
(% of AGI for various income ranges: 6.2% for AGIs below $10k, 1.4% for AGIs $10k-25k, 0.5% for AGIs $25k-50k, 0.6% for AGIs $50k-75k, 0.8% for AGIs $75k-100k, 1.3% for AGIs over 100k)
Net capital gain/loss: +$17,503 (reported on 17.4% of returns)
Here:
+$17,503
State:
+$16,461
(% of AGI for various income ranges: -5.9% for AGIs below $10k, -0.4% for AGIs $10k-25k, 0.2% for AGIs $25k-50k, 0.9% for AGIs $50k-75k, 0.7% for AGIs $75k-100k, 10.3% for AGIs over 100k)
Profit/loss from business: +$10,396 (reported on 17.7% of returns)
Here:
+$10,396
State:
+$8,201
(% of AGI for various income ranges: -9.9% for AGIs below $10k, 3.4% for AGIs $10k-25k, 3.2% for AGIs $25k-50k, 2.6% for AGIs $50k-75k, 2.3% for AGIs $75k-100k, 3.4% for AGIs over 100k)
IRA payment deduction: $3,067 (reported on 2.3% of returns)
31220:
$3,067
Georgia:
$2,969
(% of AGI for various income ranges: 0.2% for AGIs $10k-25k, 0.2% for AGIs $25k-50k, 0.2% for AGIs $50k-75k, 0.1% for AGIs $75k-100k, 0.0% for AGIs over 100k)
Self-employed pension: $14,744 (reported on 0.8% of returns)
Here:
$14,744
Georgia:
$16,203
Total itemized deductions: $24,369 (25% of AGI, reported on 49.1% of returns)
Here:
$24,369
State:
$19,944
Here:
24.6% of AGI
State:
22.6% of AGI
(% of AGI for various income ranges: 20.3% for AGIs below $10k, 13.2% for AGIs $10k-25k, 18.0% for AGIs $25k-50k, 18.0% for AGIs $50k-75k, 19.5% for AGIs $75k-100k, 21.4% for AGIs over 100k)
Charity contributions deductions: $5,151 (5% of AGI, reported on 45.0% of returns)
Here:
$5,151
State:
$4,354
Here:
5.0% of AGI
State:
4.7% of AGI
(% of AGI for various income ranges: 2.4% for AGIs below $10k, 1.7% for AGIs $10k-25k, 3.3% for AGIs $25k-50k, 3.8% for AGIs $50k-75k, 4.2% for AGIs $75k-100k, 4.0% for AGIs over 100k)
Total tax: $9,787 (reported on 78.1% of returns)
31220:
$9,787
State:
$8,223
(% of AGI for various income ranges: 5.6% for AGIs below $10k, 3.9% for AGIs $10k-25k, 6.4% for AGIs $25k-50k, 8.9% for AGIs $50k-75k, 10.1% for AGIs $75k-100k, 17.7% for AGIs over 100k)
Earned income credit: $1,803 (reported on 13.3% of returns)
Here:
$1,803
State:
$1,986
Percentage of individuals using paid preparers for their 2004 taxes: 57.2%
Here:
57%
State:
62%
(% for various income ranges: 49.7% for AGIs below $10k, 57.2% for AGIs $10k-25k, 59.5% for AGIs $25k-50k, 57.4% for AGIs $50k-75k, 57.4% for AGIs $75k-100k, 61.9% for AGIs over 100k)
Likely homosexual households (counted as self-reported same-sex unmarried-partner households)
Lesbian couples: 0.2% of all households
Gay men: 0.0% of all households
Household received Food Stamps/SNAP in the past 12 months: 476 Household did not receive Food Stamps/SNAP in the past 12 months: 5,692
Women who had a birth in the past 12 months: 252 (189 now married, 62 unmarried) Women who did not have a birth in the past 12 months: 3,765 (1,654 now married, 2,109 unmarried)
Housing units in zip code 31220 with a mortgage: 2,422 (232 second mortgage, 141 both second mortgage and home equity loan) Houses without a mortgage: 16
Median monthly owner costs for units with a mortgage: $1,310 Median monthly owner costs for units without a mortgage: $530
Residents with income below the poverty level in 2022:
This zip code:
4.9%
Whole state:
12.7%
Residents with income below 50% of the poverty level in 2022:
This zip code:
3.1%
Whole state:
6.3%
Median number of rooms in houses and condos:
Here:
7.0
State:
6.8
Median number of rooms in apartments:
Here:
5.1
State:
4.6
Notable locations in this zip code not listed on our city pages
Churches in zip code 31220 include: Hazzard Church (A), Commandment Keeping Church (B), Doles Church (C), Fambro Chapel (D), Holy Grove Church (E), Lakeview Chapel (F), Little Rogers Church (G), Pleasant Grove Church (H), Saint John Church (I). Display/hide their locations on the map
Cemeteries: Winn Cemetery (1), Saint Dennis Cemetery (2), Pleasant Grove Cemetery (3), Wadley Cemetery (4), Davis Cemetery (5). Display/hide their locations on the map
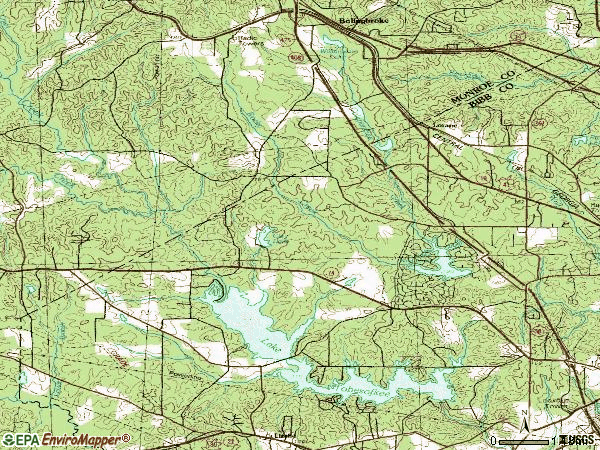
Reservoirs: Huneycut Lake (A), Mceacherns Lake (B), Clay Lake (C), Maynard Lake (D), Lake Tobesofkee (E), Lake Wildwood (F), Clay South Lake (G), Clay Lake North (H). Display/hide their locations on the map
In group quarters: 267 (-1 institutionalized population)
Size of family households: 2,019 2-persons, 1,212 3-persons, 780 4-persons, 278 5-persons, 96 6-persons, 101 7-or-more-persons
Size of nonfamily households: 1,430 1-person, 245 2-persons, 40 3-persons
2,480 married couples with children.
565 single-parent households (15 men, 550 women).
94.8% of residents of 31220 zip code speak English at home.
2.2% of residents speak Spanish at home (70% very well, 30% well).
2.1% of residents speak other Indo-European language at home (65% very well, 25% well, 10% not well).
0.9% of residents speak Asian or Pacific Island language at home (33% very well, 18% well, 49% not well).
Foreign born population: 558 (3.4%) (61.8% of them are naturalized citizens)
Facilities with environmental interests located in this zip code:
BLUE CIRCLE WILLIAMS BROTHERS (COMMERCE DRIVE in MACON, GA)
AIR MINOR (AIRS/AFS) Business SIC classification: INDUSTRIAL LAUNDERERS Alternative names: GEORGIA HEALTHCARE LINEN SERVICES INC
Housing units lacking complete plumbing facilities: 0.8% Housing units lacking complete kitchen facilities: 1.0%
77.1%Electricity
19.9%Utility gas
2.7%Bottled, tank, or LP gas
Place of birth for U.S.-born residents:
This state: 10,551
Northeast: 784
Midwest: 807
South: 3,218
West: 490
47% of the 31220 zip code residents lived in the same house 5 years ago. Out of people who lived in different houses, 55% lived in this county. Out of people who lived in different counties, 50% lived in Georgia.
86% of the 31220 zip code residents lived in the same house 1 year ago. Out of people who lived in different houses, 44% moved from this county. Out of people who lived in different houses, 29% moved from different county within same state. Out of people who lived in different houses, 18% moved from different state. Out of people who lived in different houses, 6% moved from abroad.
Private vs. public school enrollment:
Students in private schools in grades 1 to 8 (elementary and middle school): 354
Here:
18.4%
Georgia:
12.1%
Students in private schools in grades 9 to 12 (high school): 331
Here:
36.2%
Georgia:
10.8%
Students in private undergraduate colleges: 257
Here:
23.9%
Georgia:
17.1%
Occupation by median earnings in the past 12 months ($)
91,951Management occupations
89,161Computer and mathematical occupations
77,276Health diagnosing and treating practitioners and other technical occupations
75,958Fire fighting and prevention, and other protective service workers including supervisors
68,226Business and financial operations occupations
60,283Arts, design, entertainment, sports, and media occupations
Companies with federal contracts located in this zip code (MACON, GA):
GEORGIA HEALTHCARE LINEN SERVI (4269 INTERSTATE PARKWAY; small business) : $794,864 in 7 contractsfrom 1999 to 2005
Contracts for Laundry and DryCleaning Services by Army Signed by year:2000: $208,039; 2001: -$35,547; 2002: $194,733; 2003: $274,707; 2004: $0; 2005: -$48,606; 2006: $0.
Biggest contracts:
$216,707 with Army for Laundry and DryCleaning Services. Signed on 2003-01-14. Completion date: 2003-09-30.
$208,039, same as above.Signed on 2000-11-13. Completion date: 2001-09-30.
$201,538, same as above.Signed on 1999-11-04. Completion date: 2000-09-30.
$194,733, same as above.Signed on 2002-02-22. Completion date: 2003-09-30.
STEWART EQUIPMENT, INC (248 DOLLY MADISON COURT; small business)
$98,894 with Army for Maintenance, Repair or Alteration of Real Property -- Waste Treatment and Storage Facilities. Signed on 2001-05-09. Completion date: 2001-08-31.
INSUL-CON, INC (1080 PARKWAY DRIVE; small business)
$9,414 with Air Force for Maintenance, Repair or Alteration of Real Property -- Production Buildings. Signed on 2004-03-01. Completion date: 2004-03-10.
COMBS COURT REPORTING (201 PEBBLEBROOK LANE; small business) : -$371 in 2 contractsin 2003
$0 with Army for Court Reporting Services. Signed on 2003-11-20. Completion date: 2000-06-30.
-$371, same as above.Signed on 2003-11-20. Completion date: 2000-06-30.
Top industries in this zip code by the number of employees in 2005:
Health Care and Social Assistance: Nursing Care Facilities (100-249 employees: 1 establishment)
Construction: Plumbing, Heating, and Air-Conditioning Contractors (50-99: 1, 1-4: 4)
Other Services (except Public Administration): Religious Organizations (10-19: 3, 5-9: 3, 1-4: 5)
Health Care and Social Assistance: Other Residential Care Facilities (50-99: 1)
Accommodation and Food Services: Limited-Service Restaurants (20-49: 1, 10-19: 2)
Administrative and Support and Waste Management and Remediation Services: Landscaping Services (20-49: 1, 10-19: 1, 5-9: 1, 1-4: 2)
Detailed PMIC statistics for the following Tracts:0134.01
, 0136.01
2005 - 2018 National Fire Incident Reporting System (NFIRS) incidents
Based on the data from the years 2005 - 2018 the average number of fires per year is 20. The highest number of fires - 44 took place in 2006, and the least - 1 in 2015. The data has a rising trend.
When looking into fire subcategories, the most reports belonged to: Outside Fires (47.7%), and Structure Fires (40.6%).
Fire incident types reported to NFIRS in Zip Code 31220


 Nearest zip codes: 31210, 31052, 31206, 31204, 31207, 31213.


 Based on the data from the years 2005 - 2018 the average number of fires per year is 20. The highest number of fires - 44 took place in 2006, and the least - 1 in 2015. The data has a rising trend.
 When looking into fire subcategories, the most reports belonged to: Outside Fires (47.7%), and Structure Fires (40.6%).