Estimated zip code population in 2022: 8,569 Zip code population in 2010: 7,853 Zip code population in 2000: 7,580
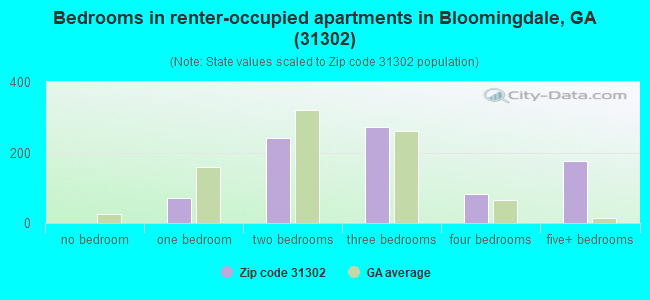
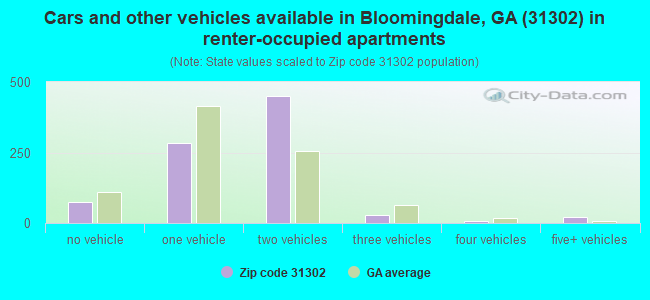
Houses and condos: 3,366 Renter-occupied apartments: 862
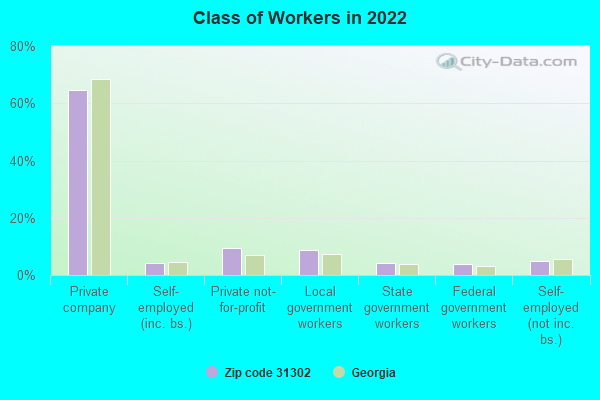
% of renters here:
27%
State:
34%
March 2022 cost of living index in zip code 31302: 81.0 (low, U.S. average is 100)
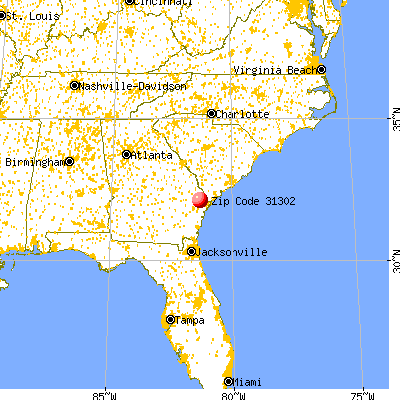
Land area: 42.4 sq. mi. Water area: 3.0 sq. mi.
Population density: 202 people per square mile
(very low).
OSM Map
General Map
Google Map
MSN Map
OSM Map
General Map
Google Map
MSN Map
OSM Map
General Map
Google Map
MSN Map
OSM Map
General Map
Google Map
MSN Map
Please wait while loading the map...
Real estate property taxes paid for housing units in 2022:
This zip code:
0.8% ($1,750)
Georgia:
0.7% ($2,160)
Median real estate property taxes paid for housing units with mortgages in 2022: $2,219 (0.9%) Median real estate property taxes paid for housing units with no mortgage in 2022: $1,476 (0.9%)
Business Search- 14 Million verified businesses
Males: 4,641
(54.2%)
Females: 3,926
(45.8%)
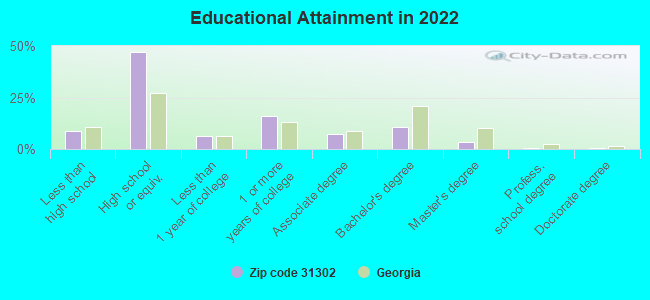
For population 25 years and over in 31302:
High school or higher: 90.5%
Bachelor's degree or higher: 15.1%
Graduate or professional degree: 4.4%
Unemployed: 10.3%
Mean travel time to work (commute): 25.5 minutes
For population 15 years and over in 31302:
Never married: 25.6%
Now married: 53.7%
Separated: 3.6%
Widowed: 5.7%
Divorced: 11.4%
Zip code 31302 compared to state average:
Unemployed percentage above state average.
Black race population percentage significantly below state average.
Hispanic race population percentage significantly below state average.
Median age significantly above state average.
Foreign-born population percentage significantly below state average.
Length of stay since moving in significantly above state average.
Percentage of population with a bachelor's degree or higher below state average.
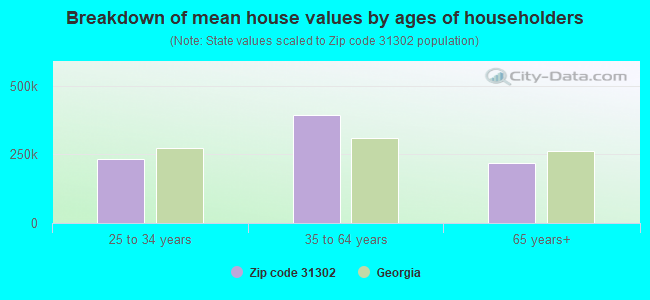
Estimated median house/condo value in 2022: $208,627
31302:
$208,627
Georgia:
$297,400
According to our research of Georgia and other state lists, there were 20 registered sex offenders living in 31302 zip code as of June 08, 2024. The ratio of all residents to sex offenders in zip code 31302 is 436 to 1. The ratio of registered sex offenders to all residents in this zip code is near the state average.
Median resident age:
This zip code:
48.6 years
Georgia median age:
37.6 years
Average household size:
This zip code:
2.7 people
Georgia:
2.6 people
Averages for the 2020 tax year for zip code 31302, filed in 2021:
Average Adjusted Gross Income (AGI) in 2020: $55,924 (Individual Income Tax Returns)
Here:
$55,924
State:
$70,847
Salary/wage: $49,540 (reported on 82.7% of returns)
Here:
$49,540
State:
$59,126
(% of AGI for various income ranges: 1087.4% for AGIs below $25k, 3531.3% for AGIs $25k-50k, 6636.0% for AGIs $50k-75k, 9683.8% for AGIs $75k-100k, 18871.2% for AGIs $100k-200k, 57880.0% for AGIs over 200k)
Taxable interest for individuals: $1,807 (reported on 20.3% of returns)
This zip code:
$1,807
Georgia:
$2,011
(% of AGI for various income ranges: 13.0% for AGIs below $25k, 12.7% for AGIs $25k-50k, 22.9% for AGIs $50k-75k, 112.3% for AGIs $75k-100k, 153.5% for AGIs $100k-200k, 1785.0% for AGIs over 200k)
Ordinary dividends: $3,297 (reported on 8.8% of returns)
Here:
$3,297
State:
$8,996
(% of AGI for various income ranges: 11.8% for AGIs below $25k, 6.8% for AGIs $25k-50k, 65.0% for AGIs $50k-75k, 50.4% for AGIs $75k-100k, 126.5% for AGIs $100k-200k, 935.0% for AGIs over 200k)
Net capital gain/loss in AGI: +$8,306 (reported on 8.5% of returns)
Here:
+$8,306
State:
+$28,402
(% of AGI for various income ranges: 3.1% for AGIs below $25k, 14.2% for AGIs $25k-50k, 87.1% for AGIs $50k-75k, 88.8% for AGIs $75k-100k, 267.3% for AGIs $100k-200k, 6090.0% for AGIs over 200k)
Profit/loss from business: +$5,952 (reported on 17.9% of returns)
Here:
+$5,952
State:
+$6,707
(% of AGI for various income ranges: 162.7% for AGIs below $25k, 151.9% for AGIs $25k-50k, 103.8% for AGIs $50k-75k, 98.1% for AGIs $75k-100k, 189.2% for AGIs $100k-200k)
Taxable individual retirement arrangement distribution: $13,943 (reported on 5.6% of returns)
31302:
$13,943
Georgia:
$20,525
(% of AGI for various income ranges: 36.0% for AGIs below $25k, 51.0% for AGIs $25k-50k, 137.1% for AGIs $50k-75k, 128.8% for AGIs $75k-100k, 481.2% for AGIs $100k-200k)
Total itemized deductions: $27,493 (reported on 7.2% of returns)
Here:
$27,493
State:
$34,001
(% of AGI for various income ranges: 128.8% for AGIs $25k-50k, 251.0% for AGIs $50k-75k, 525.0% for AGIs $75k-100k, 1170.0% for AGIs $100k-200k, 4400.0% for AGIs over 200k)
Charity contributions: $8,374 (reported on 6.1% of returns)
Here:
$8,374
State:
$14,164
(% of AGI for various income ranges: 29.3% for AGIs $25k-50k, 49.8% for AGIs $50k-75k, 123.5% for AGIs $75k-100k, 442.3% for AGIs $100k-200k)
Taxes paid: $7,115 (reported on 7.2% of returns)
31302:
$7,115
State:
$7,540
(% of AGI for various income ranges: 26.8% for AGIs $25k-50k, 64.8% for AGIs $50k-75k, 135.0% for AGIs $75k-100k, 331.5% for AGIs $100k-200k, 1055.0% for AGIs over 200k)
Earned income credit: $2,385 (reported on 19.5% of returns)
Here:
$2,385
State:
$2,530
(% of AGI for various income ranges: 111.8% for AGIs below $25k, 82.1% for AGIs $25k-50k)
Percentage of individuals using paid preparers for their 2020 taxes: 93.1%
Here:
93%
State:
93%
(% for various income ranges: 90.2% for AGIs below $25k, 94.3% for AGIs $25k-50k, 94.8% for AGIs $50k-75k, 94.4% for AGIs $75k-100k, 93.5% for AGIs $100k-200k, 100.0% for AGIs over 200k)
Averages for the 2012 tax year for zip code 31302, filed in 2013:
Average Adjusted Gross Income (AGI) in 2012: $44,571 (Individual Income Tax Returns)
Here:
$44,571
State:
$56,131
Salary/wage: $42,005 (reported on 85.6% of returns)
Here:
$42,005
State:
$47,942
(% of AGI for various income ranges: 74.6% for AGIs below $25k, 81.9% for AGIs $25k-50k, 84.6% for AGIs $50k-75k, 83.3% for AGIs $75k-100k, 80.6% for AGIs $100k-200k, 63.5% for AGIs over 200k)
Taxable interest for individuals: $845 (reported on 20.8% of returns)
This zip code:
$845
Georgia:
$1,706
(% of AGI for various income ranges: 0.6% for AGIs below $25k, 0.4% for AGIs $25k-50k, 0.3% for AGIs $50k-75k, 0.4% for AGIs $75k-100k, 0.4% for AGIs $100k-200k, 0.7% for AGIs over 200k)
Ordinary dividends: $1,476 (reported on 8.5% of returns)
Here:
$1,476
State:
$7,265
(% of AGI for various income ranges: 0.4% for AGIs below $25k, 0.4% for AGIs $25k-50k, 0.1% for AGIs $50k-75k, 0.1% for AGIs $75k-100k, 0.4% for AGIs $100k-200k)
Net capital gain/loss in AGI: +$2,479 (reported on 5.6% of returns)
Here:
+$2,479
State:
+$16,323
(% of AGI for various income ranges: 0.1% for AGIs $25k-50k, 1.3% for AGIs $100k-200k)
Profit/loss from business: +$7,421 (reported on 16.7% of returns)
Here:
+$7,421
State:
+$7,583
(% of AGI for various income ranges: 11.0% for AGIs below $25k, 3.7% for AGIs $25k-50k, 1.9% for AGIs $50k-75k, 0.6% for AGIs $75k-100k, 1.1% for AGIs $100k-200k)
Taxable individual retirement arrangement distribution: $12,932 (reported on 6.5% of returns)
31302:
$12,932
Georgia:
$17,199
(% of AGI for various income ranges: 1.7% for AGIs below $25k, 1.8% for AGIs $25k-50k, 1.7% for AGIs $50k-75k, 2.3% for AGIs $75k-100k, 2.3% for AGIs $100k-200k)
Total itemized deductions: $18,981 (24% of AGI, reported on 31.4% of returns)
Here:
$18,981
State:
$23,886
Here:
24.2% of AGI
State:
21.5% of AGI
(% of AGI for various income ranges: 7.1% for AGIs below $25k, 11.7% for AGIs $25k-50k, 13.3% for AGIs $50k-75k, 15.6% for AGIs $75k-100k, 16.9% for AGIs $100k-200k, 11.2% for AGIs over 200k)
Charity contributions: $3,893 (reported on 24.3% of returns)
Here:
$3,893
State:
$5,507
(% of AGI for various income ranges: 0.7% for AGIs below $25k, 1.7% for AGIs $25k-50k, 2.2% for AGIs $50k-75k, 2.2% for AGIs $75k-100k, 3.0% for AGIs $100k-200k, 2.8% for AGIs over 200k)
Taxes paid: $5,525 (reported on 31.4% of returns)
31302:
$5,525
State:
$7,838
(% of AGI for various income ranges: 1.0% for AGIs below $25k, 2.3% for AGIs $25k-50k, 3.7% for AGIs $50k-75k, 4.8% for AGIs $75k-100k, 5.8% for AGIs $100k-200k, 6.1% for AGIs over 200k)
Earned income credit: $2,340 (reported on 24.0% of returns)
Here:
$2,340
State:
$2,589
(% of AGI for various income ranges: 8.8% for AGIs below $25k, 1.3% for AGIs $25k-50k)
Percentage of individuals using paid preparers for their 2012 taxes: 50.1%
Here:
50%
State:
55%
(% for various income ranges: 46.3% for AGIs below $25k, 48.4% for AGIs $25k-50k, 55.6% for AGIs $50k-75k, 56.2% for AGIs $75k-100k, 61.5% for AGIs $100k-200k)
Averages for the 2004 tax year for zip code 31302, filed in 2005:
Average Adjusted Gross Income (AGI) in 2004: $38,524 (Individual Income Tax Returns)
Here:
$38,524
State:
$47,553
Salary/wage: $35,829 (reported on 87.6% of returns)
Here:
$35,829
State:
$42,178
(% of AGI for various income ranges: 98.2% for AGIs below $10k, 76.7% for AGIs $10k-25k, 85.9% for AGIs $25k-50k, 88.2% for AGIs $50k-75k, 86.9% for AGIs $75k-100k, 60.1% for AGIs over 100k)
Taxable interest for individuals: $918 (reported on 27.8% of returns)
This zip code:
$918
Georgia:
$1,772
(% of AGI for various income ranges: 2.0% for AGIs below $10k, 1.4% for AGIs $10k-25k, 0.5% for AGIs $25k-50k, 0.6% for AGIs $50k-75k, 0.4% for AGIs $75k-100k, 0.7% for AGIs over 100k)
Taxable dividends: $651 (reported on 9.5% of returns)
Here:
$651
State:
$4,283
(% of AGI for various income ranges: 0.4% for AGIs below $10k, 0.4% for AGIs $10k-25k, 0.1% for AGIs $25k-50k, 0.1% for AGIs $50k-75k, 0.1% for AGIs $75k-100k, 0.2% for AGIs over 100k)
Net capital gain/loss: +$5,601 (reported on 6.7% of returns)
Here:
+$5,601
State:
+$16,461
(% of AGI for various income ranges: 0.9% for AGIs below $10k, 0.4% for AGIs $10k-25k, 0.7% for AGIs $25k-50k, 0.1% for AGIs $50k-75k, 0.6% for AGIs $75k-100k, 3.5% for AGIs over 100k)
Profit/loss from business: +$7,059 (reported on 17.1% of returns)
Here:
+$7,059
State:
+$8,201
(% of AGI for various income ranges: 4.6% for AGIs below $10k, 10.1% for AGIs $10k-25k, 3.7% for AGIs $25k-50k, 1.3% for AGIs $50k-75k, 1.0% for AGIs $75k-100k, 2.7% for AGIs over 100k)
IRA payment deduction: $2,565 (reported on 2.2% of returns)
31302:
$2,565
Georgia:
$2,969
Total itemized deductions: $15,549 (24% of AGI, reported on 33.9% of returns)
Here:
$15,549
State:
$19,944
Here:
24.2% of AGI
State:
22.6% of AGI
(% of AGI for various income ranges: 6.1% for AGIs below $10k, 8.4% for AGIs $10k-25k, 12.8% for AGIs $25k-50k, 15.8% for AGIs $50k-75k, 16.9% for AGIs $75k-100k, 12.9% for AGIs over 100k)
Charity contributions deductions: $3,038 (5% of AGI, reported on 29.0% of returns)
Here:
$3,038
State:
$4,354
Here:
4.5% of AGI
State:
4.7% of AGI
(% of AGI for various income ranges: 0.3% for AGIs below $10k, 1.0% for AGIs $10k-25k, 2.0% for AGIs $25k-50k, 2.4% for AGIs $50k-75k, 3.0% for AGIs $75k-100k, 2.9% for AGIs over 100k)
Total tax: $4,709 (reported on 73.3% of returns)
31302:
$4,709
State:
$8,223
(% of AGI for various income ranges: 2.2% for AGIs below $10k, 4.4% for AGIs $10k-25k, 6.4% for AGIs $25k-50k, 8.4% for AGIs $50k-75k, 9.8% for AGIs $75k-100k, 16.8% for AGIs over 100k)
Earned income credit: $1,906 (reported on 21.1% of returns)
Here:
$1,906
State:
$1,986
Percentage of individuals using paid preparers for their 2004 taxes: 63.8%
Here:
64%
State:
62%
(% for various income ranges: 54.2% for AGIs below $10k, 67.0% for AGIs $10k-25k, 63.8% for AGIs $25k-50k, 69.2% for AGIs $50k-75k, 61.5% for AGIs $75k-100k, 70.7% for AGIs over 100k)
Likely homosexual households (counted as self-reported same-sex unmarried-partner households)
Lesbian couples: 0.5% of all households
Gay men: 0.0% of all households
Household received Food Stamps/SNAP in the past 12 months: 537 Household did not receive Food Stamps/SNAP in the past 12 months: 2,616
Women who had a birth in the past 12 months: 193 (98 now married, 95 unmarried) Women who did not have a birth in the past 12 months: 1,127 (492 now married, 634 unmarried)
Housing units in zip code 31302 with a mortgage: 1,109 (65 second mortgage, 58 both second mortgage and home equity loan) Median monthly owner costs for units with a mortgage: $1,521 Median monthly owner costs for units without a mortgage: $467
Residents with income below the poverty level in 2022:
This zip code:
14.1%
Whole state:
12.7%
Residents with income below 50% of the poverty level in 2022:
This zip code:
5.0%
Whole state:
6.3%
Median number of rooms in houses and condos:
Here:
6.4
State:
6.8
Median number of rooms in apartments:
Here:
5.8
State:
4.6
Notable locations in this zip code not listed on our city pages
Notable locations in zip code 31302: Bloomingdale Volunteer Fire Department (A), Effingham Fire / Rescue Station 9 (B), Bloomingdale City Hall (C), Bloomingdale Municipal Court (D). Display/hide their locations on the map
Churches in zip code 31302 include: Falkville Church (A), Kingdom Hall (B), Monterey Park Church (C), Saint James Church (D), International Worship Center (E), Ash Street Baptist Church (F), Alpha United Methodist Church (G), Bloomingdale Alliance Church (H), Piney Grove Church (I). Display/hide their locations on the map
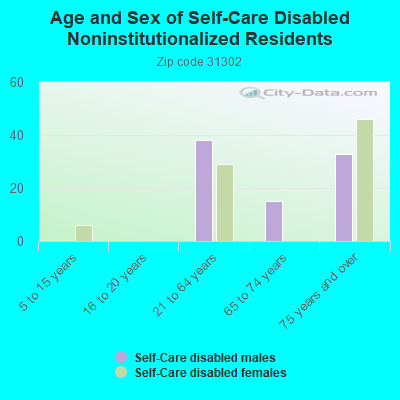
In group quarters: 2 (-1 institutionalized population)
Size of family households: 1,046 2-persons, 639 3-persons, 321 4-persons, 171 5-persons, 94 6-persons, 12 7-or-more-persons
Size of nonfamily households: 673 1-person, 173 2-persons, 17 3-persons
664 married couples with children.
659 single-parent households (242 men, 417 women).
97.0% of residents of 31302 zip code speak English at home.
1.0% of residents speak Spanish at home (46% very well, 54% well).
1.5% of residents speak other Indo-European language at home (100% very well).
0.5% of residents speak Asian or Pacific Island language at home (62% very well, 21% well, 18% not well).
Foreign born population: 241 (2.8%) (58.4% of them are naturalized citizens)
This zip code:
2.8%
Whole state:
10.7%
21%France
15%Honduras
12%St. Vincent and the Grenadines
12%Bhutan
7%Japan
6%Guatemala
5%Poland
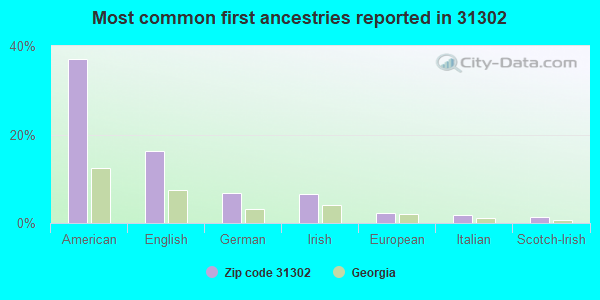
37%American
16%English
7%German
7%Irish
2%European
2%Italian
1%Scotch-Irish
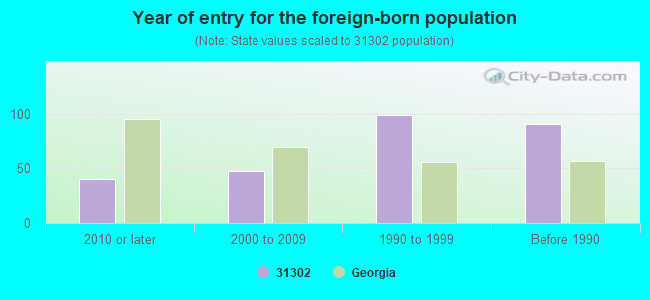
Year of entry for the foreign-born population
402010 or later
482000 to 2009
991990 to 1999
91Before 1990
Facilities with environmental interests located in this zip code:
BLOOMINGDALE ELEMENTARY SCHOOL (101 EAST MAIN STREET in BLOOMINGDALE, GA)
(Geographic Names Information System) (National Center for Education Statistics) - STATE ID-4052 Organizations: CHATHAM COUNTY (SCHOOL DISTRICT)
BUILT RITE TRANSMISSIONS (301 E HWY 80 in BLOOMINGDALE, GA)
(Resource Conservation and Recovery Act (tracking hazardous waste)) Organizations: WILLIAMS CHARLES (CONTACT/OWNER)
BLOOMINGDALE (SWP) ( in BLOOMINGDALE, GA)
National Pollutant Discharge Elimination System NON-MAJOR (Tracking pollutant discharge elimination systems) - permit Business SIC classification: SEWERAGE SYSTEMS Alternative names: BLOOMINGDALE (STORM SEWER SYS)
BUILT RITA PERFORMANCE (6 BRAGG DR in BLOOMINGDALE, GA)
(Resource Conservation and Recovery Act (tracking hazardous waste))
Housing units lacking complete plumbing facilities: 2.8% Housing units lacking complete kitchen facilities: 2.2%
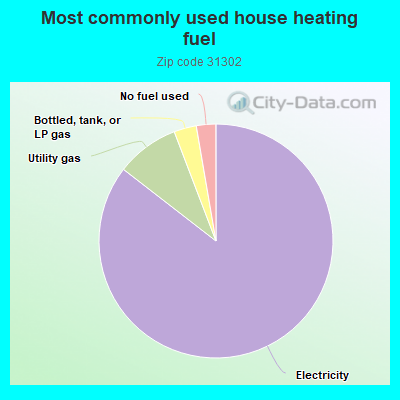
85.5%Electricity
8.7%Utility gas
3.1%Bottled, tank, or LP gas
2.7%No fuel used
Population in 1990: 3,297. Population change in the 1990s: +4,283 (+129.9%).
Place of birth for U.S.-born residents:
This state: 5,436
Northeast: 342
Midwest: 493
South: 1,741
West: 228
62% of the 31302 zip code residents lived in the same house 5 years ago. Out of people who lived in different houses, 42% lived in this county. Out of people who lived in different counties, 50% lived in Georgia.
90% of the 31302 zip code residents lived in the same house 1 year ago. Out of people who lived in different houses, 43% moved from this county. Out of people who lived in different houses, 23% moved from different county within same state. Out of people who lived in different houses, 35% moved from different state.
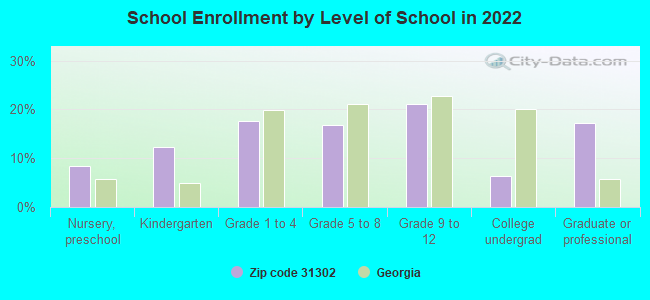
Private vs. public school enrollment:
Students in private schools in grades 1 to 8 (elementary and middle school): 114
Here:
20.8%
Georgia:
12.1%
Students in private schools in grades 9 to 12 (high school): 11
Here:
3.6%
Georgia:
10.8%
Students in private undergraduate colleges: 52
Here:
52.2%
Georgia:
17.1%
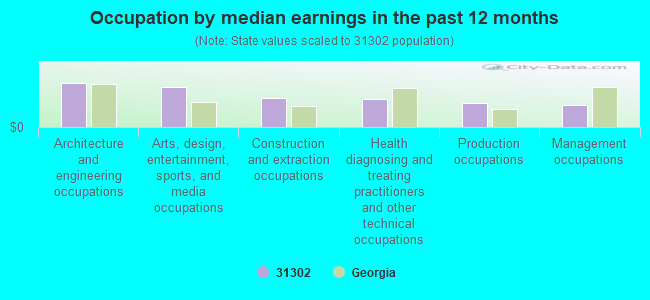
Occupation by median earnings in the past 12 months ($)
103,021Architecture and engineering occupations
92,945Arts, design, entertainment, sports, and media occupations
68,711Construction and extraction occupations
66,024Health diagnosing and treating practitioners and other technical occupations
55,738Production occupations
50,497Management occupations
Companies with federal contracts located in this zip code (BLOOMINGDALE, GA):
QA TECHNOLOGIES, INC (203 OLD RAIL ROAD; small business) : $354,127 in 11 contractsfrom 1999 to 2005
Contracts for Physical Properties Testing and Inspection, Pressure, Temperature, and Humidity Measuring and Controlling Instruments, Engineering and Technical Services, Electrical and Electronic Properties Measuring and Testing Instruments, and moreby Air Force, NASA, Army, Patent and Trademark Office/Under Secretary for Intellectual Property, and others Signed by year:2000: $64,000; 2001: $0; 2002: $141,885; 2003: $17,186; 2004: $14,285; 2005: $30,590; 2006: $0.
Biggest contracts:
$86,181 with Air Force for Physical Properties Testing and Inspection. Signed on 1999-10-29. Completion date: 1999-12-15.
$82,995, same as above.Signed on 2002-04-02. Completion date: 2002-07-02.
$34,000 with NASA for Pressure, Temperature, and Humidity Measuring and Controlling Instruments. Signed on 2000-04-15. Completion date: 2000-07-15.
$30,595 with Air Force for Engineering and Technical Services. Taking place in OK. Signed on 2002-09-13. Completion date: 2003-09-12.
ARCHIE MCNEILL (274 WILDWOOD LN; small business) : $219,621 in 9 contractsfrom 2002 to 2005
Contracts for Program Management/Support Services, Data Analyses (other than scientific), Other Administrative Support Services, Other Professional Services, and moreby Army Signed by year:2000: $0; 2001: $0; 2002: $63,201; 2003: $0; 2004: $106,260; 2005: $50,160; 2006: $0.
Biggest contracts:
$100,490 with Army for Program Management/Support Services. Signed on 2004-09-20. Completion date: 2005-09-30.
$50,160 with Army for Data Analyses (other than scientific). Taking place in FL. Signed on 2005-06-08. Completion date: 2006-06-12.
$31,601 with Army for Other Administrative Support Services. Signed on 2002-10-18. Completion date: 2001-09-30.
$31,600, same as above.Signed on 2002-01-25. Completion date: 2001-09-30.
YATES PAVING & GRADING CO INC (32 CHEYENNE ROAD; small business) : $79,123 in 2 contractsfrom 2002 to 2003
$70,917 with Army for Maintenance, Repair or Alteration of Real Property -- Water Supply Facilities. Signed on 2002-05-21. Completion date: 2002-05-21.
$8,206 with Army for Maintenance, Repair or Alteration of Real Property -- Ammunition Facilities. Signed on 2003-09-19. Completion date: 2000-09-21.
LAYNE CHRISTENSEN COMPANY (604 WEST U S HWY 80; small business)
$42,860 with Army for Maintenance, Repair or Alteration of Real Property -- Water Supply Facilities. Signed on 2002-07-10. Completion date: 2002-07-26.
80 WEST MINI STORAGE INC (1716 E HWY 80; small business) : $36,096 in 3 contractsfrom 2003 to 2005
$21,000 with Army for Prefabricated and Portable Buildings. Signed on 2004-03-10. Completion date: 2004-03-26.
$9,150, same as above.Signed on 2003-12-04. Completion date: 2003-12-19.
$5,946, same as above.Signed on 2005-09-29. Completion date: 2005-10-28.
Top industries in this zip code by the number of employees in 2005:
Construction: Industrial Building Construction (50-99 employees: 1 establishment, 1-4 employees: 1 establishment)
Construction: Commercial and Institutional Building Construction (5-9: 3, 1-4: 2)
Construction: Plumbing, Heating, and Air-Conditioning Contractors (5-9: 2, 1-4: 1)
Other Services (except Public Administration): Commercial and Industrial Machinery and Equipment (except Automotive and Electronic) Repair and Maintenance (10-19: 1)
People in group quarters in 2000:
13 people in homes or halfway houses for drug/alcohol abuse
Fatal accident statistics in 2014:
Fatal accident count: 3
Vehicles involved in fatal accidents: 5
Fatal accidents caused by drunken drivers: 1
Fatalities: 3
Persons involved in fatal accidents: 6
Pedestrians involved in fatal accidents: 1
Fatal accident statistics in 2013:
Fatal accident count: 7
Vehicles involved in fatal accidents: 8
Fatal accidents caused by drunken drivers: 1
Fatalities: 8
Persons involved in fatal accidents: 18
Pedestrians involved in fatal accidents: 1
Home Mortgage Disclosure Act Aggregated Statistics For Year 2009 (Based on 2 full and 6 partial tracts)
A) FHA, FSA/RHS & VA Home Purchase Loans
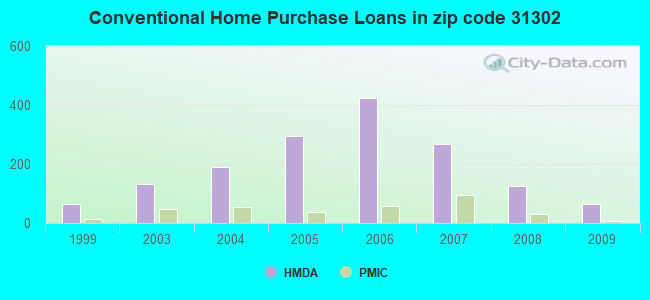
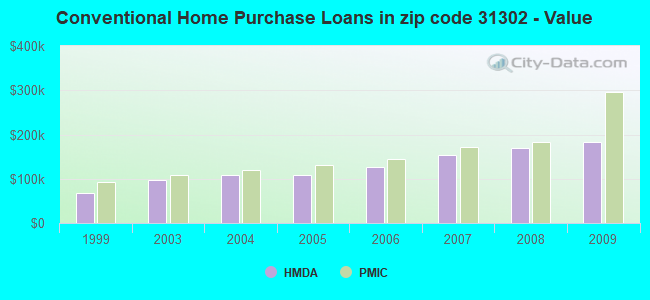
B) Conventional Home Purchase Loans
C) Refinancings
D) Home Improvement Loans
F) Non-occupant Loans on < 5 Family Dwellings (A B C & D)
G) Loans On Manufactured Home Dwelling (A B C & D)
Number
Average Value
Number
Average Value
Number
Average Value
Number
Average Value
Number
Average Value
Number
Average Value
LOANS ORIGINATED
142
$159,428
66
$183,784
321
$164,998
13
$54,668
50
$139,336
40
$61,010
APPLICATIONS APPROVED, NOT ACCEPTED
6
$126,470
8
$202,271
22
$162,880
2
$16,855
2
$287,760
5
$124,078
APPLICATIONS DENIED
20
$143,624
26
$135,864
190
$166,919
22
$21,036
11
$114,725
33
$68,616
APPLICATIONS WITHDRAWN
14
$138,893
8
$222,185
101
$173,642
0
$0
7
$120,970
9
$111,328
FILES CLOSED FOR INCOMPLETENESS
3
$135,693
3
$162,947
24
$158,084
0
$0
1
$274,900
2
$73,690
Aggregated Statistics For Year 2008 (Based on 2 full and 6 partial tracts)
A) FHA, FSA/RHS & VA Home Purchase Loans
B) Conventional Home Purchase Loans
C) Refinancings
D) Home Improvement Loans
F) Non-occupant Loans on < 5 Family Dwellings (A B C & D)
G) Loans On Manufactured Home Dwelling (A B C & D)
Number
Average Value
Number
Average Value
Number
Average Value
Number
Average Value
Number
Average Value
Number
Average Value
LOANS ORIGINATED
142
$161,112
124
$170,596
233
$149,377
20
$64,734
84
$129,354
51
$74,903
APPLICATIONS APPROVED, NOT ACCEPTED
5
$183,618
19
$160,889
36
$125,902
5
$48,970
1
$332,530
5
$62,040
APPLICATIONS DENIED
14
$153,746
34
$108,587
210
$164,629
50
$59,455
17
$115,913
45
$84,280
APPLICATIONS WITHDRAWN
18
$129,832
18
$215,815
91
$176,337
9
$131,374
6
$137,075
5
$45,782
FILES CLOSED FOR INCOMPLETENESS
2
$106,590
2
$111,985
20
$191,162
1
$65,050
0
$0
0
$0
Aggregated Statistics For Year 2007 (Based on 2 full and 6 partial tracts)
A) FHA, FSA/RHS & VA Home Purchase Loans
B) Conventional Home Purchase Loans
C) Refinancings
D) Home Improvement Loans
F) Non-occupant Loans on < 5 Family Dwellings (A B C & D)
G) Loans On Manufactured Home Dwelling (A B C & D)
Number
Average Value
Number
Average Value
Number
Average Value
Number
Average Value
Number
Average Value
Number
Average Value
LOANS ORIGINATED
84
$170,546
269
$153,023
250
$137,748
47
$57,408
87
$113,898
60
$74,966
APPLICATIONS APPROVED, NOT ACCEPTED
0
$0
33
$173,601
79
$129,145
17
$43,175
13
$93,342
13
$69,990
APPLICATIONS DENIED
10
$138,120
59
$127,447
270
$138,668
88
$65,885
25
$60,326
62
$77,062
APPLICATIONS WITHDRAWN
8
$172,715
48
$146,447
118
$169,997
17
$53,690
19
$87,926
10
$72,920
FILES CLOSED FOR INCOMPLETENESS
0
$0
8
$237,145
19
$155,447
1
$57,250
1
$164,050
2
$63,320
Aggregated Statistics For Year 2006 (Based on 2 full and 6 partial tracts)
A) FHA, FSA/RHS & VA Home Purchase Loans
B) Conventional Home Purchase Loans
C) Refinancings
D) Home Improvement Loans
E) Loans on Dwellings For 5+ Families
F) Non-occupant Loans on < 5 Family Dwellings (A B C & D)
G) Loans On Manufactured Home Dwelling (A B C & D)
Number
Average Value
Number
Average Value
Number
Average Value
Number
Average Value
Number
Average Value
Number
Average Value
Number
Average Value
LOANS ORIGINATED
123
$155,280
424
$125,437
285
$131,429
40
$71,354
1
$109,290
94
$94,962
62
$80,881
APPLICATIONS APPROVED, NOT ACCEPTED
2
$179,570
52
$137,228
49
$107,065
4
$24,932
0
$0
8
$119,376
10
$53,779
APPLICATIONS DENIED
7
$131,963
91
$115,262
206
$129,852
57
$46,921
0
$0
21
$81,872
44
$65,938
APPLICATIONS WITHDRAWN
11
$167,073
57
$122,734
119
$131,186
10
$122,242
0
$0
10
$125,779
7
$73,344
FILES CLOSED FOR INCOMPLETENESS
2
$136,605
15
$112,312
45
$131,922
0
$0
0
$0
2
$268,320
2
$92,355
Aggregated Statistics For Year 2005 (Based on 2 full and 6 partial tracts)
A) FHA, FSA/RHS & VA Home Purchase Loans
B) Conventional Home Purchase Loans
C) Refinancings
D) Home Improvement Loans
F) Non-occupant Loans on < 5 Family Dwellings (A B C & D)
G) Loans On Manufactured Home Dwelling (A B C & D)
Number
Average Value
Number
Average Value
Number
Average Value
Number
Average Value
Number
Average Value
Number
Average Value
LOANS ORIGINATED
84
$130,781
295
$107,509
257
$127,613
45
$43,812
80
$100,070
54
$59,486
APPLICATIONS APPROVED, NOT ACCEPTED
3
$109,897
49
$87,065
68
$102,043
11
$45,337
14
$86,176
20
$60,168
APPLICATIONS DENIED
8
$132,639
76
$93,577
153
$117,016
43
$46,675
21
$73,216
68
$60,763
APPLICATIONS WITHDRAWN
3
$140,733
33
$136,874
105
$128,840
19
$104,841
7
$104,959
15
$88,040
FILES CLOSED FOR INCOMPLETENESS
0
$0
8
$123,849
53
$142,216
0
$0
3
$65,373
3
$108,693
Aggregated Statistics For Year 2004 (Based on 2 full and 6 partial tracts)
A) FHA, FSA/RHS & VA Home Purchase Loans
B) Conventional Home Purchase Loans
C) Refinancings
D) Home Improvement Loans
F) Non-occupant Loans on < 5 Family Dwellings (A B C & D)
G) Loans On Manufactured Home Dwelling (A B C & D)
Number
Average Value
Number
Average Value
Number
Average Value
Number
Average Value
Number
Average Value
Number
Average Value
LOANS ORIGINATED
54
$115,401
191
$108,380
301
$116,060
24
$28,645
63
$114,609
60
$62,792
APPLICATIONS APPROVED, NOT ACCEPTED
1
$128,380
29
$110,290
62
$94,820
13
$25,948
2
$41,200
22
$57,016
APPLICATIONS DENIED
4
$161,400
62
$82,382
180
$97,726
36
$43,580
10
$57,709
74
$59,496
APPLICATIONS WITHDRAWN
4
$104,402
26
$118,755
73
$115,238
7
$57,854
5
$114,846
11
$75,205
FILES CLOSED FOR INCOMPLETENESS
0
$0
11
$139,335
33
$125,861
7
$25,550
1
$52,040
6
$67,920
Aggregated Statistics For Year 2003 (Based on 2 full and 6 partial tracts)
A) FHA, FSA/RHS & VA Home Purchase Loans
B) Conventional Home Purchase Loans
C) Refinancings
D) Home Improvement Loans
F) Non-occupant Loans on < 5 Family Dwellings (A B C & D)
Number
Average Value
Number
Average Value
Number
Average Value
Number
Average Value
Number
Average Value
LOANS ORIGINATED
69
$124,983
132
$96,950
441
$97,671
15
$23,208
45
$70,787
APPLICATIONS APPROVED, NOT ACCEPTED
2
$126,640
36
$70,942
69
$89,899
4
$25,580
2
$100,575
APPLICATIONS DENIED
3
$103,460
37
$74,270
168
$87,530
28
$21,603
9
$64,926
APPLICATIONS WITHDRAWN
7
$112,669
13
$114,727
95
$98,470
0
$0
2
$36,660
FILES CLOSED FOR INCOMPLETENESS
1
$90,580
3
$109,907
33
$112,775
1
$86,740
2
$71,675
Aggregated Statistics For Year 1999 (Based on 1 full and 2 partial tracts)
A) FHA, FSA/RHS & VA Home Purchase Loans
B) Conventional Home Purchase Loans
C) Refinancings
D) Home Improvement Loans
F) Non-occupant Loans on < 5 Family Dwellings (A B C & D)
2002 - 2018 National Fire Incident Reporting System (NFIRS) incidents
According to the data from the years 2002 - 2018 the average number of fires per year is 33. The highest number of reported fires - 74 took place in 2018, and the least - 10 in 2002. The data has an increasing trend.
When looking into fire subcategories, the most incidents belonged to: Outside Fires (51.1%), and Structure Fires (27.6%).
Fire incident types reported to NFIRS in Zip Code 31302


 Nearest zip codes: 31318, 31307, 31322, 31308, 31408, 31407.


 According to the data from the years 2002 - 2018 the average number of fires per year is 33. The highest number of reported fires - 74 took place in 2018, and the least - 10 in 2002. The data has an increasing trend.
 When looking into fire subcategories, the most incidents belonged to: Outside Fires (51.1%), and Structure Fires (27.6%).