Estimated zip code population in 2022: 23,459 Zip code population in 2010: 19,269 Zip code population in 2000: 12,302
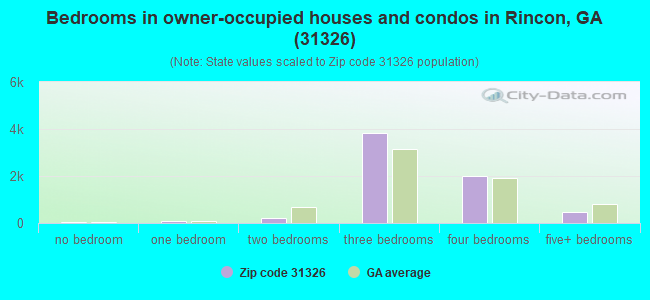
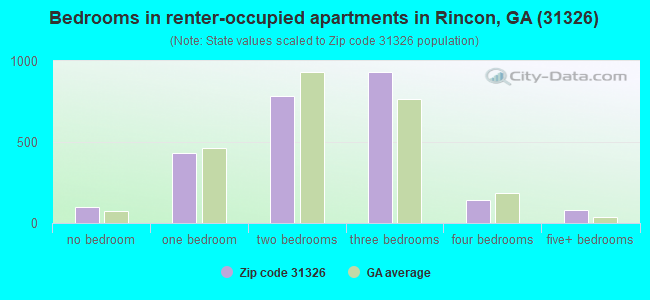
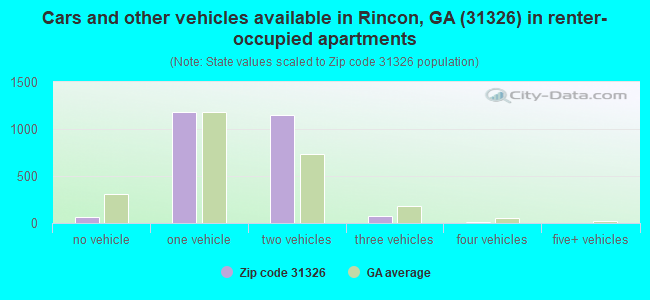
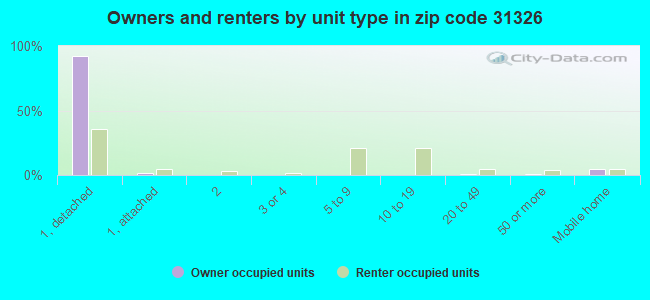
Houses and condos: 9,566 Renter-occupied apartments: 2,462
% of renters here:
27%
State:
34%
March 2022 cost of living index in zip code 31326: 92.4 (less than average, U.S. average is 100)
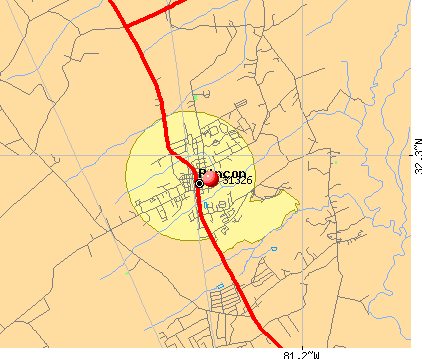
Land area: 70.1 sq. mi. Water area: 0.4 sq. mi.
Population density: 335 people per square mile
(very low).
OSM Map
General Map
Google Map
MSN Map
OSM Map
General Map
Google Map
MSN Map
OSM Map
General Map
Google Map
MSN Map
OSM Map
General Map
Google Map
MSN Map
Please wait while loading the map...
Real estate property taxes paid for housing units in 2022:
This zip code:
0.9% ($2,543)
Georgia:
0.7% ($2,160)
Median real estate property taxes paid for housing units with mortgages in 2022: $2,633 (0.9%) Median real estate property taxes paid for housing units with no mortgage in 2022: $2,190 (1.0%)
Business Search- 14 Million verified businesses
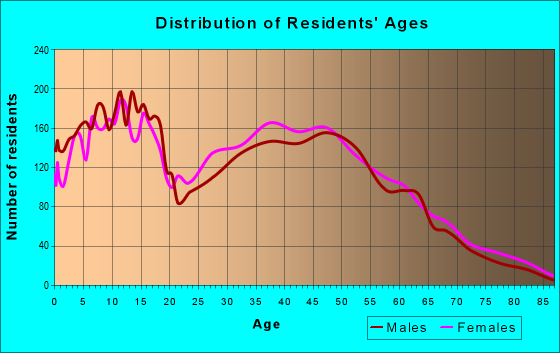
Males: 12,126
(51.7%)
Females: 11,330
(48.3%)
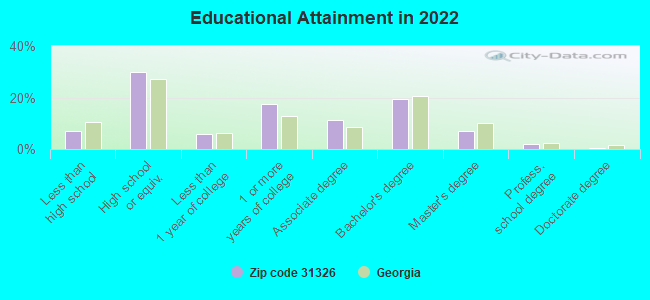
For population 25 years and over in 31326:
High school or higher: 93.2%
Bachelor's degree or higher: 28.7%
Graduate or professional degree: 9.5%
Unemployed: 3.4%
Mean travel time to work (commute): 29.3 minutes
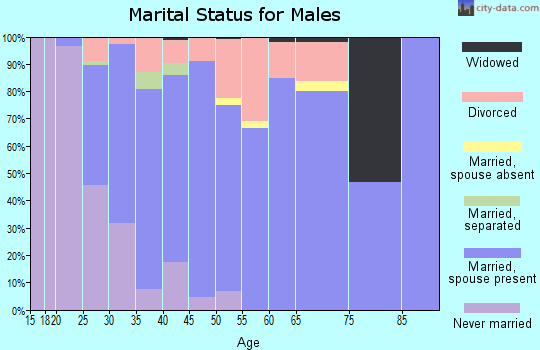
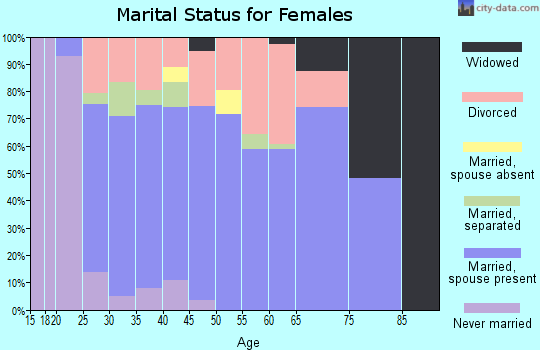
For population 15 years and over in 31326:
Never married: 23.3%
Now married: 60.1%
Separated: 2.0%
Widowed: 5.7%
Divorced: 8.8%
Zip code 31326 compared to state average:
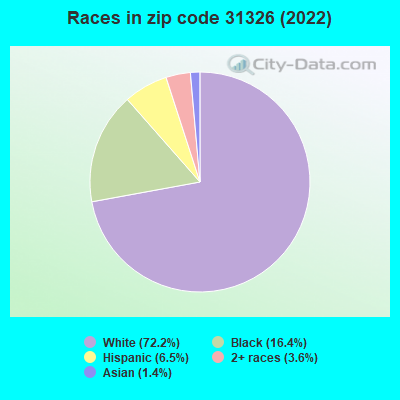
Black race population percentage below state average.
Foreign-born population percentage below state average.
Length of stay since moving in above state average.
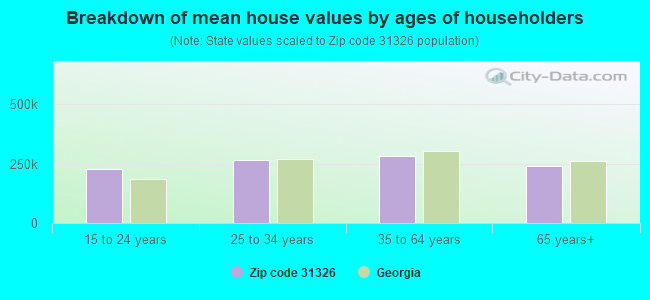
Estimated median house/condo value in 2022: $276,840
31326:
$276,840
Georgia:
$297,400
According to our research of Georgia and other state lists, there were 47 registered sex offenders living in 31326 zip code as of May 25, 2024. The ratio of all residents to sex offenders in zip code 31326 is 429 to 1. The ratio of registered sex offenders to all residents in this zip code is near the state average.
Median resident age:
This zip code:
36.1 years
Georgia median age:
37.6 years
Average household size:
This zip code:
2.6 people
Georgia:
2.6 people
Averages for the 2020 tax year for zip code 31326, filed in 2021:
Average Adjusted Gross Income (AGI) in 2020: $63,809 (Individual Income Tax Returns)
Here:
$63,809
State:
$70,847
Salary/wage: $56,427 (reported on 86.4% of returns)
Here:
$56,427
State:
$59,126
(% of AGI for various income ranges: 1185.8% for AGIs below $25k, 3633.0% for AGIs $25k-50k, 6623.4% for AGIs $50k-75k, 9815.6% for AGIs $75k-100k, 18840.5% for AGIs $100k-200k, 53484.5% for AGIs over 200k)
Taxable interest for individuals: $1,108 (reported on 20.0% of returns)
This zip code:
$1,108
Georgia:
$2,011
(% of AGI for various income ranges: 7.5% for AGIs below $25k, 8.3% for AGIs $25k-50k, 30.2% for AGIs $50k-75k, 39.2% for AGIs $75k-100k, 68.4% for AGIs $100k-200k, 550.9% for AGIs over 200k)
Ordinary dividends: $3,076 (reported on 11.1% of returns)
Here:
$3,076
State:
$8,996
(% of AGI for various income ranges: 4.8% for AGIs below $25k, 13.5% for AGIs $25k-50k, 22.6% for AGIs $50k-75k, 72.2% for AGIs $75k-100k, 112.2% for AGIs $100k-200k, 1124.5% for AGIs over 200k)
Net capital gain/loss in AGI: +$9,585 (reported on 10.4% of returns)
Here:
+$9,585
State:
+$28,402
(% of AGI for various income ranges: 2.5% for AGIs below $25k, 19.5% for AGIs $25k-50k, 24.3% for AGIs $50k-75k, 115.8% for AGIs $75k-100k, 267.9% for AGIs $100k-200k, 5646.4% for AGIs over 200k)
Profit/loss from business: +$4,914 (reported on 16.2% of returns)
Here:
+$4,914
State:
+$6,707
(% of AGI for various income ranges: 67.2% for AGIs below $25k, 64.1% for AGIs $25k-50k, 55.4% for AGIs $50k-75k, 150.6% for AGIs $75k-100k, 184.9% for AGIs $100k-200k, 1488.2% for AGIs over 200k)
Taxable individual retirement arrangement distribution: $16,701 (reported on 6.6% of returns)
31326:
$16,701
Georgia:
$20,525
(% of AGI for various income ranges: 27.6% for AGIs below $25k, 59.4% for AGIs $25k-50k, 137.9% for AGIs $50k-75k, 274.1% for AGIs $75k-100k, 373.5% for AGIs $100k-200k, 1832.7% for AGIs over 200k)
Total itemized deductions: $29,270 (reported on 9.9% of returns)
Here:
$29,270
State:
$34,001
(% of AGI for various income ranges: 34.9% for AGIs below $25k, 140.3% for AGIs $25k-50k, 374.3% for AGIs $50k-75k, 520.4% for AGIs $75k-100k, 1147.0% for AGIs $100k-200k, 5893.6% for AGIs over 200k)
Charity contributions: $11,156 (reported on 8.3% of returns)
Here:
$11,156
State:
$14,164
(% of AGI for various income ranges: 3.4% for AGIs below $25k, 25.2% for AGIs $25k-50k, 87.6% for AGIs $50k-75k, 143.5% for AGIs $75k-100k, 371.1% for AGIs $100k-200k, 2964.5% for AGIs over 200k)
Taxes paid: $7,495 (reported on 9.9% of returns)
31326:
$7,495
State:
$7,540
(% of AGI for various income ranges: 5.3% for AGIs below $25k, 25.2% for AGIs $25k-50k, 90.3% for AGIs $50k-75k, 141.5% for AGIs $75k-100k, 349.2% for AGIs $100k-200k, 1276.4% for AGIs over 200k)
Earned income credit: $2,448 (reported on 18.0% of returns)
Here:
$2,448
State:
$2,530
(% of AGI for various income ranges: 110.7% for AGIs below $25k, 88.0% for AGIs $25k-50k, 1.4% for AGIs $50k-75k)
Percentage of individuals using paid preparers for their 2020 taxes: 94.0%
Here:
94%
State:
93%
(% for various income ranges: 92.9% for AGIs below $25k, 94.7% for AGIs $25k-50k, 94.0% for AGIs $50k-75k, 94.0% for AGIs $75k-100k, 95.0% for AGIs $100k-200k, 93.8% for AGIs over 200k)
Averages for the 2012 tax year for zip code 31326, filed in 2013:
Average Adjusted Gross Income (AGI) in 2012: $55,031 (Individual Income Tax Returns)
Here:
$55,031
State:
$56,131
Salary/wage: $50,459 (reported on 89.2% of returns)
Here:
$50,459
State:
$47,942
(% of AGI for various income ranges: 79.0% for AGIs below $25k, 85.2% for AGIs $25k-50k, 85.2% for AGIs $50k-75k, 85.1% for AGIs $75k-100k, 85.5% for AGIs $100k-200k, 52.8% for AGIs over 200k)
Taxable interest for individuals: $730 (reported on 25.3% of returns)
This zip code:
$730
Georgia:
$1,706
(% of AGI for various income ranges: 0.6% for AGIs below $25k, 0.3% for AGIs $25k-50k, 0.2% for AGIs $50k-75k, 0.3% for AGIs $75k-100k, 0.3% for AGIs $100k-200k, 0.5% for AGIs over 200k)
Ordinary dividends: $1,946 (reported on 11.6% of returns)
Here:
$1,946
State:
$7,265
(% of AGI for various income ranges: 0.4% for AGIs below $25k, 0.4% for AGIs $25k-50k, 0.4% for AGIs $50k-75k, 0.3% for AGIs $75k-100k, 0.4% for AGIs $100k-200k, 0.6% for AGIs over 200k)
Net capital gain/loss in AGI: +$9,857 (reported on 8.2% of returns)
Here:
+$9,857
State:
+$16,323
(% of AGI for various income ranges: 0.1% for AGIs $50k-75k, 0.4% for AGIs $75k-100k, 0.7% for AGIs $100k-200k, 12.4% for AGIs over 200k)
Profit/loss from business: +$4,758 (reported on 13.8% of returns)
Here:
+$4,758
State:
+$7,583
(% of AGI for various income ranges: 7.5% for AGIs below $25k, 0.9% for AGIs $25k-50k, 0.6% for AGIs $50k-75k, 0.9% for AGIs $75k-100k, 0.6% for AGIs $100k-200k)
Taxable individual retirement arrangement distribution: $13,372 (reported on 6.9% of returns)
31326:
$13,372
Georgia:
$17,199
(% of AGI for various income ranges: 1.9% for AGIs below $25k, 1.6% for AGIs $25k-50k, 1.4% for AGIs $50k-75k, 1.7% for AGIs $75k-100k, 2.3% for AGIs $100k-200k)
Total itemized deductions: $20,203 (22% of AGI, reported on 41.3% of returns)
Here:
$20,203
State:
$23,886
Here:
22.5% of AGI
State:
21.5% of AGI
(% of AGI for various income ranges: 8.5% for AGIs below $25k, 12.4% for AGIs $25k-50k, 16.3% for AGIs $50k-75k, 17.1% for AGIs $75k-100k, 16.7% for AGIs $100k-200k, 13.7% for AGIs over 200k)
Charity contributions: $3,843 (reported on 33.4% of returns)
Here:
$3,843
State:
$5,507
(% of AGI for various income ranges: 1.0% for AGIs below $25k, 1.7% for AGIs $25k-50k, 2.2% for AGIs $50k-75k, 2.6% for AGIs $75k-100k, 2.6% for AGIs $100k-200k, 3.3% for AGIs over 200k)
Taxes paid: $6,811 (reported on 41.0% of returns)
31326:
$6,811
State:
$7,838
(% of AGI for various income ranges: 1.7% for AGIs below $25k, 3.0% for AGIs $25k-50k, 4.5% for AGIs $50k-75k, 5.6% for AGIs $75k-100k, 6.6% for AGIs $100k-200k, 6.4% for AGIs over 200k)
Earned income credit: $2,408 (reported on 20.9% of returns)
Here:
$2,408
State:
$2,589
(% of AGI for various income ranges: 9.0% for AGIs below $25k, 1.4% for AGIs $25k-50k)
Percentage of individuals using paid preparers for their 2012 taxes: 46.0%
Here:
46%
State:
55%
(% for various income ranges: 41.3% for AGIs below $25k, 43.2% for AGIs $25k-50k, 47.3% for AGIs $50k-75k, 52.4% for AGIs $75k-100k, 52.2% for AGIs $100k-200k, 83.3% for AGIs over 200k)
Averages for the 2004 tax year for zip code 31326, filed in 2005:
Average Adjusted Gross Income (AGI) in 2004: $48,382 (Individual Income Tax Returns)
Here:
$48,382
State:
$47,553
Salary/wage: $44,615 (reported on 90.6% of returns)
Here:
$44,615
State:
$42,178
(% of AGI for various income ranges: 124.1% for AGIs below $10k, 80.6% for AGIs $10k-25k, 86.9% for AGIs $25k-50k, 90.0% for AGIs $50k-75k, 88.8% for AGIs $75k-100k, 71.3% for AGIs over 100k)
Taxable interest for individuals: $952 (reported on 34.5% of returns)
This zip code:
$952
Georgia:
$1,772
(% of AGI for various income ranges: 3.6% for AGIs below $10k, 1.0% for AGIs $10k-25k, 0.7% for AGIs $25k-50k, 0.5% for AGIs $50k-75k, 0.6% for AGIs $75k-100k, 0.7% for AGIs over 100k)
Taxable dividends: $1,449 (reported on 16.1% of returns)
Here:
$1,449
State:
$4,283
(% of AGI for various income ranges: 2.1% for AGIs below $10k, 0.7% for AGIs $10k-25k, 0.4% for AGIs $25k-50k, 0.3% for AGIs $50k-75k, 0.3% for AGIs $75k-100k, 0.7% for AGIs over 100k)
Net capital gain/loss: +$8,602 (reported on 11.7% of returns)
Here:
+$8,602
State:
+$16,461
(% of AGI for various income ranges: -0.2% for AGIs below $10k, 0.4% for AGIs $10k-25k, 0.5% for AGIs $25k-50k, 0.4% for AGIs $50k-75k, 0.6% for AGIs $75k-100k, 6.1% for AGIs over 100k)
Profit/loss from business: +$6,018 (reported on 13.5% of returns)
Here:
+$6,018
State:
+$8,201
(% of AGI for various income ranges: 3.3% for AGIs below $10k, 5.0% for AGIs $10k-25k, 1.8% for AGIs $25k-50k, 1.0% for AGIs $50k-75k, 0.8% for AGIs $75k-100k, 1.9% for AGIs over 100k)
IRA payment deduction: $3,014 (reported on 2.1% of returns)
31326:
$3,014
Georgia:
$2,969
(% of AGI for various income ranges: 0.1% for AGIs $10k-25k, 0.2% for AGIs $25k-50k, 0.1% for AGIs $50k-75k, 0.1% for AGIs $75k-100k, 0.1% for AGIs over 100k)
Total itemized deductions: $17,112 (23% of AGI, reported on 47.2% of returns)
Here:
$17,112
State:
$19,944
Here:
22.8% of AGI
State:
22.6% of AGI
(% of AGI for various income ranges: 12.6% for AGIs below $10k, 11.4% for AGIs $10k-25k, 16.3% for AGIs $25k-50k, 18.7% for AGIs $50k-75k, 19.0% for AGIs $75k-100k, 15.2% for AGIs over 100k)
Charity contributions deductions: $3,104 (4% of AGI, reported on 40.6% of returns)
Here:
$3,104
State:
$4,354
Here:
4.0% of AGI
State:
4.7% of AGI
(% of AGI for various income ranges: 0.8% for AGIs below $10k, 1.4% for AGIs $10k-25k, 2.4% for AGIs $25k-50k, 2.9% for AGIs $50k-75k, 3.1% for AGIs $75k-100k, 2.5% for AGIs over 100k)
Total tax: $6,217 (reported on 76.9% of returns)
31326:
$6,217
State:
$8,223
(% of AGI for various income ranges: 3.0% for AGIs below $10k, 3.8% for AGIs $10k-25k, 6.0% for AGIs $25k-50k, 7.7% for AGIs $50k-75k, 9.1% for AGIs $75k-100k, 16.6% for AGIs over 100k)
Earned income credit: $1,808 (reported on 15.5% of returns)
Here:
$1,808
State:
$1,986
Percentage of individuals using paid preparers for their 2004 taxes: 59.5%
Here:
59%
State:
62%
(% for various income ranges: 48.0% for AGIs below $10k, 64.6% for AGIs $10k-25k, 61.0% for AGIs $25k-50k, 59.4% for AGIs $50k-75k, 59.3% for AGIs $75k-100k, 66.2% for AGIs over 100k)
Likely homosexual households (counted as self-reported same-sex unmarried-partner households)
Lesbian couples: 0.0% of all households
Gay men: 0.2% of all households
Household received Food Stamps/SNAP in the past 12 months: 677 Household did not receive Food Stamps/SNAP in the past 12 months: 8,417
Women who had a birth in the past 12 months: 470 (379 now married, 92 unmarried) Women who did not have a birth in the past 12 months: 4,849 (2,793 now married, 2,047 unmarried)
Housing units in zip code 31326 with a mortgage: 4,823 (160 second mortgage, 10 home equity loan, 142 both second mortgage and home equity loan) Houses without a mortgage: 37
Median monthly owner costs for units with a mortgage: $1,577 Median monthly owner costs for units without a mortgage: $566
Residents with income below the poverty level in 2022:
This zip code:
5.2%
Whole state:
12.7%
Residents with income below 50% of the poverty level in 2022:
This zip code:
2.6%
Whole state:
6.3%
Median number of rooms in houses and condos:
Here:
6.8
State:
6.8
Median number of rooms in apartments:
Here:
4.9
State:
4.6
Notable locations in this zip code not listed on our city pages
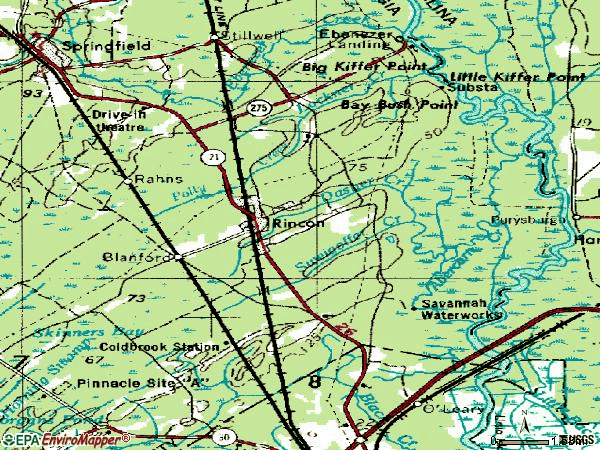
Notable locations in zip code 31326: Newington Landing (A), Old Wood Landing (B), Symons Landing (C), Harris Hinesly Wastewater Treatment Plant (D), Dasha Landing (E), Ebenezer Landing (F), Rincon Fire Department Station 1 (G), Rincon Fire Department Station 2 (H), Savannah Water Works (I), Rincon Town Hall (J). Display/hide their locations on the map
Churches in zip code 31326 include: Abercorn Church (A), Bethel Chapel (B), Church of God (C), Jerusalem Lutheran Church (D), Northside Church (E), Rincon Church (F), Goodwill Church (G), Goshen Church (H), Saint Marys Church (I). Display/hide their locations on the map
Streams, rivers, and creeks: Willowpeg Creek (A), Sweigoffer Creek (B), Rincon Branch (C), Dasher Creek (D), Birds Branch (E), Polly Creek (F), Lockner Creek (G), Little Ebenezer Creek (H). Display/hide their locations on the map
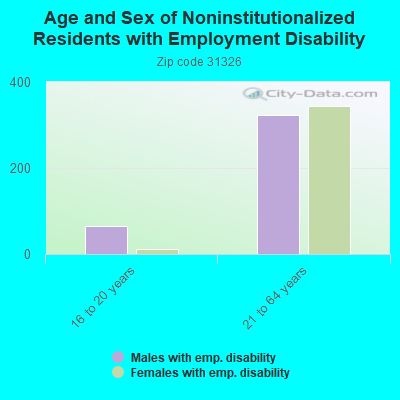
In group quarters: 6 (-1 institutionalized population)
Size of family households: 2,966 2-persons, 1,430 3-persons, 869 4-persons, 710 5-persons, 190 6-persons, 59 7-or-more-persons
Size of nonfamily households: 2,606 1-person, 256 2-persons, 47 3-persons
4,518 married couples with children.
1,155 single-parent households (403 men, 752 women).
93.5% of residents of 31326 zip code speak English at home.
4.0% of residents speak Spanish at home (58% very well, 12% well, 20% not well, 10% not at all).
1.4% of residents speak other Indo-European language at home (72% very well, 6% well, 21% not well).
0.4% of residents speak Asian or Pacific Island language at home (80% very well, 20% well).
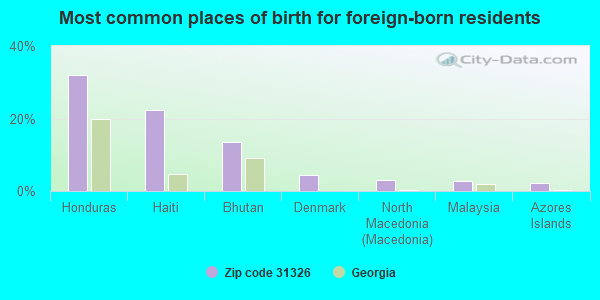
Foreign born population: 1,259 (5.4%) (54.9% of them are naturalized citizens)
This zip code:
5.4%
Whole state:
10.7%
32%Honduras
22%Haiti
14%Bhutan
4%Denmark
3%North Macedonia (Macedonia)
3%Malaysia
2%Azores Islands
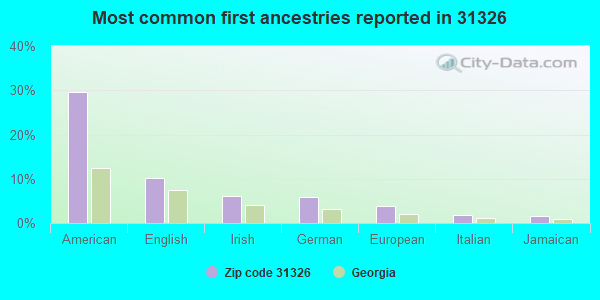
30%American
10%English
6%Irish
6%German
4%European
2%Italian
2%Jamaican
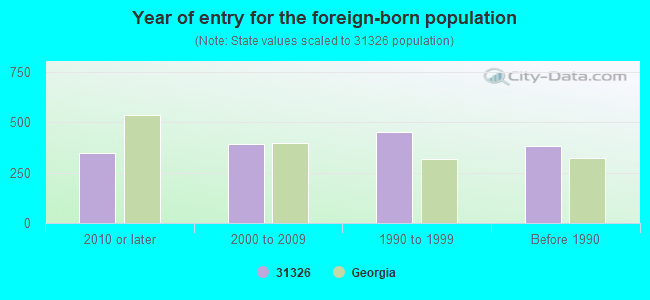
Year of entry for the foreign-born population
3482010 or later
3912000 to 2009
4531990 to 1999
382Before 1990
Facilities with environmental interests located in this zip code:
QUALITY PAINT & BODY (HWY 21 S in RINCON, GA)
Conditionally Exempt Small Quantity Generators, less than 100 kg/month of hazardous waste (Resource Conservation and Recovery Act (tracking hazardous waste)) - notification Organizations: CRISWELL JAMES E (CONTACT/OWNER)
Housing units lacking complete plumbing facilities: 1.1% Housing units lacking complete kitchen facilities: 1.1%
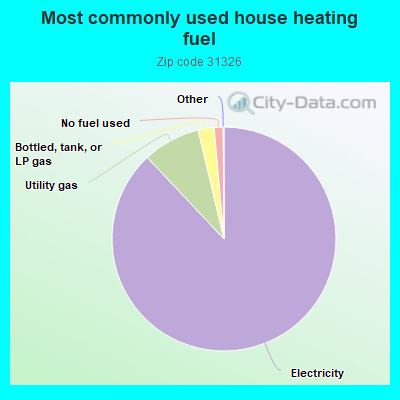
88.0%Electricity
8.3%Utility gas
2.3%Bottled, tank, or LP gas
1.3%No fuel used
Population in 1990: 14,502.
Place of birth for U.S.-born residents:
This state: 12,224
Northeast: 1,704
Midwest: 1,706
South: 4,944
West: 1,265
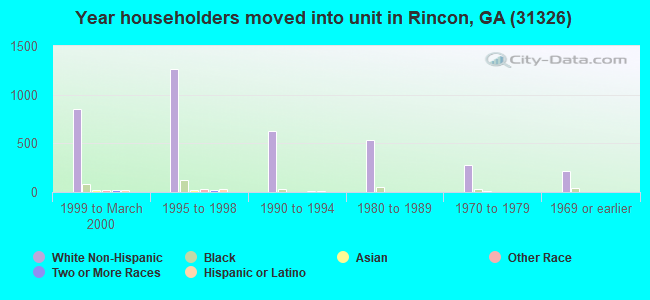
49% of the 31326 zip code residents lived in the same house 5 years ago. Out of people who lived in different houses, 25% lived in this county. Out of people who lived in different counties, 50% lived in Georgia.
86% of the 31326 zip code residents lived in the same house 1 year ago. Out of people who lived in different houses, 27% moved from this county. Out of people who lived in different houses, 37% moved from different county within same state. Out of people who lived in different houses, 35% moved from different state. Out of people who lived in different houses, 2% moved from abroad.
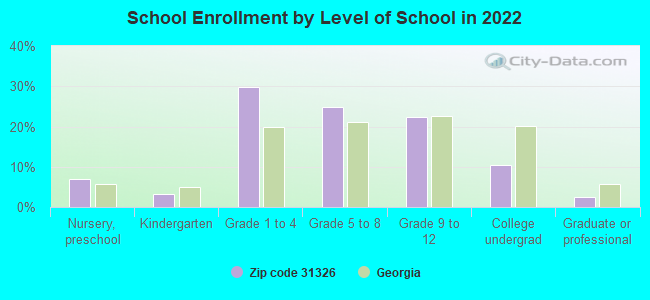
Private vs. public school enrollment:
Students in private schools in grades 1 to 8 (elementary and middle school): 119
Here:
4.0%
Georgia:
12.1%
Students in private schools in grades 9 to 12 (high school): 77
Here:
6.4%
Georgia:
10.8%
Students in private undergraduate colleges: 49
Here:
8.7%
Georgia:
17.1%
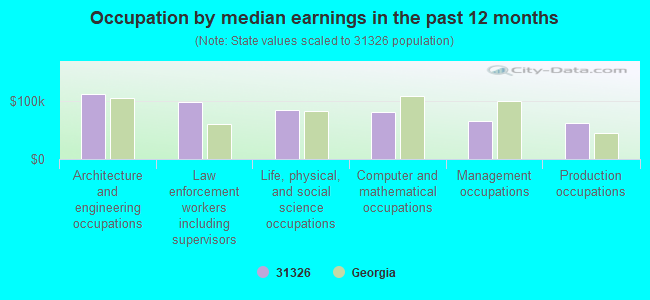
Occupation by median earnings in the past 12 months ($)
112,312Architecture and engineering occupations
97,783Law enforcement workers including supervisors
83,406Life, physical, and social science occupations
81,089Computer and mathematical occupations
65,933Management occupations
61,163Production occupations
Companies with federal contracts located in this zip code:
R M NORTH (215 N LANE in RINCON, GA) : $113,090 in 6 contractsfrom 2003 to 2005
Contracts for Other Environmental Services, Studies, and Analytical Support, Forest/Range Fire Rehabilitation Services (non-construction), Landscaping/Groundskeeping Services by Army, U.S. Army Corps of Engineers - civil program financing only Signed by year:2000: $0; 2001: $0; 2002: $0; 2003: $27,900; 2004: $55,550; 2005: $29,640; 2006: $0.
Biggest contracts:
$27,900 with Army for Other Environmental Services, Studies, and Analytical Support. Signed on 2004-09-14. Completion date: 2004-09-30.
$27,900 with Army for Forest/Range Fire Rehabilitation Services (non-construction). Signed on 2003-09-29. Completion date: 2004-09-30.
$14,820 with U.S. Army Corps of Engineers - civil program financing only for Landscaping/Groundskeeping Services. Signed on 2005-03-07. Completion date: 2005-11-15.
$14,820 with Army for Landscaping/Groundskeeping Services. Signed on 2005-03-07. Completion date: 2005-11-15.
KERSEY ENTERPRISES INC (309 MERION RD in RINCON, GA; small business) : $56,304 in 3 contractsfrom 2003 to 2004
$34,400 with Army for Ground Effect Vehicles. Signed on 2003-07-11. Completion date: 2003-07-18.
$11,807, same as above.Signed on 2004-11-10. Completion date: 2004-11-19.
$10,097 with Army for Miscellaneous Vehicular Components. Signed on 2004-12-10. Completion date: 2004-12-13.
ROOF MAINTENANCE & RESTORATION (5946 MAGNOLIA PL in RINCON, GA; small business) 11 employees, $1500000 revenue.
$4,000 with Public Buildings Service for Maintenance, Repair or Alteration of Real Property -- Office Buildings. Signed on 2002-05-15. Completion date: 2002-05-15.
Top industries in this zip code by the number of employees in 2005:
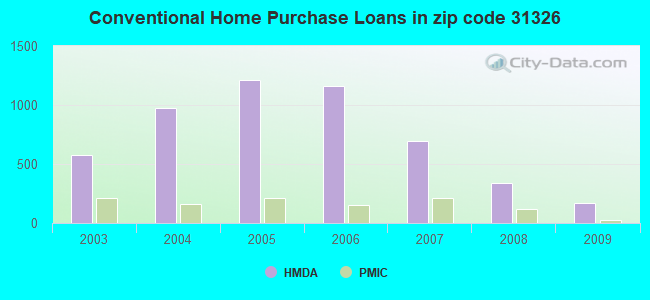
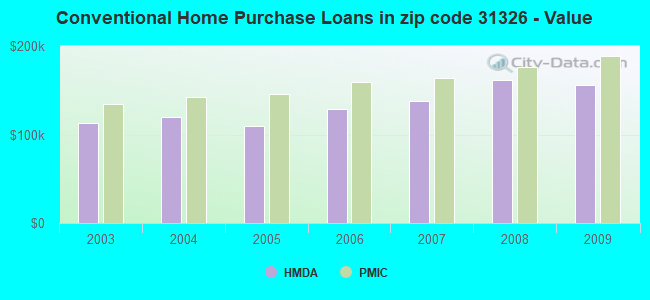
Detailed PMIC statistics for the following Tracts:0303.01
, 0303.02
2003 - 2018 National Fire Incident Reporting System (NFIRS) incidents
According to the data from the years 2003 - 2018 the average number of fire incidents per year is 48. The highest number of fires - 117 took place in 2014, and the least - 0 in 2004. The data has an increasing trend.
When looking into fire subcategories, the most reports belonged to: Outside Fires (45.2%), and Structure Fires (39.4%).
Fire incident types reported to NFIRS in Zip Code 31326


 Nearest zip codes: 31407, 31312, 31329, 31408, 29927, 31322.
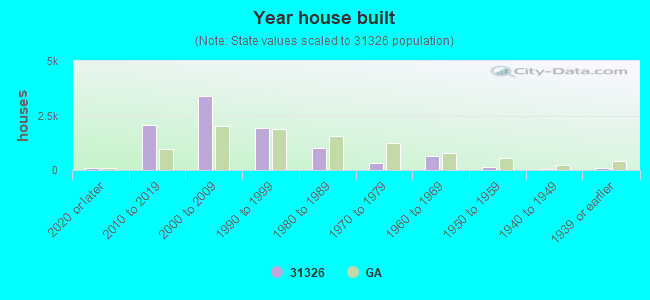


 According to the data from the years 2003 - 2018 the average number of fire incidents per year is 48. The highest number of fires - 117 took place in 2014, and the least - 0 in 2004. The data has an increasing trend.
 When looking into fire subcategories, the most reports belonged to: Outside Fires (45.2%), and Structure Fires (39.4%).