Estimated zip code population in 2022: 4,562 Zip code population in 2010: 4,796 Zip code population in 2000: 3,888
Houses and condos: 2,237 Renter-occupied apartments: 233
% of renters here:
14%
State:
34%
March 2022 cost of living index in zip code 31543: 79.9 (low, U.S. average is 100)
Land area: 124.9 sq. mi. Water area: 0.5 sq. mi.
Population density: 37 people per square mile
(very low).
OSM Map
General Map
Google Map
MSN Map
OSM Map
General Map
Google Map
MSN Map
OSM Map
General Map
Google Map
MSN Map
OSM Map
General Map
Google Map
MSN Map
Please wait while loading the map...
Real estate property taxes paid for housing units in 2022:
This zip code:
1.1% ($1,098)
Georgia:
0.7% ($2,160)
Median real estate property taxes paid for housing units with mortgages in 2022: $2,182 (1.2%) Median real estate property taxes paid for housing units with no mortgage in 2022: $783 (1.2%)
Business Search- 14 Million verified businesses
Males: 2,163
(47.4%)
Females: 2,399
(52.6%)
For population 25 years and over in 31543:
High school or higher: 86.6%
Bachelor's degree or higher: 12.3%
Graduate or professional degree: 5.7%
Unemployed: 2.1%
Mean travel time to work (commute): 33.3 minutes
For population 15 years and over in 31543:
Never married: 28.3%
Now married: 49.5%
Separated: 1.8%
Widowed: 12.3%
Divorced: 8.1%
Zip code 31543 compared to state average:
Median household income below state average.
Median house value significantly below state average.
Unemployed percentage below state average.
Black race population percentage significantly below state average.
Hispanic race population percentage significantly below state average.
Median age above state average.
Foreign-born population percentage significantly below state average.
Renting percentage significantly below state average.
Length of stay since moving in significantly above state average.
Number of college students below state average.
Percentage of population with a bachelor's degree or higher significantly below state average.
Averages for the 2020 tax year for zip code 31543, filed in 2021:
Average Adjusted Gross Income (AGI) in 2020: $42,787 (Individual Income Tax Returns)
Here:
$42,787
State:
$70,847
Salary/wage: $41,080 (reported on 83.2% of returns)
Here:
$41,080
State:
$59,126
(% of AGI for various income ranges: 1052.4% for AGIs below $25k, 3459.8% for AGIs $25k-50k, 6324.5% for AGIs $50k-75k, 9075.0% for AGIs $75k-100k, 19147.0% for AGIs $100k-200k)
Taxable interest for individuals: $350 (reported on 15.3% of returns)
This zip code:
$350
Georgia:
$2,011
(% of AGI for various income ranges: 6.2% for AGIs below $25k, 4.9% for AGIs $25k-50k, 4.0% for AGIs $50k-75k, 7.5% for AGIs $75k-100k, 24.0% for AGIs $100k-200k)
Ordinary dividends: $880 (reported on 5.1% of returns)
Here:
$880
State:
$8,996
(% of AGI for various income ranges: 8.2% for AGIs $25k-50k, 10.0% for AGIs $50k-75k, 26.0% for AGIs $100k-200k)
Net capital gain/loss in AGI: +$2,350 (reported on 5.1% of returns)
Here:
+$2,350
State:
+$28,402
(% of AGI for various income ranges: 2.9% for AGIs below $25k, 2.2% for AGIs $25k-50k, 69.0% for AGIs $50k-75k, 68.0% for AGIs $100k-200k)
Profit/loss from business: +$6,197 (reported on 15.8% of returns)
Here:
+$6,197
State:
+$6,707
(% of AGI for various income ranges: 195.1% for AGIs below $25k, 69.0% for AGIs $25k-50k, 134.0% for AGIs $50k-75k, 59.2% for AGIs $75k-100k, 1.0% for AGIs $100k-200k)
Taxable individual retirement arrangement distribution: $11,760 (reported on 5.1% of returns)
31543:
$11,760
Georgia:
$20,525
(% of AGI for various income ranges: 36.2% for AGIs below $25k, 81.8% for AGIs $25k-50k, 442.5% for AGIs $75k-100k)
Total itemized deductions: $26,917 (reported on 3.1% of returns)
Here:
$26,917
State:
$34,001
(% of AGI for various income ranges: 173.5% for AGIs $25k-50k, 730.0% for AGIs $100k-200k)
Charity contributions: $11,700 (reported on 2.0% of returns)
Here:
$11,700
State:
$14,164
(% of AGI for various income ranges: 32.0% for AGIs $25k-50k, 305.0% for AGIs $100k-200k)
Taxes paid: $6,267 (reported on 3.1% of returns)
31543:
$6,267
State:
$7,540
(% of AGI for various income ranges: 27.6% for AGIs $25k-50k, 235.0% for AGIs $100k-200k)
Earned income credit: $2,732 (reported on 29.1% of returns)
Here:
$2,732
State:
$2,530
(% of AGI for various income ranges: 153.7% for AGIs below $25k, 115.5% for AGIs $25k-50k)
Percentage of individuals using paid preparers for their 2020 taxes: 96.4%
Here:
96%
State:
93%
(% for various income ranges: 96.2% for AGIs below $25k, 98.3% for AGIs $25k-50k, 96.0% for AGIs $50k-75k, 93.8% for AGIs $75k-100k, 94.4% for AGIs $100k-200k)
Averages for the 2012 tax year for zip code 31543, filed in 2013:
Average Adjusted Gross Income (AGI) in 2012: $35,904 (Individual Income Tax Returns)
Here:
$35,904
State:
$56,131
Salary/wage: $33,946 (reported on 85.1% of returns)
Here:
$33,946
State:
$47,942
(% of AGI for various income ranges: 74.3% for AGIs below $25k, 83.8% for AGIs $25k-50k, 84.0% for AGIs $50k-75k, 82.9% for AGIs $75k-100k, 74.6% for AGIs $100k-200k)
Taxable interest for individuals: $403 (reported on 17.3% of returns)
This zip code:
$403
Georgia:
$1,706
(% of AGI for various income ranges: 0.5% for AGIs below $25k, 0.1% for AGIs $50k-75k, 0.2% for AGIs $75k-100k, 0.1% for AGIs $100k-200k)
Ordinary dividends: $625 (reported on 4.8% of returns)
Here:
$625
State:
$7,265
Net capital gain/loss in AGI: +$1,183 (reported on 3.6% of returns)
Here:
+$1,183
State:
+$16,323
Profit/loss from business: +$5,359 (reported on 17.3% of returns)
Here:
+$5,359
State:
+$7,583
(% of AGI for various income ranges: 11.1% for AGIs below $25k, 2.6% for AGIs $25k-50k)
Taxable individual retirement arrangement distribution: $13,489 (reported on 5.4% of returns)
31543:
$13,489
Georgia:
$17,199
(% of AGI for various income ranges: 2.3% for AGIs below $25k, 1.7% for AGIs $25k-50k, 5.2% for AGIs $50k-75k)
Total itemized deductions: $18,682 (25% of AGI, reported on 19.6% of returns)
Here:
$18,682
State:
$23,886
Here:
25.3% of AGI
State:
21.5% of AGI
(% of AGI for various income ranges: 3.8% for AGIs below $25k, 7.6% for AGIs $25k-50k, 12.1% for AGIs $50k-75k, 13.0% for AGIs $75k-100k, 15.3% for AGIs $100k-200k)
Charity contributions: $4,208 (reported on 14.9% of returns)
Here:
$4,208
State:
$5,507
(% of AGI for various income ranges: 0.6% for AGIs below $25k, 0.8% for AGIs $25k-50k, 1.9% for AGIs $50k-75k, 2.5% for AGIs $75k-100k, 3.3% for AGIs $100k-200k)
Taxes paid: $5,364 (reported on 19.6% of returns)
31543:
$5,364
State:
$7,838
(% of AGI for various income ranges: 0.6% for AGIs below $25k, 1.5% for AGIs $25k-50k, 2.9% for AGIs $50k-75k, 4.4% for AGIs $75k-100k, 6.0% for AGIs $100k-200k)
Earned income credit: $2,686 (reported on 34.5% of returns)
Here:
$2,686
State:
$2,589
(% of AGI for various income ranges: 11.7% for AGIs below $25k, 2.0% for AGIs $25k-50k)
Percentage of individuals using paid preparers for their 2012 taxes: 57.7%
Here:
58%
State:
55%
(% for various income ranges: 57.1% for AGIs below $25k, 56.1% for AGIs $25k-50k, 60.9% for AGIs $50k-75k, 61.5% for AGIs $75k-100k, 57.1% for AGIs $100k-200k)
Averages for the 2004 tax year for zip code 31543, filed in 2005:
Average Adjusted Gross Income (AGI) in 2004: $32,040 (Individual Income Tax Returns)
Here:
$32,040
State:
$47,553
Salary/wage: $30,214 (reported on 87.1% of returns)
Here:
$30,214
State:
$42,178
(% of AGI for various income ranges: 89.9% for AGIs below $10k, 77.6% for AGIs $10k-25k, 86.6% for AGIs $25k-50k, 85.9% for AGIs $50k-75k, 86.3% for AGIs $75k-100k, 62.5% for AGIs over 100k)
Taxable interest for individuals: $895 (reported on 24.1% of returns)
This zip code:
$895
Georgia:
$1,772
(% of AGI for various income ranges: 2.5% for AGIs below $10k, 1.6% for AGIs $10k-25k, 0.4% for AGIs $25k-50k, 0.3% for AGIs $50k-75k, 0.3% for AGIs $75k-100k, 0.9% for AGIs over 100k)
Taxable dividends: $411 (reported on 6.5% of returns)
Here:
$411
State:
$4,283
(% of AGI for various income ranges: 0.1% for AGIs $10k-25k, 0.1% for AGIs $25k-50k, 0.1% for AGIs $50k-75k, 0.2% for AGIs $75k-100k)
Net capital gain/loss: +$2,850 (reported on 5.4% of returns)
Here:
+$2,850
State:
+$16,461
(% of AGI for various income ranges: 0.3% for AGIs $10k-25k, -0.1% for AGIs $25k-50k, 0.2% for AGIs $50k-75k, -0.3% for AGIs $75k-100k, 3.7% for AGIs over 100k)
Profit/loss from business: +$5,562 (reported on 18.8% of returns)
Here:
+$5,562
State:
+$8,201
(% of AGI for various income ranges: 13.8% for AGIs below $10k, 10.7% for AGIs $10k-25k, 3.1% for AGIs $25k-50k, -0.1% for AGIs $50k-75k, 1.5% for AGIs $75k-100k)
IRA payment deduction: $1,500 (reported on 0.7% of returns)
31543:
$1,500
Georgia:
$2,969
Total itemized deductions: $15,343 (26% of AGI, reported on 20.8% of returns)
Here:
$15,343
State:
$19,944
Here:
25.7% of AGI
State:
22.6% of AGI
(% of AGI for various income ranges: 4.5% for AGIs $10k-25k, 8.8% for AGIs $25k-50k, 13.0% for AGIs $50k-75k, 12.1% for AGIs $75k-100k, 14.2% for AGIs over 100k)
Charity contributions deductions: $3,735 (6% of AGI, reported on 16.9% of returns)
Here:
$3,735
State:
$4,354
Here:
6.0% of AGI
State:
4.7% of AGI
(% of AGI for various income ranges: 0.7% for AGIs $10k-25k, 1.4% for AGIs $25k-50k, 2.1% for AGIs $50k-75k, 3.4% for AGIs $75k-100k, 4.0% for AGIs over 100k)
Total tax: $3,623 (reported on 67.6% of returns)
31543:
$3,623
State:
$8,223
(% of AGI for various income ranges: 3.7% for AGIs below $10k, 4.0% for AGIs $10k-25k, 5.4% for AGIs $25k-50k, 8.0% for AGIs $50k-75k, 10.8% for AGIs $75k-100k, 15.4% for AGIs over 100k)
Earned income credit: $2,058 (reported on 30.4% of returns)
Here:
$2,058
State:
$1,986
Percentage of individuals using paid preparers for their 2004 taxes: 71.7%
Here:
72%
State:
62%
(% for various income ranges: 70.8% for AGIs below $10k, 72.9% for AGIs $10k-25k, 72.7% for AGIs $25k-50k, 70.6% for AGIs $50k-75k, 63.9% for AGIs $75k-100k, 70.0% for AGIs over 100k)
Likely homosexual households (counted as self-reported same-sex unmarried-partner households)
Lesbian couples: 0.0% of all households
Gay men: 0.8% of all households
Household received Food Stamps/SNAP in the past 12 months: 329 Household did not receive Food Stamps/SNAP in the past 12 months: 1,377
Women who had a birth in the past 12 months: 33 (9 now married, 24 unmarried) Women who did not have a birth in the past 12 months: 896 (358 now married, 537 unmarried)
Housing units in zip code 31543 with a mortgage: 381 (30 second mortgage, 9 home equity loan, 22 both second mortgage and home equity loan) Median monthly owner costs for units with a mortgage: $1,166 Median monthly owner costs for units without a mortgage: $350
Residents with income below the poverty level in 2022:
This zip code:
12.3%
Whole state:
12.7%
Residents with income below 50% of the poverty level in 2022:
This zip code:
9.0%
Whole state:
6.3%
Median number of rooms in houses and condos:
Here:
6.2
State:
6.8
Median number of rooms in apartments:
Here:
6.0
State:
4.6
Notable locations in this zip code not listed on our city pages
Notable locations in zip code 31543: Mouth of the Branch Landing (A), Tabernacle Camp Ground (B), Spell Landing (C), Strickland Landing (D), Rosin Landing (E), Hortense Volunteer Fire Department (F), Wayne County Fire Department Mount Pleasant Station (G). Display/hide their locations on the map
Churches in zip code 31543 include: Hortense Church (A), Christian Fellowship Church (B), Liberty Church (C), Hope Chapel (D), Hopewell Baptist Church (E), Hortense Memorial Church (F), Little Memorial (G), Sloan Hill Church (H), Trinity Church (I). Display/hide their locations on the map
Cemeteries: Lane Cemetery (1), Ammons Cemetery (2), Barnwell Cemetery (3), Little Memorial Cemetery (4), Satilla Cemetery (5), McCool Cemetery (6), Chapman Cemetery (7). Display/hide their locations on the map
Lakes and swamps: Drurys Lake (A), Basin Lake (B), Abrahams Lake (C), Heads Lake (D), Cypress Lake (E), Fox Head (F), Alligator Swamp (G), Burnt Scrub Swamp (H). Display/hide their locations on the map
Streams, rivers, and creeks: Well Branch (A), Tenmile Swamp (B), Seals Branch (C), Satilla Creek (D), Harper Branch (E), Church House Branch (F), Pigeonroost Creek (G), Page Branch (H), Barbers Creek (I). Display/hide their locations on the map
Size of family households: 552 2-persons, 175 3-persons, 153 4-persons, 114 5-persons, 3 6-persons, 40 7-or-more-persons
Size of nonfamily households: 649 1-person
499 married couples with children.
334 single-parent households (61 men, 273 women).
99.3% of residents of 31543 zip code speak English at home.
0.4% of residents speak Spanish at home (100% very well).
0.3% of residents speak other Indo-European language at home (100% very well).
Foreign born population: 132 (2.9%) (0.0% of them are naturalized citizens)
:
2.9%
Whole state:
10.7%
107%Haiti
11%American
5%Jamaican
4%Scotch-Irish
2%English
1%Italian
1%German
Year of entry for the foreign-born population
1612010 or later
02000 to 2009
01990 to 1999
0Before 1990
Private high school in in this zip code not listed on the city page:
LIBERTY CHRISTIAN (Students: 16, Location: 10063 OLD POST RD, Grades: UG-9)
Facilities with environmental interests located in this zip code:
ELCO EASTERN INC (16544 HWY 341 SOUTH in HORTENSE, GA)
AIR SYNTHETIC MINOR (AIRS/AFS) Business SIC classification: CRUSHED AND BROKEN GRANITE
Housing units lacking complete plumbing facilities: 7.7% Housing units lacking complete kitchen facilities: 6.5%
93.0%Electricity
5.5%Wood
1.0%Utility gas
0.6%Bottled, tank, or LP gas
Population in 1990: 968. Population change in the 1990s: +2,920 (+301.7%).
Place of birth for U.S.-born residents:
This state: 2,767
Northeast: 265
Midwest: 259
South: 716
West: 408
70% of the 31543 zip code residents lived in the same house 5 years ago. Out of people who lived in different houses, 29% lived in this county. Out of people who lived in different counties, 50% lived in Georgia.
100% of the 31543 zip code residents lived in the same house 1 year ago. Out of people who lived in different houses, 500% moved from different county within same state.
Private vs. public school enrollment:
Students in private schools in grades 1 to 8 (elementary and middle school): 45
Here:
8.4%
Georgia:
12.1%
Students in private schools in grades 9 to 12 (high school):
Here:
0.0%
Georgia:
10.8%
Students in private undergraduate colleges: 68
Here:
63.6%
Georgia:
17.1%
Occupation by median earnings in the past 12 months ($)
79,696Transportation occupations
70,479Management occupations
60,451Office and administrative support occupations
36,246Construction and extraction occupations
22,401Education, training, and library occupations
21,342Food preparation and serving related occupations
Top industries in this zip code by the number of employees in 2005:
Accommodation and Food Services: Limited-Service Restaurants (20-49 employees: 1 establishment)
Construction: Highway, Street, and Bridge Construction (10-19: 1)
Construction: Electrical Contractors (5-9: 1)
Construction: Tile and Terrazzo Contractors (5-9: 1)
Fatal accident statistics in 2014:
Fatal accident count: 3
Vehicles involved in fatal accidents: 5
Fatal accidents caused by drunken drivers: 1
Fatalities: 3
Persons involved in fatal accidents: 10
Pedestrians involved in fatal accidents: 0
Fatal accident statistics in 2013:
Fatal accident count: 1
Vehicles involved in fatal accidents: 1
Fatal accidents caused by drunken drivers: 0
Fatalities: 1
Persons involved in fatal accidents: 1
Pedestrians involved in fatal accidents: 1
2004 - 2018 National Fire Incident Reporting System (NFIRS) incidents
According to the data from the years 2004 - 2018 the average number of fires per year is 25. The highest number of fires - 65 took place in 2007, and the least - 2 in 2014. The data has a declining trend.
When looking into fire subcategories, the most reports belonged to: Outside Fires (58.6%), and Structure Fires (30.8%).
Fire incident types reported to NFIRS in Zip Code 31543

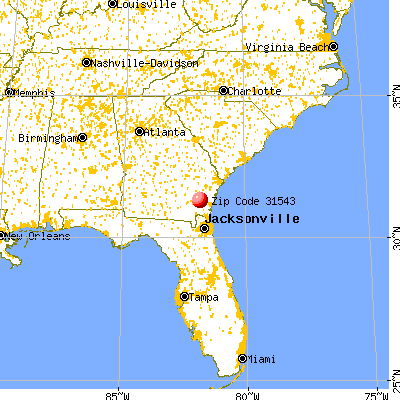


 Nearest zip codes: 31566, 31546, 31553, 31523, 31560, 31557.


 (Students: 16, Location: 10063 OLD POST RD, Grades: UG-9)


 According to the data from the years 2004 - 2018 the average number of fires per year is 25. The highest number of fires - 65 took place in 2007, and the least - 2 in 2014. The data has a declining trend.
 When looking into fire subcategories, the most reports belonged to: Outside Fires (58.6%), and Structure Fires (30.8%).