Estimated zip code population in 2022: 3,056 Zip code population in 2010: 2,848 Zip code population in 2000: 2,781
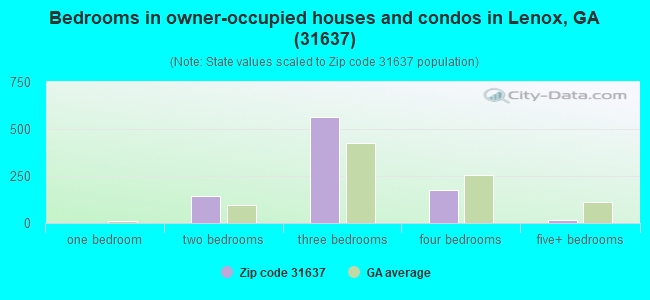
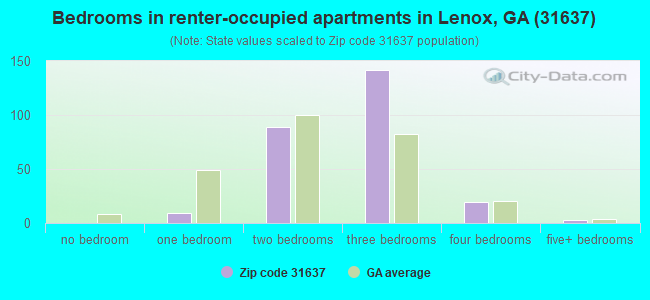
Houses and condos: 1,365 Renter-occupied apartments: 261
% of renters here:
22%
State:
34%
March 2022 cost of living index in zip code 31637: 79.0 (low, U.S. average is 100)
Land area: 78.6 sq. mi. Water area: 1.8 sq. mi.
Population density: 39 people per square mile
(very low).
OSM Map
General Map
Google Map
MSN Map
OSM Map
General Map
Google Map
MSN Map
OSM Map
General Map
Google Map
MSN Map
OSM Map
General Map
Google Map
MSN Map
Please wait while loading the map...
Real estate property taxes paid for housing units in 2022:
This zip code:
0.7% ($765)
Georgia:
0.7% ($2,160)
Median real estate property taxes paid for housing units with mortgages in 2022: $1,087 (0.7%) Median real estate property taxes paid for housing units with no mortgage in 2022: $717 (0.7%)
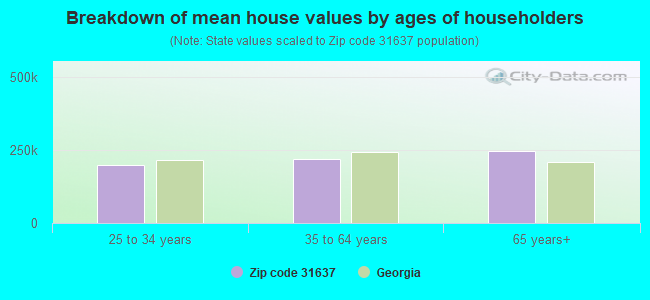
Estimated median house/condo value in 2022: $112,598
31637:
$112,598
Georgia:
$297,400
According to our research of Georgia and other state lists, there were 9 registered sex offenders living in 31637 zip code as of June 10, 2024. The ratio of all residents to sex offenders in zip code 31637 is 358 to 1. The ratio of registered sex offenders to all residents in this zip code is near the state average.
Median resident age:
This zip code:
35.8 years
Georgia median age:
37.6 years
Average household size:
This zip code:
2.6 people
Georgia:
2.6 people
Averages for the 2020 tax year for zip code 31637, filed in 2021:
Average Adjusted Gross Income (AGI) in 2020: $47,512 (Individual Income Tax Returns)
Here:
$47,512
State:
$70,847
Salary/wage: $41,932 (reported on 82.3% of returns)
Here:
$41,932
State:
$59,126
(% of AGI for various income ranges: 1303.8% for AGIs below $25k, 3503.6% for AGIs $25k-50k, 7033.3% for AGIs $50k-75k, 10858.0% for AGIs $75k-100k, 18576.7% for AGIs $100k-200k)
Taxable interest for individuals: $1,204 (reported on 20.4% of returns)
This zip code:
$1,204
Georgia:
$2,011
(% of AGI for various income ranges: 5.9% for AGIs below $25k, 21.1% for AGIs $25k-50k, 12.5% for AGIs $50k-75k, 76.0% for AGIs $75k-100k, 243.3% for AGIs $100k-200k)
Ordinary dividends: $1,390 (reported on 8.8% of returns)
Here:
$1,390
State:
$8,996
(% of AGI for various income ranges: 16.9% for AGIs below $25k, 43.3% for AGIs $50k-75k, 55.0% for AGIs $100k-200k)
Net capital gain/loss in AGI: +$9,308 (reported on 10.6% of returns)
Here:
+$9,308
State:
+$28,402
(% of AGI for various income ranges: 16.4% for AGIs $25k-50k, 340.8% for AGIs $50k-75k, 1105.0% for AGIs $100k-200k)
Profit/loss from business: +$5,523 (reported on 19.5% of returns)
Here:
+$5,523
State:
+$6,707
(% of AGI for various income ranges: 170.6% for AGIs below $25k, 157.5% for AGIs $25k-50k, 73.3% for AGIs $50k-75k, 280.0% for AGIs $75k-100k)
Taxable individual retirement arrangement distribution: $12,800 (reported on 4.4% of returns)
31637:
$12,800
Georgia:
$20,525
(% of AGI for various income ranges: 102.2% for AGIs below $25k, 626.0% for AGIs $75k-100k)
Total itemized deductions: $28,500 (reported on 6.2% of returns)
Here:
$28,500
State:
$34,001
(% of AGI for various income ranges: 160.0% for AGIs below $25k, 671.7% for AGIs $50k-75k, 1128.3% for AGIs $100k-200k)
Charity contributions: $9,443 (reported on 6.2% of returns)
Here:
$9,443
State:
$14,164
(% of AGI for various income ranges: 99.3% for AGIs $25k-50k, 766.0% for AGIs $75k-100k)
Taxes paid: $5,400 (reported on 6.2% of returns)
31637:
$5,400
State:
$7,540
(% of AGI for various income ranges: 17.5% for AGIs below $25k, 127.5% for AGIs $50k-75k, 281.7% for AGIs $100k-200k)
Earned income credit: $2,506 (reported on 29.2% of returns)
Here:
$2,506
State:
$2,530
(% of AGI for various income ranges: 171.6% for AGIs below $25k, 99.3% for AGIs $25k-50k)
Percentage of individuals using paid preparers for their 2020 taxes: 95.6%
Here:
96%
State:
93%
(% for various income ranges: 95.3% for AGIs below $25k, 97.0% for AGIs $25k-50k, 94.1% for AGIs $50k-75k, 88.9% for AGIs $75k-100k, 100.0% for AGIs $100k-200k)
Averages for the 2012 tax year for zip code 31637, filed in 2013:
Average Adjusted Gross Income (AGI) in 2012: $36,425 (Individual Income Tax Returns)
Here:
$36,425
State:
$56,131
Salary/wage: $31,130 (reported on 86.2% of returns)
Here:
$31,130
State:
$47,942
(% of AGI for various income ranges: 80.1% for AGIs below $25k, 81.5% for AGIs $25k-50k, 82.7% for AGIs $50k-75k, 72.3% for AGIs $75k-100k, 52.2% for AGIs $100k-200k)
Taxable interest for individuals: $704 (reported on 21.1% of returns)
This zip code:
$704
Georgia:
$1,706
(% of AGI for various income ranges: 0.6% for AGIs below $25k, 0.5% for AGIs $25k-50k, 0.3% for AGIs $50k-75k, 0.3% for AGIs $75k-100k, 0.3% for AGIs $100k-200k)
Ordinary dividends: $883 (reported on 5.5% of returns)
Here:
$883
State:
$7,265
Net capital gain/loss in AGI: +$1,712 (reported on 7.3% of returns)
Here:
+$1,712
State:
+$16,323
Profit/loss from business: +$5,829 (reported on 15.6% of returns)
Here:
+$5,829
State:
+$7,583
(% of AGI for various income ranges: 7.1% for AGIs below $25k, 0.8% for AGIs $25k-50k, 9.8% for AGIs $75k-100k)
Taxable individual retirement arrangement distribution: $10,917 (reported on 5.5% of returns)
31637:
$10,917
Georgia:
$17,199
Total itemized deductions: $16,780 (24% of AGI, reported on 22.9% of returns)
Here:
$16,780
State:
$23,886
Here:
23.8% of AGI
State:
21.5% of AGI
(% of AGI for various income ranges: 4.9% for AGIs below $25k, 9.9% for AGIs $25k-50k, 13.0% for AGIs $50k-75k, 10.7% for AGIs $75k-100k, 13.1% for AGIs $100k-200k)
Charity contributions: $3,845 (reported on 18.3% of returns)
Here:
$3,845
State:
$5,507
(% of AGI for various income ranges: 1.9% for AGIs $25k-50k, 2.7% for AGIs $50k-75k, 1.9% for AGIs $75k-100k, 2.7% for AGIs $100k-200k)
Taxes paid: $4,458 (reported on 22.0% of returns)
31637:
$4,458
State:
$7,838
(% of AGI for various income ranges: 0.4% for AGIs below $25k, 1.8% for AGIs $25k-50k, 2.9% for AGIs $50k-75k, 3.5% for AGIs $75k-100k, 4.8% for AGIs $100k-200k)
Earned income credit: $2,476 (reported on 31.2% of returns)
Here:
$2,476
State:
$2,589
(% of AGI for various income ranges: 9.9% for AGIs below $25k, 1.5% for AGIs $25k-50k)
Percentage of individuals using paid preparers for their 2012 taxes: 66.1%
Here:
66%
State:
55%
(% for various income ranges: 64.2% for AGIs below $25k, 66.7% for AGIs $25k-50k, 66.7% for AGIs $50k-75k, 80.0% for AGIs $75k-100k, 66.7% for AGIs $100k-200k)
Averages for the 2004 tax year for zip code 31637, filed in 2005:
Average Adjusted Gross Income (AGI) in 2004: $28,804 (Individual Income Tax Returns)
Here:
$28,804
State:
$47,553
Salary/wage: $27,653 (reported on 86.7% of returns)
Here:
$27,653
State:
$42,178
(% of AGI for various income ranges: 222.3% for AGIs below $10k, 81.3% for AGIs $10k-25k, 88.6% for AGIs $25k-50k, 84.9% for AGIs $50k-75k, 81.3% for AGIs $75k-100k, 52.0% for AGIs over 100k)
Taxable interest for individuals: $1,035 (reported on 27.5% of returns)
This zip code:
$1,035
Georgia:
$1,772
(% of AGI for various income ranges: 11.3% for AGIs below $10k, 1.3% for AGIs $10k-25k, 0.9% for AGIs $25k-50k, 0.3% for AGIs $50k-75k, 0.6% for AGIs $75k-100k, 0.9% for AGIs over 100k)
Taxable dividends: $561 (reported on 9.4% of returns)
Here:
$561
State:
$4,283
(% of AGI for various income ranges: 0.6% for AGIs below $10k, 0.3% for AGIs $10k-25k, 0.2% for AGIs $25k-50k, 0.0% for AGIs $50k-75k, 0.2% for AGIs $75k-100k, 0.1% for AGIs over 100k)
Net capital gain/loss: +$5,797 (reported on 10.4% of returns)
Here:
+$5,797
State:
+$16,461
(% of AGI for various income ranges: 1.8% for AGIs below $10k, 0.7% for AGIs $10k-25k, 0.6% for AGIs $25k-50k, 2.6% for AGIs $50k-75k, 5.2% for AGIs $75k-100k, 4.1% for AGIs over 100k)
Profit/loss from business: +$4,621 (reported on 14.1% of returns)
Here:
+$4,621
State:
+$8,201
(% of AGI for various income ranges: 18.3% for AGIs below $10k, 5.2% for AGIs $10k-25k, 2.1% for AGIs $25k-50k, 1.1% for AGIs $50k-75k)
IRA payment deduction: $2,455 (reported on 1.0% of returns)
31637:
$2,455
Georgia:
$2,969
Total itemized deductions: $16,000 (26% of AGI, reported on 18.1% of returns)
Here:
$16,000
State:
$19,944
Here:
25.7% of AGI
State:
22.6% of AGI
(% of AGI for various income ranges: 3.8% for AGIs $10k-25k, 8.9% for AGIs $25k-50k, 12.4% for AGIs $50k-75k, 13.3% for AGIs $75k-100k, 18.0% for AGIs over 100k)
Charity contributions deductions: $4,091 (6% of AGI, reported on 15.4% of returns)
Here:
$4,091
State:
$4,354
Here:
6.2% of AGI
State:
4.7% of AGI
(% of AGI for various income ranges: 0.5% for AGIs $10k-25k, 1.8% for AGIs $25k-50k, 2.5% for AGIs $50k-75k, 3.3% for AGIs $75k-100k, 4.8% for AGIs over 100k)
Total tax: $3,288 (reported on 65.3% of returns)
31637:
$3,288
State:
$8,223
(% of AGI for various income ranges: 7.2% for AGIs below $10k, 3.4% for AGIs $10k-25k, 6.2% for AGIs $25k-50k, 8.0% for AGIs $50k-75k, 10.0% for AGIs $75k-100k, 14.6% for AGIs over 100k)
Earned income credit: $1,877 (reported on 30.0% of returns)
Here:
$1,877
State:
$1,986
Percentage of individuals using paid preparers for their 2004 taxes: 70.1%
Here:
70%
State:
62%
(% for various income ranges: 62.5% for AGIs below $10k, 71.8% for AGIs $10k-25k, 73.8% for AGIs $25k-50k, 70.9% for AGIs $50k-75k, 75.5% for AGIs $75k-100k, 65.2% for AGIs over 100k)
Household received Food Stamps/SNAP in the past 12 months: 190 Household did not receive Food Stamps/SNAP in the past 12 months: 981
Women who had a birth in the past 12 months: 48 (39 now married, 8 unmarried) Women who did not have a birth in the past 12 months: 653 (381 now married, 271 unmarried)
Housing units in zip code 31637 with a mortgage: 199 Houses without a mortgage: 4
Median monthly owner costs for units with a mortgage: $1,155 Median monthly owner costs for units without a mortgage: $412
Residents with income below the poverty level in 2022:
This zip code:
15.1%
Whole state:
12.7%
Residents with income below 50% of the poverty level in 2022:
This zip code:
5.8%
Whole state:
6.3%
Median number of rooms in houses and condos:
Here:
6.3
State:
6.8
Median number of rooms in apartments:
Here:
5.5
State:
4.6
Notable locations in this zip code not listed on our city pages
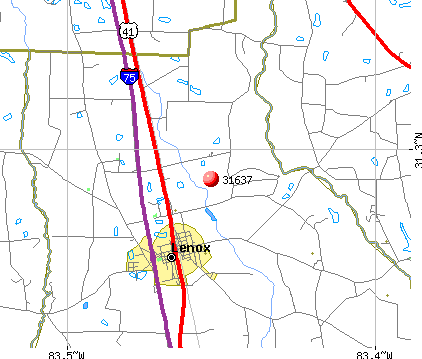
Notable locations in zip code 31637: Lenox Volunteer Fire Department (A), West Berrien Volunteer Fire Department (B). Display/hide their locations on the map
Churches in zip code 31637 include: West Central Avenue Church of God (A), Lakeview Church (B), New Hope Church (C), New River Church (D), Parkers Chapel (E), Pine Grove Church (F), Temple Church (G), Bethlehem Primitive Baptist Church (H). Display/hide their locations on the map
In group quarters: 45 (-1 institutionalized population)
Size of family households: 337 2-persons, 204 3-persons, 117 4-persons, 141 5-persons, 5 6-persons, 3 7-or-more-persons
Size of nonfamily households: 294 1-person, 35 2-persons, 30 3-persons
426 married couples with children.
140 single-parent households (8 men, 132 women).
97.0% of residents of 31637 zip code speak English at home.
2.7% of residents speak Spanish at home (59% very well, 41% not at all).
0.3% of residents speak other Indo-European language at home (25% very well, 75% well).
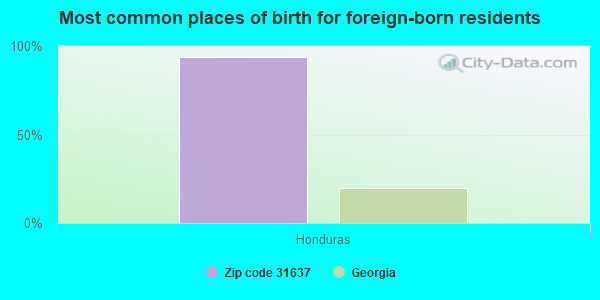
Foreign born population: 31 (1.0%) (0.0% of them are naturalized citizens)
:
1.0%
Whole state:
10.7%
94%Honduras
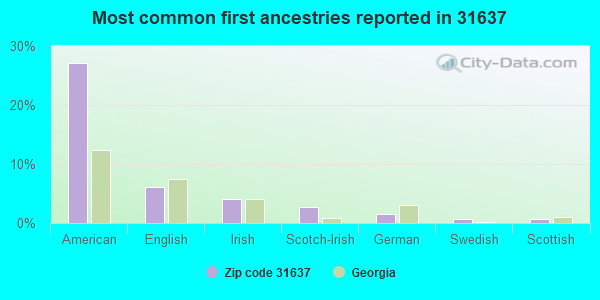
27%American
6%English
4%Irish
3%Scotch-Irish
1%German
1%Swedish
1%Scottish
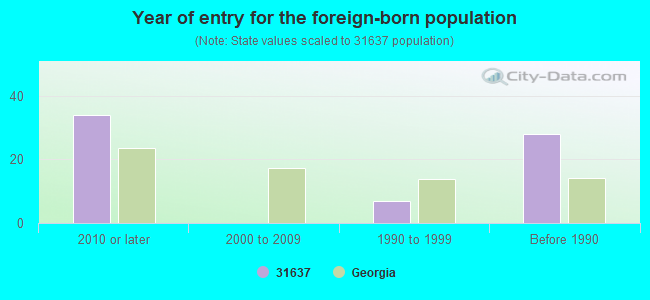
Year of entry for the foreign-born population
342010 or later
02000 to 2009
71990 to 1999
28Before 1990
Facilities with environmental interests located in this zip code:
AGRICO CHEMICAL CO AGRICO FARM CENTER (HIGHWAY 41 SOUTH in LENOX, GA)
AMERICAN CYANAMID/SUMNER FLYING SERVICE (HWY 41 & AIRPORT RD in LENOX, GA)
(Resource Conservation and Recovery Act (tracking hazardous waste)) Business NAICS classification: SOIL PREPARATION, PLANTING, AND CULTIVATING.
LENOX (WPCP) (OLE UNION RD., P.O. BOX 560 in LENOX, GA)
National Pollutant Discharge Elimination System NON-MAJOR (Tracking pollutant discharge elimination systems) - permit Business SIC classification: SEWERAGE SYSTEMS Alternative names: LENOX POND
LENOX AG SERVICE INC (KINARD BRIDGE ROAD in LENOX, GA)
AIR MINOR (AIRS/AFS) Business SIC classification: FARM-PRODUCT RAW MATERIALS
Housing units lacking complete plumbing facilities: 3.8% Housing units lacking complete kitchen facilities: 2.9%
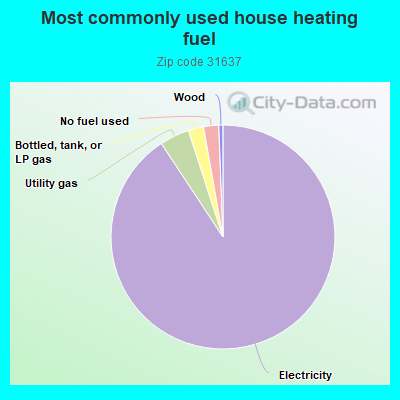
91.0%Electricity
4.3%Utility gas
2.2%Bottled, tank, or LP gas
2.2%No fuel used
0.6%Wood
Population in 1990: 1,993. Population change in the 1990s: +788 (+39.5%).
Place of birth for U.S.-born residents:
This state: 2,473
Northeast: 76
Midwest: 78
South: 306
West: 21
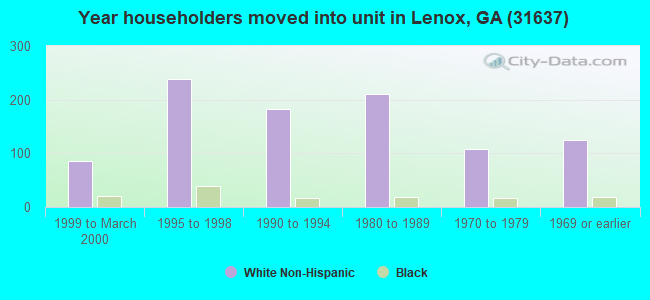
70% of the 31637 zip code residents lived in the same house 5 years ago. Out of people who lived in different houses, 45% lived in this county. Out of people who lived in different counties, 50% lived in Georgia.
93% of the 31637 zip code residents lived in the same house 1 year ago. Out of people who lived in different houses, 32% moved from this county. Out of people who lived in different houses, 57% moved from different county within same state. Out of people who lived in different houses, 10% moved from different state.
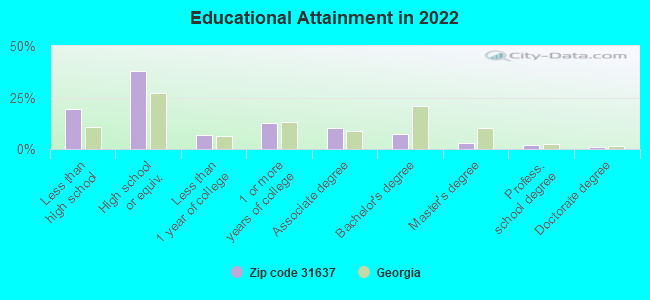
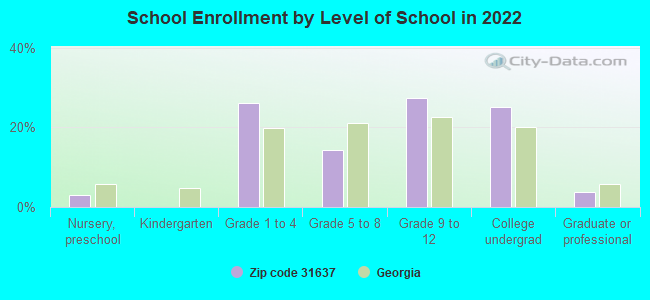
Private vs. public school enrollment:
Students in private schools in grades 1 to 8 (elementary and middle school): 134
Here:
43.6%
Georgia:
12.1%
Students in private schools in grades 9 to 12 (high school): 52
Here:
26.5%
Georgia:
10.8%
Students in private undergraduate colleges:
Here:
0.0%
Georgia:
17.1%
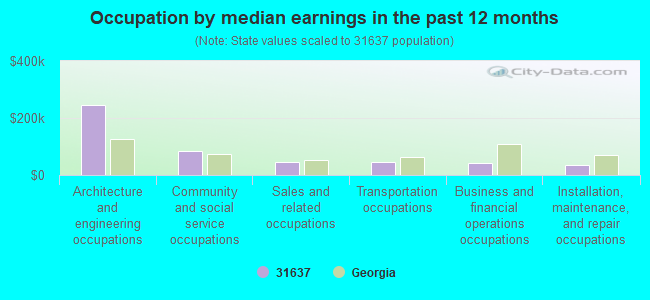
Occupation by median earnings in the past 12 months ($)
244,998Architecture and engineering occupations
84,642Community and social service occupations
46,145Sales and related occupations
45,211Transportation occupations
41,723Business and financial operations occupations
33,432Installation, maintenance, and repair occupations
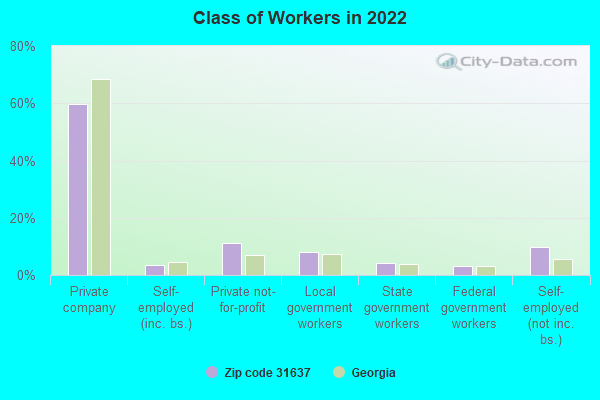
Top industries in this zip code by the number of employees in 2005:
Finance and Insurance: Commercial Banking (10-19 employees: 1 establishment)
Health Care and Social Assistance: Offices of Dentists (5-9: 1)
Other Services (except Public Administration): Communication Equipment Repair and Maintenance (5-9: 1)
Other Services (except Public Administration): Religious Organizations (1-4: 3)
Accommodation and Food Services: Snack and Nonalcoholic Beverage Bars (1-4: 2)
Wholesale Trade: Recyclable Material Merchant Wholesalers (1-4: 2)
Fatal accident statistics in 2014:
Fatal accident count: 1
Vehicles involved in fatal accidents: 2
Fatal accidents caused by drunken drivers: 0
Fatalities: 1
Persons involved in fatal accidents: 3
Pedestrians involved in fatal accidents: 0
Fatal accident statistics in 2013:
Fatal accident count: 1
Vehicles involved in fatal accidents: 1
Fatal accidents caused by drunken drivers: 1
Fatalities: 1
Persons involved in fatal accidents: 2
Pedestrians involved in fatal accidents: 0
2005 - 2018 National Fire Incident Reporting System (NFIRS) incidents
Based on the data from the years 2005 - 2018 the average number of fire incidents per year is 19. The highest number of fire incidents - 54 took place in 2011, and the least - 0 in 2008. The data has an increasing trend.
When looking into fire subcategories, the most reports belonged to: Outside Fires (53.4%), and Mobile Property/Vehicle Fires (23.3%).
Fire incident types reported to NFIRS in Zip Code 31637

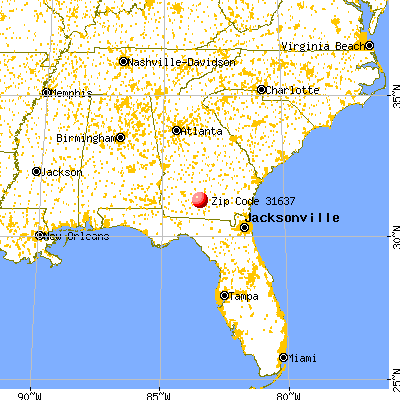


 Nearest zip codes: 31647, 31794, 31775, 31749, 31620, 31747.


 Based on the data from the years 2005 - 2018 the average number of fire incidents per year is 19. The highest number of fire incidents - 54 took place in 2011, and the least - 0 in 2008. The data has an increasing trend.
 When looking into fire subcategories, the most reports belonged to: Outside Fires (53.4%), and Mobile Property/Vehicle Fires (23.3%).