Estimated zip code population in 2022: 3,616 Zip code population in 2010: 3,044 Zip code population in 2000: 1,324
Houses and condos: 1,217 Renter-occupied apartments: 130
% of renters here:
11%
State:
33%
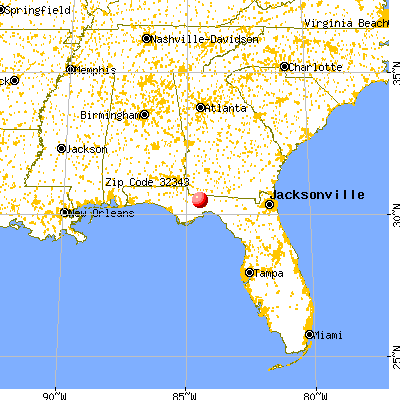
March 2022 cost of living index in zip code 32343: 82.7 (low, U.S. average is 100)
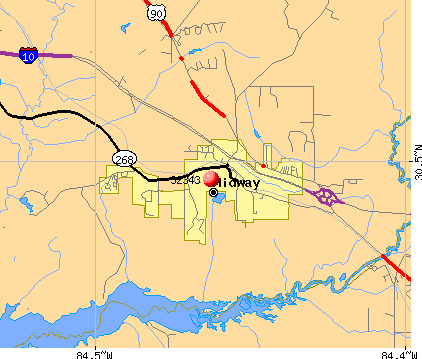
Land area: 26.5 sq. mi. Water area: 2.3 sq. mi.
Population density: 136 people per square mile
(very low).
OSM Map
General Map
Google Map
MSN Map
OSM Map
General Map
Google Map
MSN Map
OSM Map
General Map
Google Map
MSN Map
OSM Map
General Map
Google Map
MSN Map
Please wait while loading the map...
Real estate property taxes paid for housing units in 2022:
This zip code:
0.8% ($1,696)
Florida:
0.7% ($2,529)
Median real estate property taxes paid for housing units with mortgages in 2022: $1,821 (0.8%) Median real estate property taxes paid for housing units with no mortgage in 2022: $798 (0.9%)
Business Search- 14 Million verified businesses
Males: 1,510
(41.8%)
Females: 2,105
(58.2%)
For population 25 years and over in 32343:
High school or higher: 87.4%
Bachelor's degree or higher: 22.8%
Graduate or professional degree: 9.9%
Unemployed: 3.5%
Mean travel time to work (commute): 33.0 minutes
For population 15 years and over in 32343:
Never married: 37.7%
Now married: 49.0%
Separated: 2.7%
Widowed: 1.9%
Divorced: 8.7%
Zip code 32343 compared to state average:
Median house value below state average.
Black race population percentage significantly above state average.
Hispanic race population percentage significantly below state average.
Median age significantly below state average.
Foreign-born population percentage significantly below state average.
Renting percentage significantly below state average.
Length of stay since moving in significantly above state average.
House age significantly below state average.
Number of college students below state average.
Percentage of population with a bachelor's degree or higher below state average.
Averages for the 2020 tax year for zip code 32343, filed in 2021:
Average Adjusted Gross Income (AGI) in 2020: $40,274 (Individual Income Tax Returns)
Here:
$40,274
State:
$82,200
Salary/wage: $38,440 (reported on 88.6% of returns)
Here:
$38,440
State:
$58,347
(% of AGI for various income ranges: 1532.1% for AGIs below $25k, 4306.6% for AGIs $25k-50k, 6709.5% for AGIs $50k-75k, 11283.3% for AGIs $75k-100k, 19698.0% for AGIs $100k-200k)
Taxable interest for individuals: $338 (reported on 8.6% of returns)
This zip code:
$338
Florida:
$4,272
(% of AGI for various income ranges: 0.7% for AGIs below $25k, 2.7% for AGIs $25k-50k, 1.5% for AGIs $50k-75k, 5.0% for AGIs $75k-100k, 58.0% for AGIs $100k-200k)
Ordinary dividends: $1,300 (reported on 2.2% of returns)
Here:
$1,300
State:
$15,863
(% of AGI for various income ranges: 1.2% for AGIs below $25k, 75.0% for AGIs $75k-100k)
Net capital gain/loss in AGI: +$1,750 (reported on 2.2% of returns)
Here:
+$1,750
State:
+$62,983
(% of AGI for various income ranges: 35.0% for AGIs $50k-75k)
Taxable individual retirement arrangement distribution: $8,720 (reported on 2.7% of returns)
32343:
$8,720
Florida:
$24,823
(% of AGI for various income ranges: 27.1% for AGIs below $25k, 139.5% for AGIs $50k-75k)
Total itemized deductions: $26,012 (reported on 9.2% of returns)
Here:
$26,012
State:
$45,393
(% of AGI for various income ranges: 276.6% for AGIs $25k-50k, 757.5% for AGIs $50k-75k, 2263.3% for AGIs $75k-100k)
Charity contributions: $13,024 (reported on 9.2% of returns)
Here:
$13,024
State:
$20,178
(% of AGI for various income ranges: 116.8% for AGIs $25k-50k, 391.0% for AGIs $50k-75k, 1296.7% for AGIs $75k-100k)
Taxes paid: $3,640 (reported on 8.1% of returns)
32343:
$3,640
State:
$6,967
(% of AGI for various income ranges: 28.7% for AGIs $25k-50k, 109.0% for AGIs $50k-75k, 278.3% for AGIs $75k-100k)
Earned income credit: $2,600 (reported on 34.1% of returns)
Here:
$2,600
State:
$2,306
(% of AGI for various income ranges: 181.9% for AGIs below $25k, 104.1% for AGIs $25k-50k)
Percentage of individuals using paid preparers for their 2020 taxes: 91.9%
Here:
92%
State:
92%
(% for various income ranges: 92.9% for AGIs below $25k, 91.4% for AGIs $25k-50k, 92.6% for AGIs $50k-75k, 88.9% for AGIs $75k-100k, 88.9% for AGIs $100k-200k)
Averages for the 2012 tax year for zip code 32343, filed in 2013:
Average Adjusted Gross Income (AGI) in 2012: $33,481 (Individual Income Tax Returns)
Here:
$33,481
State:
$60,316
Salary/wage: $31,942 (reported on 91.9% of returns)
Here:
$31,942
State:
$45,277
(% of AGI for various income ranges: 87.9% for AGIs below $25k, 92.6% for AGIs $25k-50k, 88.2% for AGIs $50k-75k, 90.0% for AGIs $75k-100k, 61.4% for AGIs $100k-200k)
Taxable interest for individuals: $154 (reported on 8.7% of returns)
This zip code:
$154
Florida:
$3,587
(% of AGI for various income ranges: 0.1% for AGIs $75k-100k)
Ordinary dividends: $1,025 (reported on 2.7% of returns)
Here:
$1,025
State:
$12,831
Profit/loss from business: +$558 (reported on 16.1% of returns)
Here:
+$558
State:
+$10,012
(% of AGI for various income ranges: 2.3% for AGIs below $25k)
Taxable individual retirement arrangement distribution: $14,000 (reported on 2.0% of returns)
32343:
$14,000
Florida:
$21,544
Total itemized deductions: $16,651 (32% of AGI, reported on 30.2% of returns)
Here:
$16,651
State:
$25,533
Here:
32.5% of AGI
State:
18.0% of AGI
(% of AGI for various income ranges: 6.1% for AGIs below $25k, 17.5% for AGIs $25k-50k, 17.3% for AGIs $50k-75k, 19.3% for AGIs $75k-100k, 12.0% for AGIs $100k-200k)
Charity contributions: $4,551 (reported on 23.5% of returns)
Here:
$4,551
State:
$5,698
(% of AGI for various income ranges: 0.9% for AGIs below $25k, 3.5% for AGIs $25k-50k, 3.6% for AGIs $50k-75k, 4.3% for AGIs $75k-100k, 4.4% for AGIs $100k-200k)
Taxes paid: $2,633 (reported on 28.9% of returns)
32343:
$2,633
State:
$6,203
(% of AGI for various income ranges: 0.7% for AGIs below $25k, 2.7% for AGIs $25k-50k, 2.4% for AGIs $50k-75k, 3.3% for AGIs $75k-100k, 2.1% for AGIs $100k-200k)
Earned income credit: $2,561 (reported on 39.6% of returns)
Here:
$2,561
State:
$2,372
(% of AGI for various income ranges: 12.3% for AGIs below $25k, 1.8% for AGIs $25k-50k)
Percentage of individuals using paid preparers for their 2012 taxes: 47.7%
Here:
48%
State:
54%
(% for various income ranges: 47.0% for AGIs below $25k, 46.4% for AGIs $25k-50k, 44.4% for AGIs $50k-75k, 100.0% for AGIs $75k-100k)
Averages for the 2004 tax year for zip code 32343, filed in 2005:
Average Adjusted Gross Income (AGI) in 2004: $30,272 (Individual Income Tax Returns)
Here:
$30,272
State:
$50,523
Salary/wage: $25,173 (reported on 94.8% of returns)
Here:
$25,173
State:
$39,563
(% of AGI for various income ranges: 92.2% for AGIs below $10k, 91.9% for AGIs $10k-25k, 95.6% for AGIs $25k-50k, 89.4% for AGIs $50k-75k, 204.6% for AGIs $75k-100k)
Taxable interest for individuals: $510 (reported on 13.1% of returns)
This zip code:
$510
Florida:
$3,211
(% of AGI for various income ranges: 0.4% for AGIs below $10k, 0.2% for AGIs $10k-25k, 0.1% for AGIs $25k-50k, 0.2% for AGIs $50k-75k, 2.4% for AGIs $75k-100k)
Taxable dividends: $308 (reported on 3.6% of returns)
Here:
$308
State:
$6,129
Net capital gain/loss: +$13,000 (reported on 1.5% of returns)
Here:
+$13,000
State:
+$27,205
Profit/loss from business: +$3,900 (reported on 5.5% of returns)
Here:
+$3,900
State:
+$10,634
Total itemized deductions: $18,491 (24% of AGI, reported on 15.6% of returns)
Here:
$18,491
State:
$20,370
Here:
24.2% of AGI
State:
20.7% of AGI
(% of AGI for various income ranges: 3.0% for AGIs $10k-25k, 11.4% for AGIs $25k-50k, 14.3% for AGIs $50k-75k, 13.6% for AGIs over 100k)
Charity contributions deductions: $5,990 (9% of AGI, reported on 13.4% of returns)
Here:
$5,990
State:
$4,064
Here:
8.7% of AGI
State:
3.8% of AGI
Total tax: $4,501 (reported on 53.1% of returns)
32343:
$4,501
State:
$9,431
(% of AGI for various income ranges: 1.0% for AGIs below $10k, 2.0% for AGIs $10k-25k, 6.0% for AGIs $25k-50k, 10.0% for AGIs $50k-75k, 13.2% for AGIs $75k-100k, 16.1% for AGIs over 100k)
Earned income credit: $2,111 (reported on 45.4% of returns)
Here:
$2,111
State:
$1,808
Percentage of individuals using paid preparers for their 2004 taxes: 66.0%
Here:
66%
State:
60%
(% for various income ranges: 59.9% for AGIs below $10k, 76.1% for AGIs $10k-25k, 59.3% for AGIs $25k-50k, 62.1% for AGIs $50k-75k, 100.0% for AGIs over 100k)
Household received Food Stamps/SNAP in the past 12 months: 187 Household did not receive Food Stamps/SNAP in the past 12 months: 974
Women who had a birth in the past 12 months: 96 (64 now married, 31 unmarried) Women who did not have a birth in the past 12 months: 974 (386 now married, 588 unmarried)
Housing units in zip code 32343 with a mortgage: 901 (86 second mortgage, 4 home equity loan) Median monthly owner costs for units with a mortgage: $1,374 Median monthly owner costs for units without a mortgage: $430
Residents with income below the poverty level in 2022:
This zip code:
17.5%
Whole state:
12.7%
Residents with income below 50% of the poverty level in 2022:
This zip code:
5.1%
Whole state:
6.6%
Median number of rooms in houses and condos:
Here:
5.4
State:
5.9
Median number of rooms in apartments:
Here:
3.8
State:
4.2
Notable locations in this zip code not listed on our city pages
Churches in zip code 32343 include: Saint Peters Church (A), Saint Lukes Church (B), Saint Luke Primitive Baptist Church (C), Mount Moriah Church (D), Galilee Church (E), Saint Francis of Assisi Episcopal Church (F). Display/hide their locations on the map
Streams, rivers, and creeks: Richlander Creek (A), Pole Branch (B), Mule Creek (C), Little River (D), Hunter Creek (E), Double Branch (F), Monroe Creek (G), G Creek (H). Display/hide their locations on the map
Size of family households: 312 2-persons, 160 3-persons, 341 4-persons, 43 5-persons, 43 6-persons
Size of nonfamily households: 218 1-person, 39 2-persons
755 married couples with children.
549 single-parent households (10 men, 539 women).
90.3% of residents of 32343 zip code speak English at home.
7.7% of residents speak Spanish at home (87% very well, 13% not well).
0.6% of residents speak other Indo-European language at home (100% very well).
Foreign born population: 24 (0.7%) (51.5% of them are naturalized citizens)
This zip code:
0.7%
Whole state:
21.7%
46%Haiti
7%African
1%West Indian
0%American
0%Jamaican
0%Bahamian
0%Cape Verdean
Year of entry for the foreign-born population
1912010 or later
02000 to 2009
401990 to 1999
40Before 1990
Major facilities with environmental interests located in this zip code:
MIDWAY MAGNET CENTER (50 MINE ROAD in MIDWAY, FL)
(National Center for Education Statistics) - STATE ID-0031 Organizations: GADSDEN COUNTY SCHOOL DISTRICT (SCHOOL DISTRICT)
HILLTOP SUBDIVISION (CR 268 ACROSS FR HILLTOP DR in MIDWAY, FL)
National Pollutant Discharge Elimination System NON-MAJOR (Tracking pollutant discharge elimination systems) - permit Organizations: LEX THOMPSON (CONTACT/OWNER)
MIDWAY COMMERCIAL PARK (US HIGHWAY 90, .7 MILES S OF I in MIDWAY, FL)
National Pollutant Discharge Elimination System NON-MAJOR (Tracking pollutant discharge elimination systems) - permit Organizations: LEX THOMPSON (CONTACT/OWNER)
PHEASANT POINT SUBDIVISION (PALMER RD in MIDWAY, FL)
National Pollutant Discharge Elimination System NON-MAJOR (Tracking pollutant discharge elimination systems) - permit Organizations: LEX THOMPSON (CONTACT/OWNER)
ACE SALVAGE INCORPORATED (HIGHWAY 90 1 MILE WEST OF I-10 in MIDWAY, FL)
(Resource Conservation and Recovery Act (tracking hazardous waste)) Organizations: JOHN PASSETT, MANAGER (CONTACT/OWNER)
ACE SALVAGE INCORPORATED (DELETE) (31556 MEMORIAL BLUE STAR HIGHWAY in MIDWAY, FL)
National Pollutant Discharge Elimination System NON-MAJOR (Tracking pollutant discharge elimination systems) - permit Business SIC classification: MOTOR VEHICLE PARTS, USED Organizations: JOHN PASSETT (CONTACT/OWNER)
APACHEE ASPHALT, YARD AND OFFI (NW CORNER OF COMMERCE AND FORT in MIDWAY, FL)
National Pollutant Discharge Elimination System NON-MAJOR (Tracking pollutant discharge elimination systems) - permit Organizations: JAY MESSER (CONTACT/OWNER)
Alternative names: HERNANDO COUNTY EOC BUILDING
KAUFMAN TIRE WAREHOUSE (COMMERCE BLVD IN 10/90 DRI in MIDWAY, FL)
National Pollutant Discharge Elimination System NON-MAJOR (Tracking pollutant discharge elimination systems) - permit Organizations: JEFFREY ABRAMS (CONTACT/OWNER)
LAWSONS PAINT & BODY SHOP (US HWY 90 W in MIDWAY, FL)
(Resource Conservation and Recovery Act (tracking hazardous waste)) Business NAICS classification: AUTOMOTIVE BODY, PAINT, AND INTERIOR REPAIR AND MAINTENANCE. Organizations: CLYDE LAWSON, OWNER (CONTACT/OWNER)
MOBILE BOAT REPAIR (1425 LEWIS RD in MIDWAY, FL)
(Resource Conservation and Recovery Act (tracking hazardous waste)) Organizations: NON NOTIFIED (CONTACT/OWNER)
MONROE CREEK ( in MIDWAY, FL)
National Pollutant Discharge Elimination System NON-MAJOR (Tracking pollutant discharge elimination systems) - permit Organizations: PEPPER GHAZVINI (CONTACT/OWNER)
RAM CONSTRUCTION OFFICE - GADS (LOTS 42 & 43, BLOCK C, GADSDEN in MIDWAY, FL)
National Pollutant Discharge Elimination System NON-MAJOR (Tracking pollutant discharge elimination systems) - permit Organizations: ALLEN ROGERS (CONTACT/OWNER)
RING POWER CORPORATION--NEW BR (US HIGHWAY 90 in MIDWAY, FL)
National Pollutant Discharge Elimination System NON-MAJOR (Tracking pollutant discharge elimination systems) - permit Organizations: MATTHEW PHILLIPS (CONTACT/OWNER)
Housing units lacking complete plumbing facilities: 3.6% Housing units lacking complete kitchen facilities: 5.3%
98.0%Electricity
1.2%Utility gas
0.9%Bottled, tank, or LP gas
Place of birth for U.S.-born residents:
This state: 2,826
Northeast: 127
Midwest: 91
South: 216
West: 62
55% of the 32343 zip code residents lived in the same house 5 years ago. Out of people who lived in different houses, 67% lived in this county. Out of people who lived in different counties, 50% lived in Florida.
98% of the 32343 zip code residents lived in the same house 1 year ago. Out of people who lived in different houses, 12% moved from this county. Out of people who lived in different houses, 79% moved from different county within same state. Out of people who lived in different houses, 41% moved from different state.
Private vs. public school enrollment:
Students in private schools in grades 1 to 8 (elementary and middle school): 62
Here:
11.5%
Florida:
15.8%
Students in private schools in grades 9 to 12 (high school): 83
Here:
19.6%
Florida:
12.9%
Students in private undergraduate colleges: 18
Here:
26.6%
Florida:
23.6%
Occupation by median earnings in the past 12 months ($)
71,257Installation, maintenance, and repair occupations
49,716Law enforcement workers including supervisors
49,310Management occupations
47,518Arts, design, entertainment, sports, and media occupations
46,850Material moving occupations
46,705Business and financial operations occupations
Top industries in this zip code by the number of employees in 2005:
Construction: Commercial and Institutional Building Construction (100-249 employees: 1 establishment, 20-49 employees: 1 establishment)
Administrative and Support and Waste Management and Remediation Services: Exterminating and Pest Control Services (50-99: 1)
Accommodation and Food Services: Full-Service Restaurants (20-49: 1)
Administrative and Support and Waste Management and Remediation Services: Landscaping Services (20-49: 1)
Wholesale Trade: Other Chemical and Allied Products Merchant Wholesalers (20-49: 1)
Fatal accident statistics in 2013:
Fatal accident count: 1
Vehicles involved in fatal accidents: 2
Fatal accidents caused by drunken drivers: 0
Fatalities: 1
Persons involved in fatal accidents: 4
Pedestrians involved in fatal accidents: 0
Fatal accident statistics in 2012:
Fatal accident count: 1
Vehicles involved in fatal accidents: 1
Fatal accidents caused by drunken drivers: 0
Fatalities: 4
Persons involved in fatal accidents: 5
Pedestrians involved in fatal accidents: 0
Home Mortgage Disclosure Act Aggregated Statistics For Year 2009 (Based on 2 partial tracts)
A) FHA, FSA/RHS & VA Home Purchase Loans
B) Conventional Home Purchase Loans
C) Refinancings
D) Home Improvement Loans
F) Non-occupant Loans on < 5 Family Dwellings (A B C & D)
G) Loans On Manufactured Home Dwelling (A B C & D)
Number
Average Value
Number
Average Value
Number
Average Value
Number
Average Value
Number
Average Value
Number
Average Value
LOANS ORIGINATED
49
$140,505
8
$154,866
30
$172,881
2
$24,885
3
$96,853
4
$94,165
APPLICATIONS APPROVED, NOT ACCEPTED
1
$99,540
0
$0
3
$187,430
1
$15,470
0
$0
1
$29,590
APPLICATIONS DENIED
5
$136,404
3
$111,650
17
$144,411
2
$27,915
1
$163,440
3
$91,923
APPLICATIONS WITHDRAWN
3
$176,447
3
$120,170
13
$185,327
0
$0
3
$280,250
1
$201,780
FILES CLOSED FOR INCOMPLETENESS
1
$30,940
0
$0
3
$134,070
0
$0
0
$0
1
$76,000
Aggregated Statistics For Year 2008 (Based on 2 partial tracts)
A) FHA, FSA/RHS & VA Home Purchase Loans
B) Conventional Home Purchase Loans
C) Refinancings
D) Home Improvement Loans
F) Non-occupant Loans on < 5 Family Dwellings (A B C & D)
G) Loans On Manufactured Home Dwelling (A B C & D)
Number
Average Value
Number
Average Value
Number
Average Value
Number
Average Value
Number
Average Value
Number
Average Value
LOANS ORIGINATED
46
$156,570
12
$174,035
36
$154,586
1
$54,480
4
$113,838
7
$89,360
APPLICATIONS APPROVED, NOT ACCEPTED
1
$64,570
1
$60,530
7
$133,463
1
$3,360
0
$0
2
$91,475
APPLICATIONS DENIED
11
$175,976
13
$158,113
46
$135,295
6
$162,097
3
$123,983
6
$75,892
APPLICATIONS WITHDRAWN
6
$169,720
3
$166,580
11
$208,873
2
$86,095
2
$322,510
1
$77,350
FILES CLOSED FOR INCOMPLETENESS
3
$127,570
6
$157,613
5
$145,820
0
$0
0
$0
0
$0
Aggregated Statistics For Year 2007 (Based on 2 partial tracts)
A) FHA, FSA/RHS & VA Home Purchase Loans
B) Conventional Home Purchase Loans
C) Refinancings
D) Home Improvement Loans
F) Non-occupant Loans on < 5 Family Dwellings (A B C & D)
G) Loans On Manufactured Home Dwelling (A B C & D)
Number
Average Value
Number
Average Value
Number
Average Value
Number
Average Value
Number
Average Value
Number
Average Value
LOANS ORIGINATED
27
$158,385
120
$150,007
36
$159,294
9
$85,943
17
$109,199
12
$95,229
APPLICATIONS APPROVED, NOT ACCEPTED
1
$121,070
15
$136,717
13
$153,870
1
$20,180
0
$0
1
$90,130
APPLICATIONS DENIED
5
$156,582
31
$161,012
66
$130,433
15
$98,245
3
$147,973
7
$71,103
APPLICATIONS WITHDRAWN
2
$126,785
15
$152,097
19
$150,485
3
$136,090
3
$109,633
2
$95,175
FILES CLOSED FOR INCOMPLETENESS
0
$0
9
$167,328
4
$194,382
1
$46,410
1
$110,980
0
$0
Aggregated Statistics For Year 2006 (Based on 2 partial tracts)
A) FHA, FSA/RHS & VA Home Purchase Loans
B) Conventional Home Purchase Loans
C) Refinancings
D) Home Improvement Loans
F) Non-occupant Loans on < 5 Family Dwellings (A B C & D)
G) Loans On Manufactured Home Dwelling (A B C & D)
Number
Average Value
Number
Average Value
Number
Average Value
Number
Average Value
Number
Average Value
Number
Average Value
LOANS ORIGINATED
36
$131,493
123
$107,441
41
$144,084
9
$95,733
30
$122,324
12
$92,034
APPLICATIONS APPROVED, NOT ACCEPTED
1
$197,070
9
$106,644
8
$116,612
0
$0
1
$80,040
1
$122,410
APPLICATIONS DENIED
4
$149,990
40
$103,950
45
$117,630
12
$64,906
5
$151,604
18
$64,644
APPLICATIONS WITHDRAWN
3
$160,977
21
$122,894
20
$111,618
0
$0
2
$92,820
2
$103,245
FILES CLOSED FOR INCOMPLETENESS
3
$115,910
9
$151,336
3
$155,147
0
$0
1
$83,400
1
$68,610
Aggregated Statistics For Year 2005 (Based on 2 partial tracts)
A) FHA, FSA/RHS & VA Home Purchase Loans
B) Conventional Home Purchase Loans
C) Refinancings
D) Home Improvement Loans
F) Non-occupant Loans on < 5 Family Dwellings (A B C & D)
G) Loans On Manufactured Home Dwelling (A B C & D)
Number
Average Value
Number
Average Value
Number
Average Value
Number
Average Value
Number
Average Value
Number
Average Value
LOANS ORIGINATED
27
$110,506
69
$99,009
26
$99,234
4
$69,615
9
$84,299
13
$80,608
APPLICATIONS APPROVED, NOT ACCEPTED
3
$95,733
11
$96,182
3
$64,347
1
$27,580
0
$0
2
$65,240
APPLICATIONS DENIED
4
$122,918
33
$92,187
36
$100,311
6
$60,310
9
$66,961
17
$52,700
APPLICATIONS WITHDRAWN
1
$66,590
18
$110,493
19
$106,129
1
$110,980
0
$0
3
$76,227
FILES CLOSED FOR INCOMPLETENESS
0
$0
2
$189,675
1
$67,260
0
$0
0
$0
0
$0
Aggregated Statistics For Year 2004 (Based on 2 partial tracts)
A) FHA, FSA/RHS & VA Home Purchase Loans
B) Conventional Home Purchase Loans
C) Refinancings
D) Home Improvement Loans
F) Non-occupant Loans on < 5 Family Dwellings (A B C & D)
G) Loans On Manufactured Home Dwelling (A B C & D)
Number
Average Value
Number
Average Value
Number
Average Value
Number
Average Value
Number
Average Value
Number
Average Value
LOANS ORIGINATED
14
$97,815
35
$107,597
30
$108,356
2
$66,585
6
$76,003
15
$67,081
APPLICATIONS APPROVED, NOT ACCEPTED
3
$82,057
7
$86,957
9
$98,124
0
$0
2
$68,940
5
$53,538
APPLICATIONS DENIED
1
$96,850
10
$72,506
34
$86,034
4
$34,975
1
$84,080
13
$57,740
APPLICATIONS WITHDRAWN
1
$61,880
3
$144,383
17
$126,805
1
$64,570
2
$337,310
1
$61,880
FILES CLOSED FOR INCOMPLETENESS
0
$0
1
$142,590
1
$189,670
0
$0
0
$0
0
$0
Aggregated Statistics For Year 2003 (Based on 2 partial tracts)
A) FHA, FSA/RHS & VA Home Purchase Loans
B) Conventional Home Purchase Loans
C) Refinancings
D) Home Improvement Loans
F) Non-occupant Loans on < 5 Family Dwellings (A B C & D)
Number
Average Value
Number
Average Value
Number
Average Value
Number
Average Value
Number
Average Value
LOANS ORIGINATED
5
$96,586
22
$124,553
47
$111,509
2
$14,795
5
$124,700
APPLICATIONS APPROVED, NOT ACCEPTED
1
$69,280
7
$48,043
9
$83,029
1
$4,710
2
$43,385
APPLICATIONS DENIED
3
$86,540
20
$58,752
35
$103,100
5
$12,914
1
$18,830
APPLICATIONS WITHDRAWN
1
$125,100
2
$105,260
15
$89,680
1
$4,710
1
$15,470
FILES CLOSED FOR INCOMPLETENESS
1
$55,830
0
$0
1
$86,770
0
$0
0
$0
Aggregated Statistics For Year 2002 (Based on 2 partial tracts)
A) FHA, FSA/RHS & VA Home Purchase Loans
B) Conventional Home Purchase Loans
C) Refinancings
D) Home Improvement Loans
F) Non-occupant Loans on < 5 Family Dwellings (A B C & D)
Number
Average Value
Number
Average Value
Number
Average Value
Number
Average Value
Number
Average Value
LOANS ORIGINATED
1
$95,510
15
$108,782
36
$100,423
1
$21,520
1
$32,280
APPLICATIONS APPROVED, NOT ACCEPTED
0
$0
3
$46,633
9
$95,360
0
$0
0
$0
APPLICATIONS DENIED
0
$0
13
$56,808
22
$74,108
1
$54,480
0
$0
APPLICATIONS WITHDRAWN
0
$0
3
$137,660
8
$105,430
1
$142,590
1
$46,410
FILES CLOSED FOR INCOMPLETENESS
1
$30,940
0
$0
1
$117,030
0
$0
0
$0
Aggregated Statistics For Year 2001 (Based on 2 partial tracts)
A) FHA, FSA/RHS & VA Home Purchase Loans
B) Conventional Home Purchase Loans
C) Refinancings
D) Home Improvement Loans
F) Non-occupant Loans on < 5 Family Dwellings (A B C & D)
Number
Average Value
Number
Average Value
Number
Average Value
Number
Average Value
Number
Average Value
LOANS ORIGINATED
1
$173,530
15
$86,541
20
$96,282
1
$16,140
2
$67,260
APPLICATIONS APPROVED, NOT ACCEPTED
1
$57,840
2
$54,815
4
$60,535
1
$6,730
1
$20,850
APPLICATIONS DENIED
0
$0
14
$46,601
43
$63,005
7
$10,186
1
$45,060
APPLICATIONS WITHDRAWN
0
$0
2
$122,415
13
$83,092
0
$0
0
$0
FILES CLOSED FOR INCOMPLETENESS
0
$0
0
$0
1
$45,060
0
$0
0
$0
Aggregated Statistics For Year 2000 (Based on 2 partial tracts)
A) FHA, FSA/RHS & VA Home Purchase Loans
B) Conventional Home Purchase Loans
C) Refinancings
D) Home Improvement Loans
F) Non-occupant Loans on < 5 Family Dwellings (A B C & D)
Number
Average Value
Number
Average Value
Number
Average Value
Number
Average Value
Number
Average Value
LOANS ORIGINATED
3
$53,807
15
$77,215
7
$71,391
3
$13,677
1
$12,780
APPLICATIONS APPROVED, NOT ACCEPTED
1
$28,920
5
$41,836
4
$78,525
0
$0
0
$0
APPLICATIONS DENIED
0
$0
17
$62,512
24
$56,078
1
$4,710
1
$52,460
APPLICATIONS WITHDRAWN
0
$0
2
$110,645
4
$55,825
1
$25,560
0
$0
FILES CLOSED FOR INCOMPLETENESS
0
$0
1
$133,850
1
$148,640
0
$0
0
$0
Aggregated Statistics For Year 1999 (Based on 1 partial tract)
Detailed PMIC statistics for the following Tracts:0206.00
2002 - 2018 National Fire Incident Reporting System (NFIRS) incidents
Based on the data from the years 2002 - 2018 the average number of fire incidents per year is 32. The highest number of fires - 56 took place in 2008, and the least - 12 in 2002. The data has an increasing trend.
When looking into fire subcategories, the most incidents belonged to: Outside Fires (40.3%), and Structure Fires (26.7%).
Fire incident types reported to NFIRS in Zip Code 32343


 Nearest zip codes: 32310, 32304, 32303, 32333, 32351, 32399.


 Based on the data from the years 2002 - 2018 the average number of fire incidents per year is 32. The highest number of fires - 56 took place in 2008, and the least - 12 in 2002. The data has an increasing trend.
 When looking into fire subcategories, the most incidents belonged to: Outside Fires (40.3%), and Structure Fires (26.7%).