Estimated zip code population in 2022: 7,439 Zip code population in 2010: 5,296 Zip code population in 2000: 4,278
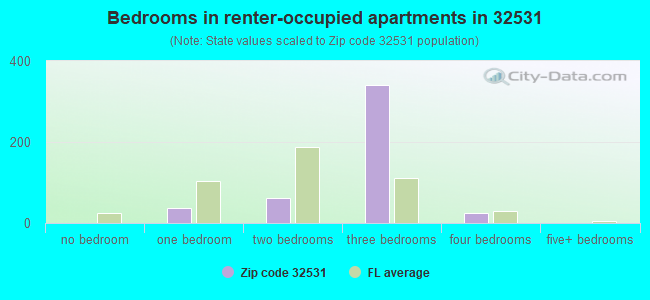
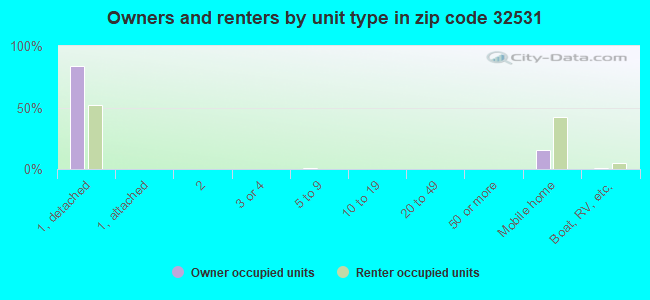
Houses and condos: 3,458 Renter-occupied apartments: 473
% of renters here:
15%
State:
33%
March 2022 cost of living index in zip code 32531: 82.3 (low, U.S. average is 100)
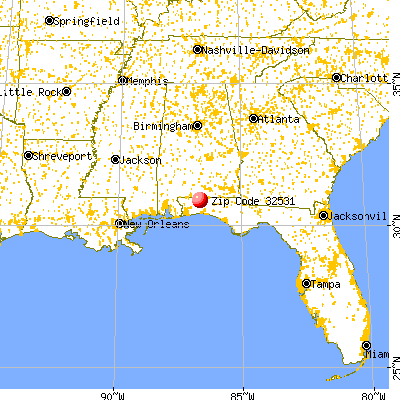
Land area: 217.4 sq. mi. Water area: 2.3 sq. mi.
Population density: 34 people per square mile
(very low).
OSM Map
General Map
Google Map
MSN Map
OSM Map
General Map
Google Map
MSN Map
OSM Map
General Map
Google Map
MSN Map
OSM Map
General Map
Google Map
MSN Map
Please wait while loading the map...
Real estate property taxes paid for housing units in 2022:
This zip code:
0.4% ($1,251)
Florida:
0.7% ($2,529)
Median real estate property taxes paid for housing units with mortgages in 2022: $1,465 (0.4%) Median real estate property taxes paid for housing units with no mortgage in 2022: $1,032 (0.4%)
Business Search- 14 Million verified businesses
Males: 3,758
(50.5%)
Females: 3,680
(49.5%)
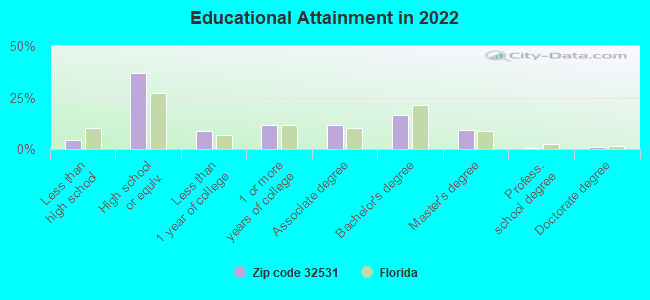
For population 25 years and over in 32531:
High school or higher: 95.2%
Bachelor's degree or higher: 26.7%
Graduate or professional degree: 10.2%
Unemployed: 2.5%
Mean travel time to work (commute): 44.5 minutes
For population 15 years and over in 32531:
Never married: 17.4%
Now married: 58.4%
Separated: 1.0%
Widowed: 6.8%
Divorced: 16.4%
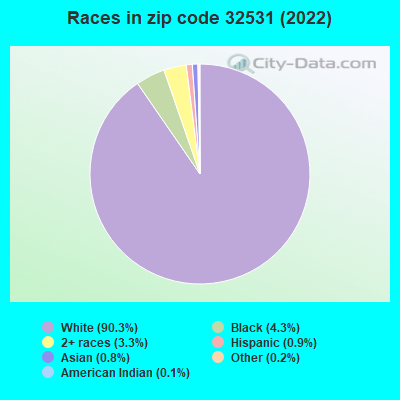
Zip code 32531 compared to state average:
Black race population percentage significantly below state average.
Hispanic race population percentage significantly below state average.
Foreign-born population percentage significantly below state average.
Renting percentage below state average.
Length of stay since moving in significantly above state average.
Averages for the 2020 tax year for zip code 32531, filed in 2021:
Average Adjusted Gross Income (AGI) in 2020: $62,632 (Individual Income Tax Returns)
Here:
$62,632
State:
$82,200
Salary/wage: $54,623 (reported on 78.8% of returns)
Here:
$54,623
State:
$58,347
(% of AGI for various income ranges: 1071.2% for AGIs below $25k, 3533.9% for AGIs $25k-50k, 6137.0% for AGIs $50k-75k, 8470.8% for AGIs $75k-100k, 16793.4% for AGIs $100k-200k, 50200.0% for AGIs over 200k)
Taxable interest for individuals: $1,106 (reported on 31.8% of returns)
This zip code:
$1,106
Florida:
$4,272
(% of AGI for various income ranges: 20.9% for AGIs below $25k, 20.5% for AGIs $25k-50k, 37.3% for AGIs $50k-75k, 44.6% for AGIs $75k-100k, 175.2% for AGIs $100k-200k, 256.7% for AGIs over 200k)
Ordinary dividends: $2,297 (reported on 11.6% of returns)
Here:
$2,297
State:
$15,863
(% of AGI for various income ranges: 4.2% for AGIs below $25k, 16.6% for AGIs $25k-50k, 18.8% for AGIs $50k-75k, 45.0% for AGIs $75k-100k, 112.8% for AGIs $100k-200k, 660.0% for AGIs over 200k)
Net capital gain/loss in AGI: +$11,400 (reported on 11.9% of returns)
Here:
+$11,400
State:
+$62,983
(% of AGI for various income ranges: 0.5% for AGIs below $25k, 24.1% for AGIs $25k-50k, 101.8% for AGIs $50k-75k, 98.8% for AGIs $75k-100k, 684.1% for AGIs $100k-200k, 5033.3% for AGIs over 200k)
Profit/loss from business: +$10,119 (reported on 15.1% of returns)
Here:
+$10,119
State:
+$9,719
(% of AGI for various income ranges: 173.4% for AGIs below $25k, 137.4% for AGIs $25k-50k, 113.3% for AGIs $50k-75k, 290.4% for AGIs $75k-100k, 55.2% for AGIs $100k-200k, 4680.0% for AGIs over 200k)
Taxable individual retirement arrangement distribution: $20,596 (reported on 7.4% of returns)
32531:
$20,596
Florida:
$24,823
(% of AGI for various income ranges: 37.2% for AGIs below $25k, 100.2% for AGIs $25k-50k, 119.4% for AGIs $50k-75k, 335.4% for AGIs $75k-100k, 914.5% for AGIs $100k-200k)
Total itemized deductions: $36,158 (reported on 3.9% of returns)
Here:
$36,158
State:
$45,393
(% of AGI for various income ranges: 164.6% for AGIs $25k-50k, 408.8% for AGIs $75k-100k, 466.2% for AGIs $100k-200k, 3340.0% for AGIs over 200k)
Charity contributions: $14,500 (reported on 2.9% of returns)
Here:
$14,500
State:
$20,178
(% of AGI for various income ranges: 83.9% for AGIs $50k-75k, 140.0% for AGIs $100k-200k, 2073.3% for AGIs over 200k)
Taxes paid: $5,027 (reported on 3.5% of returns)
32531:
$5,027
State:
$6,967
(% of AGI for various income ranges: 16.1% for AGIs $25k-50k, 45.4% for AGIs $75k-100k, 74.1% for AGIs $100k-200k, 436.7% for AGIs over 200k)
Earned income credit: $2,507 (reported on 17.4% of returns)
Here:
$2,507
State:
$2,306
(% of AGI for various income ranges: 116.4% for AGIs below $25k, 80.8% for AGIs $25k-50k)
Percentage of individuals using paid preparers for their 2020 taxes: 93.2%
Here:
93%
State:
92%
(% for various income ranges: 93.7% for AGIs below $25k, 92.3% for AGIs $25k-50k, 89.4% for AGIs $50k-75k, 97.0% for AGIs $75k-100k, 94.0% for AGIs $100k-200k, 100.0% for AGIs over 200k)
Averages for the 2012 tax year for zip code 32531, filed in 2013:
Average Adjusted Gross Income (AGI) in 2012: $52,773 (Individual Income Tax Returns)
Here:
$52,773
State:
$60,316
Salary/wage: $43,263 (reported on 81.5% of returns)
Here:
$43,263
State:
$45,277
(% of AGI for various income ranges: 73.8% for AGIs below $25k, 76.2% for AGIs $25k-50k, 72.7% for AGIs $50k-75k, 72.6% for AGIs $75k-100k, 75.6% for AGIs $100k-200k, 24.8% for AGIs over 200k)
Taxable interest for individuals: $1,209 (reported on 29.9% of returns)
This zip code:
$1,209
Florida:
$3,587
(% of AGI for various income ranges: 0.8% for AGIs below $25k, 0.6% for AGIs $25k-50k, 1.0% for AGIs $50k-75k, 0.3% for AGIs $75k-100k, 1.1% for AGIs $100k-200k)
Ordinary dividends: $1,779 (reported on 11.0% of returns)
Here:
$1,779
State:
$12,831
(% of AGI for various income ranges: 0.3% for AGIs below $25k, 0.2% for AGIs $25k-50k, 0.9% for AGIs $50k-75k, 0.2% for AGIs $75k-100k, 0.5% for AGIs $100k-200k)
Net capital gain/loss in AGI: +$5,152 (reported on 9.8% of returns)
Here:
+$5,152
State:
+$33,493
(% of AGI for various income ranges: 0.8% for AGIs $50k-75k, 1.0% for AGIs $75k-100k, 2.8% for AGIs $100k-200k)
Profit/loss from business: +$8,285 (reported on 13.4% of returns)
Here:
+$8,285
State:
+$10,012
(% of AGI for various income ranges: 8.3% for AGIs below $25k, 2.0% for AGIs $25k-50k, 0.9% for AGIs $50k-75k, 1.1% for AGIs $75k-100k, 2.8% for AGIs $100k-200k)
Taxable individual retirement arrangement distribution: $12,219 (reported on 8.3% of returns)
32531:
$12,219
Florida:
$21,544
(% of AGI for various income ranges: 2.3% for AGIs below $25k, 1.4% for AGIs $25k-50k, 2.0% for AGIs $50k-75k, 2.6% for AGIs $75k-100k, 2.9% for AGIs $100k-200k)
Total itemized deductions: $19,757 (20% of AGI, reported on 21.3% of returns)
Here:
$19,757
State:
$25,533
Here:
20.5% of AGI
State:
18.0% of AGI
(% of AGI for various income ranges: 3.9% for AGIs below $25k, 7.3% for AGIs $25k-50k, 9.2% for AGIs $50k-75k, 8.0% for AGIs $75k-100k, 10.5% for AGIs $100k-200k, 5.7% for AGIs over 200k)
Charity contributions: $4,682 (reported on 15.4% of returns)
Here:
$4,682
State:
$5,698
(% of AGI for various income ranges: 0.3% for AGIs below $25k, 1.0% for AGIs $25k-50k, 1.3% for AGIs $50k-75k, 1.4% for AGIs $75k-100k, 2.3% for AGIs $100k-200k, 1.0% for AGIs over 200k)
Taxes paid: $2,994 (reported on 20.1% of returns)
32531:
$2,994
State:
$6,203
(% of AGI for various income ranges: 0.4% for AGIs below $25k, 0.9% for AGIs $25k-50k, 1.3% for AGIs $50k-75k, 1.2% for AGIs $75k-100k, 1.8% for AGIs $100k-200k, 0.7% for AGIs over 200k)
Earned income credit: $2,508 (reported on 20.1% of returns)
Here:
$2,508
State:
$2,372
(% of AGI for various income ranges: 8.0% for AGIs below $25k, 1.3% for AGIs $25k-50k)
Percentage of individuals using paid preparers for their 2012 taxes: 51.6%
Here:
52%
State:
54%
(% for various income ranges: 50.5% for AGIs below $25k, 49.2% for AGIs $25k-50k, 57.1% for AGIs $50k-75k, 52.0% for AGIs $75k-100k, 50.0% for AGIs $100k-200k, 66.7% for AGIs over 200k)
Averages for the 2004 tax year for zip code 32531, filed in 2005:
Average Adjusted Gross Income (AGI) in 2004: $43,402 (Individual Income Tax Returns)
Here:
$43,402
State:
$50,523
Salary/wage: $34,236 (reported on 83.4% of returns)
Here:
$34,236
State:
$39,563
(% of AGI for various income ranges: 105.4% for AGIs below $10k, 74.6% for AGIs $10k-25k, 81.6% for AGIs $25k-50k, 81.2% for AGIs $50k-75k, 80.3% for AGIs $75k-100k, 32.5% for AGIs over 100k)
Taxable interest for individuals: $1,091 (reported on 37.1% of returns)
This zip code:
$1,091
Florida:
$3,211
(% of AGI for various income ranges: 4.6% for AGIs below $10k, 1.6% for AGIs $10k-25k, 0.9% for AGIs $25k-50k, 0.8% for AGIs $50k-75k, 0.3% for AGIs $75k-100k, 0.9% for AGIs over 100k)
Taxable dividends: $856 (reported on 12.1% of returns)
Here:
$856
State:
$6,129
(% of AGI for various income ranges: 1.0% for AGIs below $10k, 0.4% for AGIs $10k-25k, 0.3% for AGIs $25k-50k, 0.1% for AGIs $50k-75k, 0.2% for AGIs $75k-100k, 0.2% for AGIs over 100k)
Net capital gain/loss: +$22,946 (reported on 10.8% of returns)
Here:
+$22,946
State:
+$27,205
(% of AGI for various income ranges: 2.2% for AGIs below $10k, 0.1% for AGIs $10k-25k, 0.3% for AGIs $25k-50k, 1.1% for AGIs $50k-75k, 2.2% for AGIs $75k-100k, 16.2% for AGIs over 100k)
Profit/loss from business: +$8,261 (reported on 14.6% of returns)
Here:
+$8,261
State:
+$10,634
(% of AGI for various income ranges: 11.9% for AGIs below $10k, 6.2% for AGIs $10k-25k, 3.0% for AGIs $25k-50k, 2.8% for AGIs $50k-75k, 2.6% for AGIs $75k-100k, 1.0% for AGIs over 100k)
IRA payment deduction: $3,167 (reported on 1.6% of returns)
32531:
$3,167
Florida:
$3,082
Total itemized deductions: $15,450 (22% of AGI, reported on 19.6% of returns)
Here:
$15,450
State:
$20,370
Here:
21.9% of AGI
State:
20.7% of AGI
(% of AGI for various income ranges: 6.9% for AGIs $10k-25k, 8.0% for AGIs $25k-50k, 8.7% for AGIs $50k-75k, 9.8% for AGIs $75k-100k, 4.3% for AGIs over 100k)
Charity contributions deductions: $3,883 (4% of AGI, reported on 15.4% of returns)
Here:
$3,883
State:
$4,064
Here:
3.9% of AGI
State:
3.8% of AGI
(% of AGI for various income ranges: 0.6% for AGIs $10k-25k, 1.3% for AGIs $25k-50k, 1.6% for AGIs $50k-75k, 1.9% for AGIs $75k-100k, 1.4% for AGIs over 100k)
Total tax: $5,728 (reported on 73.7% of returns)
32531:
$5,728
State:
$9,431
(% of AGI for various income ranges: 2.9% for AGIs below $10k, 3.8% for AGIs $10k-25k, 5.9% for AGIs $25k-50k, 8.2% for AGIs $50k-75k, 10.7% for AGIs $75k-100k, 15.4% for AGIs over 100k)
Earned income credit: $1,792 (reported on 18.3% of returns)
Here:
$1,792
State:
$1,808
Percentage of individuals using paid preparers for their 2004 taxes: 60.7%
Here:
61%
State:
60%
(% for various income ranges: 57.4% for AGIs below $10k, 62.6% for AGIs $10k-25k, 62.0% for AGIs $25k-50k, 62.3% for AGIs $50k-75k, 52.1% for AGIs $75k-100k, 65.5% for AGIs over 100k)
Household received Food Stamps/SNAP in the past 12 months: 218 Household did not receive Food Stamps/SNAP in the past 12 months: 2,944
Women who had a birth in the past 12 months: 43 (25 now married, 18 unmarried) Women who did not have a birth in the past 12 months: 1,320 (718 now married, 603 unmarried)
Housing units in zip code 32531 with a mortgage: 1,609 (23 second mortgage, 16 both second mortgage and home equity loan) Median monthly owner costs for units with a mortgage: $1,639 Median monthly owner costs for units without a mortgage: $459
Residents with income below the poverty level in 2022:
This zip code:
11.0%
Whole state:
12.7%
Residents with income below 50% of the poverty level in 2022:
This zip code:
9.3%
Whole state:
6.6%
Median number of rooms in houses and condos:
Here:
6.5
State:
5.9
Median number of rooms in apartments:
Here:
5.7
State:
4.2
Notable locations in this zip code not listed on our city pages
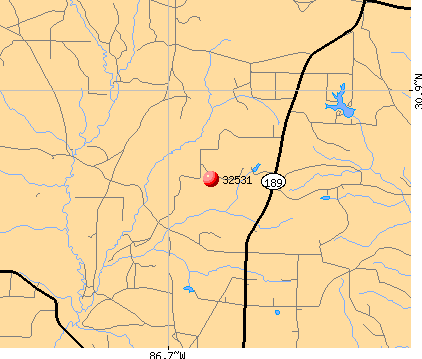
Notable locations in zip code 32531: Fauck Ferry (A), Bluff Landing (B), Meritt Landing (C), Okaloosa County Emergency Medical Services Station 5 (D), Baker Fire District (E), Blackman Volunteer Fire Department (F), North Okaloosa Fire Department Station 83 (G). Display/hide their locations on the map
Churches in zip code 32531 include: Beaver Creek Church (A), Pyron Spring Chapel (B), Lighthouse Church (C), Rock Hill Church (D), Red Oak Church (E), Olive Branch Church (F), Shady Grove Church (G), New Bethany Church (H), Bullard Church (I). Display/hide their locations on the map
Cemeteries: Beulah Cemetery (1), Stewart Cemetery (2), Griffith Cemetery (3), Rock Hill Cemetery (4), Cobb Cemetery (5), Hobbs Cemetery (6). Display/hide their locations on the map
Lakes and reservoirs: Martins Mill Pond (A), Danley Pond (B), E C Younghood Pond (C), O G Steele Pond (D), Carver Pond (E), Dixon Lake (F), A A Hilton Pond (G), Karick Lake (H). Display/hide their locations on the map
Streams, rivers, and creeks: Little Escambia Creek (A), Big Branch (B), Reedy Creek (C), Polley Creek (D), Panther Creek (E), Olive Branch (F), Oak Creek (G), Mare Creek (H), Kennedy Branch (I). Display/hide their locations on the map
In group quarters: 6 (-1 institutionalized population)
Size of family households: 983 2-persons, 551 3-persons, 240 4-persons, 195 5-persons, 96 6-persons, 52 7-or-more-persons
Size of nonfamily households: 889 1-person, 103 2-persons, 35 3-persons
1,103 married couples with children.
403 single-parent households (31 men, 372 women).
99.1% of residents of 32531 zip code speak English at home.
0.2% of residents speak Spanish at home (100% very well).
0.4% of residents speak Asian or Pacific Island language at home (100% very well).
Foreign born population: 60 (0.8%) (100.0% of them are naturalized citizens)
This zip code:
0.8%
Whole state:
21.7%
56%Sweden
54%United Kingdom, excluding England and Scotland
43%Malaysia
25%American
21%English
9%Irish
6%German
5%European
4%Norwegian
3%Scotch-Irish
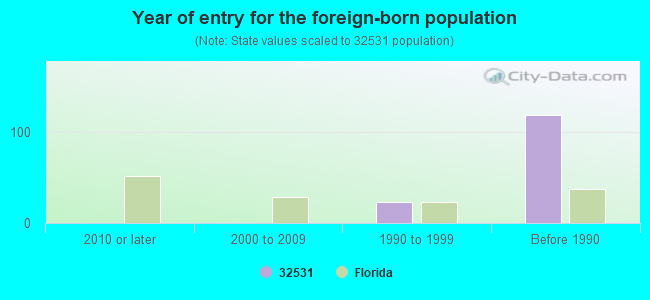
Year of entry for the foreign-born population
02010 or later
02000 to 2009
231990 to 1999
119Before 1990
Facilities with environmental interests located in this zip code:
SKY PARK ESTATES - FIRST ADDIT (SKY RANCH DR. in BAKER, FL)
National Pollutant Discharge Elimination System NON-MAJOR (Tracking pollutant discharge elimination systems) - permit Organizations: LARRY MORGAN (CONTACT/OWNER)
AGRICO CHEM CO AGRICO FARM CENTER (HIGHWAY 189 NORTH in BAKER, FL)
(Resource Conservation and Recovery Act (tracking hazardous waste)) Organizations: ESTECH GEN CHEMICAL CORP (CONTACT/OWNER)
MERRITTS AUTO REPAIR AND PARTS (5305 MERRIT DR in BAKER, FL)
(Resource Conservation and Recovery Act (tracking hazardous waste)) Organizations: GEORGE MERRITT (CONTACT/OWNER)
COUNTY ROAD 393 WIDENING/ RESU (CR393 in CRESTVIEW, FL)
National Pollutant Discharge Elimination System NON-MAJOR (Tracking pollutant discharge elimination systems) - permit Organizations: JOHN MACDONALD (CONTACT/OWNER)
CJ USED AUTO PARTS (5655 CEMETARY ROAD in BAKER, FL)
National Pollutant Discharge Elimination System NON-MAJOR (Tracking pollutant discharge elimination systems) - permit Business SIC classification: MOTOR VEHICLE PARTS, USED Organizations: C CAHILL (CONTACT/OWNER)
Housing units lacking complete plumbing facilities: 2.2% Housing units lacking complete kitchen facilities: 1.1%
82.2%Electricity
6.9%Bottled, tank, or LP gas
5.3%Utility gas
4.8%Wood
1.0%Solar energy
Population in 1990: 3,389. Population change in the 1990s: +889 (+26.2%).
Place of birth for U.S.-born residents:
This state: 3,908
Northeast: 548
Midwest: 696
South: 1,796
West: 269
69% of the 32531 zip code residents lived in the same house 5 years ago. Out of people who lived in different houses, 69% lived in this county. Out of people who lived in different counties, 50% lived in Florida.
88% of the 32531 zip code residents lived in the same house 1 year ago. Out of people who lived in different houses, 33% moved from this county. Out of people who lived in different houses, 25% moved from different county within same state. Out of people who lived in different houses, 44% moved from different state.
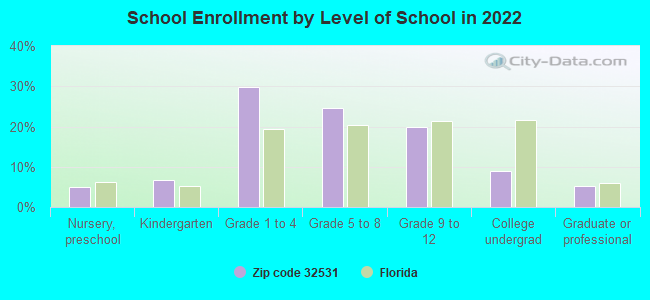
Private vs. public school enrollment:
Students in private schools in grades 1 to 8 (elementary and middle school): 79
Here:
8.9%
Florida:
15.8%
Students in private schools in grades 9 to 12 (high school):
Here:
0.0%
Florida:
12.9%
Students in private undergraduate colleges: 30
Here:
20.8%
Florida:
23.6%
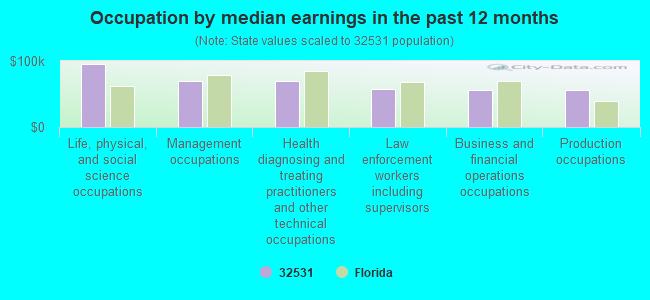
Occupation by median earnings in the past 12 months ($)
95,154Life, physical, and social science occupations
69,331Management occupations
68,982Health diagnosing and treating practitioners and other technical occupations
57,400Law enforcement workers including supervisors
56,605Business and financial operations occupations
56,563Production occupations
Companies with federal contracts located in this zip code:
MORGAN CONTRACTING INC (1529 SKY RANCH LN in BAKER, FL; small business) : $835,929 in 2 contractsfrom 2003 to 2005
$834,000 with Air Force for Maintenance, Repair or Alteration of Real Property -- Sewage and Waste Facilities. Signed on 2003-09-26. Completion date: 2003-09-26.
$1,929, same as above.Signed on 2005-08-19. Completion date: 2005-08-21.
R & S SERVICES (2448 R J STABLER LANE in BAKER, FL; small business) : $760,403 in 20 contractsfrom 1999 to 2002
Contracts for Landscaping/Groundskeeping Services by Navy Signed by year:2000: $241,978; 2001: $56,961; 2002: $220,316; 2003: $0; 2004: $0; 2005: $0; 2006: $0.
Biggest contracts:
$241,978 with Navy for Landscaping/Groundskeeping Services. Signed on 2000-11-02. Completion date: 2001-09-30.
$241,148, same as above.Signed on 1999-11-03. Completion date: 2000-09-30.
$107,469, same as above.Signed on 2002-02-07. Completion date: 2002-05-31.
$87,162, same as above.Signed on 2002-05-20. Completion date: 2002-05-31.
PROP & ROTOR AVIATION, INC (1460 VINSON RAY RD in BAKER, FL; small business) : $77,811 in 8 contractsfrom 2003 to 2006
Contracts for Patent and Trademark Services, Other Administrative Support Services, Recreational Services, Miscellaneous Items by Air Force Signed by year:2000: $0; 2001: $0; 2002: $0; 2003: $5,500; 2004: $7,000; 2005: $33,211; 2006: $32,100.
Biggest contracts:
$22,100 with Air Force for Patent and Trademark Services. Taking place in ND. Signed on 2006-05-31. Completion date: 2006-07-06.
$16,711 with Air Force for Other Administrative Support Services. Signed on 2005-07-20. Completion date: 2005-09-05.
$10,000 with Air Force for Recreational Services. Signed on 2006-04-10. Completion date: 2006-05-31.
$7,500 with Air Force for Miscellaneous Items. Taking place in PA. Signed on 2005-06-27. Completion date: 2005-07-11.
Top industries in this zip code by the number of employees in 2005:
Other Services (except Public Administration): Religious Organizations (10-19 employees: 1 establishment, 5-9 employees: 3 establishments, 1-4 employees: 2 establishments)
Construction: Water and Sewer Line and Related Structures Construction (20-49: 1)
Construction: New Single-Family Housing Construction (except Operative Builders) (5-9: 1, 1-4: 4)
Real Estate and Rental and Leasing: Offices of Real Estate Agents and Brokers (5-9: 1, 1-4: 4)
Construction: Plumbing, Heating, and Air-Conditioning Contractors (5-9: 1, 1-4: 4)
Administrative and Support and Waste Management and Remediation Services: Landscaping Services (5-9: 1, 1-4: 3)
Real Estate and Rental and Leasing: Lessors of Nonresidential Buildings (except Miniwarehouses) (5-9: 1)
Health Care and Social Assistance: Offices of Physicians (except Mental Health Specialists) (5-9: 1)
People in group quarters in 2010:
3 people in group homes intended for adults
Fatal accident statistics in 2013:
Fatal accident count: 4
Vehicles involved in fatal accidents: 5
Fatal accidents caused by drunken drivers: 2
Fatalities: 4
Persons involved in fatal accidents: 6
Pedestrians involved in fatal accidents: 1
Fatal accident statistics in 2012:
Fatal accident count: 2
Vehicles involved in fatal accidents: 4
Fatal accidents caused by drunken drivers: 0
Fatalities: 3
Persons involved in fatal accidents: 11
Pedestrians involved in fatal accidents: 0
Home Mortgage Disclosure Act Aggregated Statistics For Year 2009 (Based on 2 partial tracts)
A) FHA, FSA/RHS & VA Home Purchase Loans
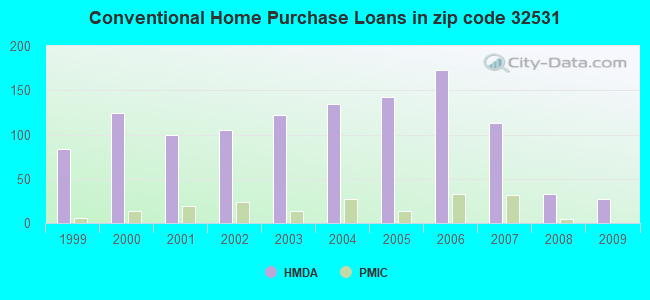
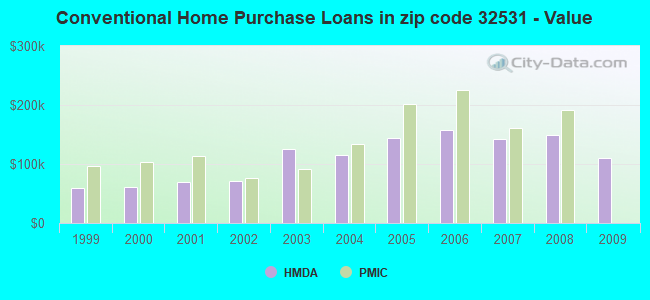
B) Conventional Home Purchase Loans
C) Refinancings
D) Home Improvement Loans
F) Non-occupant Loans on < 5 Family Dwellings (A B C & D)
G) Loans On Manufactured Home Dwelling (A B C & D)
Number
Average Value
Number
Average Value
Number
Average Value
Number
Average Value
Number
Average Value
Number
Average Value
LOANS ORIGINATED
35
$149,126
27
$109,706
165
$161,317
17
$43,513
16
$97,934
17
$83,658
APPLICATIONS APPROVED, NOT ACCEPTED
5
$139,354
2
$39,770
5
$127,264
0
$0
0
$0
0
$0
APPLICATIONS DENIED
8
$179,561
19
$72,674
81
$164,952
14
$69,541
10
$128,537
30
$71,374
APPLICATIONS WITHDRAWN
6
$141,052
3
$104,993
56
$163,881
2
$79,540
3
$88,553
10
$95,289
FILES CLOSED FOR INCOMPLETENESS
0
$0
2
$113,740
21
$162,640
2
$86,700
0
$0
6
$112,947
Aggregated Statistics For Year 2008 (Based on 2 partial tracts)
A) FHA, FSA/RHS & VA Home Purchase Loans
B) Conventional Home Purchase Loans
C) Refinancings
D) Home Improvement Loans
F) Non-occupant Loans on < 5 Family Dwellings (A B C & D)
G) Loans On Manufactured Home Dwelling (A B C & D)
Number
Average Value
Number
Average Value
Number
Average Value
Number
Average Value
Number
Average Value
Number
Average Value
LOANS ORIGINATED
37
$169,442
33
$148,668
132
$138,870
38
$64,427
11
$94,435
33
$71,248
APPLICATIONS APPROVED, NOT ACCEPTED
0
$0
5
$139,036
32
$110,212
2
$3,975
3
$68,403
8
$42,951
APPLICATIONS DENIED
3
$162,793
29
$134,121
113
$171,074
29
$83,544
6
$138,135
43
$100,960
APPLICATIONS WITHDRAWN
6
$232,522
10
$139,195
54
$168,507
2
$63,630
0
$0
8
$126,270
FILES CLOSED FOR INCOMPLETENESS
0
$0
2
$131,240
13
$241,557
2
$17,500
0
$0
2
$17,500
Aggregated Statistics For Year 2007 (Based on 2 partial tracts)
A) FHA, FSA/RHS & VA Home Purchase Loans
B) Conventional Home Purchase Loans
C) Refinancings
D) Home Improvement Loans
F) Non-occupant Loans on < 5 Family Dwellings (A B C & D)
G) Loans On Manufactured Home Dwelling (A B C & D)
Number
Average Value
Number
Average Value
Number
Average Value
Number
Average Value
Number
Average Value
Number
Average Value
LOANS ORIGINATED
32
$196,364
113
$142,426
207
$188,352
67
$67,645
22
$151,921
59
$85,472
APPLICATIONS APPROVED, NOT ACCEPTED
6
$93,857
21
$138,702
40
$147,706
13
$37,935
5
$202,032
16
$98,431
APPLICATIONS DENIED
10
$127,264
46
$190,170
180
$154,087
70
$71,222
13
$110,499
46
$97,592
APPLICATIONS WITHDRAWN
10
$146,513
27
$145,352
78
$158,754
11
$145,341
2
$311,000
17
$132,317
FILES CLOSED FOR INCOMPLETENESS
2
$174,990
6
$143,172
25
$135,536
3
$51,437
0
$0
2
$50,110
Aggregated Statistics For Year 2006 (Based on 2 partial tracts)
A) FHA, FSA/RHS & VA Home Purchase Loans
B) Conventional Home Purchase Loans
C) Refinancings
D) Home Improvement Loans
F) Non-occupant Loans on < 5 Family Dwellings (A B C & D)
G) Loans On Manufactured Home Dwelling (A B C & D)
Number
Average Value
Number
Average Value
Number
Average Value
Number
Average Value
Number
Average Value
Number
Average Value
LOANS ORIGINATED
73
$194,666
173
$157,167
363
$154,404
67
$68,998
45
$173,362
99
$87,815
APPLICATIONS APPROVED, NOT ACCEPTED
5
$228,758
45
$92,372
54
$141,287
10
$62,678
2
$213,965
33
$57,847
APPLICATIONS DENIED
8
$254,528
95
$110,787
180
$142,288
62
$67,712
13
$78,928
97
$70,799
APPLICATIONS WITHDRAWN
8
$165,045
24
$135,815
157
$164,177
13
$91,777
5
$464,514
16
$83,219
FILES CLOSED FOR INCOMPLETENESS
2
$97,040
2
$108,175
27
$153,129
5
$36,588
2
$39,770
2
$47,725
Aggregated Statistics For Year 2005 (Based on 2 partial tracts)
A) FHA, FSA/RHS & VA Home Purchase Loans
B) Conventional Home Purchase Loans
C) Refinancings
D) Home Improvement Loans
F) Non-occupant Loans on < 5 Family Dwellings (A B C & D)
G) Loans On Manufactured Home Dwelling (A B C & D)
Number
Average Value
Number
Average Value
Number
Average Value
Number
Average Value
Number
Average Value
Number
Average Value
LOANS ORIGINATED
52
$166,850
142
$144,516
227
$134,251
46
$49,073
30
$201,342
62
$67,096
APPLICATIONS APPROVED, NOT ACCEPTED
13
$125,306
45
$103,473
56
$93,204
8
$90,278
8
$171,409
40
$68,802
APPLICATIONS DENIED
3
$44,013
97
$83,492
156
$94,775
38
$46,636
16
$66,217
99
$65,994
APPLICATIONS WITHDRAWN
6
$115,333
33
$136,761
145
$137,566
14
$101,925
8
$74,171
19
$89,252
FILES CLOSED FOR INCOMPLETENESS
2
$73,970
6
$101,282
16
$162,759
0
$0
0
$0
0
$0
Aggregated Statistics For Year 2004 (Based on 2 partial tracts)
A) FHA, FSA/RHS & VA Home Purchase Loans
B) Conventional Home Purchase Loans
C) Refinancings
D) Home Improvement Loans
F) Non-occupant Loans on < 5 Family Dwellings (A B C & D)
G) Loans On Manufactured Home Dwelling (A B C & D)
Number
Average Value
Number
Average Value
Number
Average Value
Number
Average Value
Number
Average Value
Number
Average Value
LOANS ORIGINATED
64
$134,398
134
$115,475
194
$101,467
32
$41,062
22
$68,766
64
$63,532
APPLICATIONS APPROVED, NOT ACCEPTED
2
$68,405
35
$74,631
59
$75,253
2
$35,795
5
$45,816
27
$46,074
APPLICATIONS DENIED
11
$93,857
91
$64,524
146
$78,167
19
$18,755
8
$52,298
100
$59,973
APPLICATIONS WITHDRAWN
3
$130,977
30
$148,899
116
$98,575
6
$45,603
11
$136,085
13
$73,544
FILES CLOSED FOR INCOMPLETENESS
0
$0
3
$74,767
13
$100,221
0
$0
0
$0
3
$59,390
Aggregated Statistics For Year 2003 (Based on 2 partial tracts)
A) FHA, FSA/RHS & VA Home Purchase Loans
B) Conventional Home Purchase Loans
C) Refinancings
D) Home Improvement Loans
F) Non-occupant Loans on < 5 Family Dwellings (A B C & D)
Number
Average Value
Number
Average Value
Number
Average Value
Number
Average Value
Number
Average Value
LOANS ORIGINATED
30
$111,674
122
$124,891
290
$92,623
14
$37,156
16
$79,838
APPLICATIONS APPROVED, NOT ACCEPTED
2
$51,700
75
$60,896
43
$77,320
2
$8,750
2
$16,705
APPLICATIONS DENIED
13
$74,890
83
$64,590
194
$84,058
21
$24,620
3
$56,207
APPLICATIONS WITHDRAWN
13
$97,284
19
$116,128
94
$96,937
8
$39,372
8
$97,039
FILES CLOSED FOR INCOMPLETENESS
2
$63,630
2
$63,630
54
$121,814
0
$0
0
$0
Aggregated Statistics For Year 2002 (Based on 2 partial tracts)
A) FHA, FSA/RHS & VA Home Purchase Loans
B) Conventional Home Purchase Loans
C) Refinancings
D) Home Improvement Loans
F) Non-occupant Loans on < 5 Family Dwellings (A B C & D)
Number
Average Value
Number
Average Value
Number
Average Value
Number
Average Value
Number
Average Value
LOANS ORIGINATED
30
$106,318
105
$71,086
172
$88,336
33
$19,716
19
$35,751
APPLICATIONS APPROVED, NOT ACCEPTED
2
$24,655
24
$54,750
43
$77,431
10
$31,498
3
$58,330
APPLICATIONS DENIED
3
$148,473
65
$54,919
124
$77,295
35
$19,362
3
$73,707
APPLICATIONS WITHDRAWN
2
$47,725
13
$55,923
91
$87,669
8
$15,311
2
$135,220
FILES CLOSED FOR INCOMPLETENESS
0
$0
3
$91,737
13
$100,343
0
$0
0
$0
Aggregated Statistics For Year 2001 (Based on 2 partial tracts)
A) FHA, FSA/RHS & VA Home Purchase Loans
B) Conventional Home Purchase Loans
C) Refinancings
D) Home Improvement Loans
F) Non-occupant Loans on < 5 Family Dwellings (A B C & D)
Number
Average Value
Number
Average Value
Number
Average Value
Number
Average Value
Number
Average Value
LOANS ORIGINATED
27
$109,942
99
$70,076
188
$73,016
40
$16,107
29
$53,429
APPLICATIONS APPROVED, NOT ACCEPTED
0
$0
29
$52,387
41
$63,865
6
$17,233
3
$117,720
APPLICATIONS DENIED
2
$79,540
92
$57,580
165
$62,678
40
$20,124
3
$24,923
APPLICATIONS WITHDRAWN
2
$95,450
14
$66,132
86
$59,322
6
$32,082
5
$77,312
FILES CLOSED FOR INCOMPLETENESS
0
$0
0
$0
16
$51,005
0
$0
2
$53,290
Aggregated Statistics For Year 2000 (Based on 2 partial tracts)
A) FHA, FSA/RHS & VA Home Purchase Loans
B) Conventional Home Purchase Loans
C) Refinancings
D) Home Improvement Loans
E) Loans on Dwellings For 5+ Families
F) Non-occupant Loans on < 5 Family Dwellings (A B C & D)
Number
Average Value
Number
Average Value
Number
Average Value
Number
Average Value
Number
Average Value
Number
Average Value
LOANS ORIGINATED
32
$88,538
124
$60,515
130
$59,875
40
$18,254
2
$46,135
25
$56,951
APPLICATIONS APPROVED, NOT ACCEPTED
5
$55,996
62
$46,595
43
$60,080
2
$7,160
0
$0
2
$23,065
APPLICATIONS DENIED
13
$57,636
145
$39,869
119
$59,060
40
$12,726
0
$0
6
$7,953
APPLICATIONS WITHDRAWN
10
$64,746
30
$43,959
48
$55,744
14
$8,976
0
$0
3
$20,150
FILES CLOSED FOR INCOMPLETENESS
0
$0
0
$0
17
$47,911
2
$14,315
0
$0
0
$0
Aggregated Statistics For Year 1999 (Based on 1 partial tract)
A) FHA, FSA/RHS & VA Home Purchase Loans
B) Conventional Home Purchase Loans
C) Refinancings
D) Home Improvement Loans
F) Non-occupant Loans on < 5 Family Dwellings (A B C & D)
Detailed PMIC statistics for the following Tracts:0201.00
2002 - 2018 National Fire Incident Reporting System (NFIRS) incidents
Based on the data from the years 2002 - 2018 the average number of fires per year is 30. The highest number of reported fire incidents - 55 took place in 2010, and the least - 13 in 2002. The data has an increasing trend.
When looking into fire subcategories, the most reports belonged to: Outside Fires (42.4%), and Structure Fires (41.2%).
Fire incident types reported to NFIRS in Zip Code 32531


 Nearest zip codes: 32536, 36483, 32564, 32567, 32539, 32570.


 Based on the data from the years 2002 - 2018 the average number of fires per year is 30. The highest number of reported fire incidents - 55 took place in 2010, and the least - 13 in 2002. The data has an increasing trend.
 When looking into fire subcategories, the most reports belonged to: Outside Fires (42.4%), and Structure Fires (41.2%).