According to our research of Florida and other state lists, there was 1 registered sex offender living in 32542 zip code as of May 28, 2024. The ratio of all residents to sex offenders in zip code 32542 is 3,444 to 1. The ratio of registered sex offenders to all residents in this zip code is much lower than the state average.
Median resident age:
This zip code:
22.8 years
Florida median age:
42.7 years
Average household size:
This zip code:
2.9 people
Florida:
2.5 people
Averages for the 2020 tax year for zip code 32542, filed in 2021:
Average Adjusted Gross Income (AGI) in 2020: $43,248 (Individual Income Tax Returns)
Here:
$43,248
State:
$82,200
Salary/wage: $41,830 (reported on 99.3% of returns)
Here:
$41,830
State:
$58,347
(% of AGI for various income ranges: 1904.9% for AGIs below $25k, 3629.4% for AGIs $25k-50k, 6183.5% for AGIs $50k-75k, 8281.0% for AGIs $75k-100k, 17761.4% for AGIs $100k-200k)
Taxable interest for individuals: $221 (reported on 13.1% of returns)
This zip code:
$221
Florida:
$4,272
(% of AGI for various income ranges: 0.2% for AGIs below $25k, 2.1% for AGIs $25k-50k, 5.5% for AGIs $50k-75k, 10.0% for AGIs $75k-100k, 14.3% for AGIs $100k-200k)
Ordinary dividends: $713 (reported on 10.3% of returns)
Here:
$713
State:
$15,863
(% of AGI for various income ranges: 0.2% for AGIs below $25k, 0.6% for AGIs $25k-50k, 1.0% for AGIs $50k-75k, 9.0% for AGIs $75k-100k, 131.4% for AGIs $100k-200k)
Net capital gain/loss in AGI: +$2,041 (reported on 11.7% of returns)
Here:
+$2,041
State:
+$62,983
(% of AGI for various income ranges: 0.4% for AGIs below $25k, 10.4% for AGIs $25k-50k, 46.0% for AGIs $50k-75k, 291.4% for AGIs $100k-200k)
Profit/loss from business: +$1,182 (reported on 7.6% of returns)
Here:
+$1,182
State:
+$9,719
(% of AGI for various income ranges: 66.0% for AGIs $50k-75k, 12.0% for AGIs $75k-100k)
Earned income credit: $2,926 (reported on 21.4% of returns)
Here:
$2,926
State:
$2,306
(% of AGI for various income ranges: 49.8% for AGIs below $25k, 136.8% for AGIs $25k-50k)
Percentage of individuals using paid preparers for their 2020 taxes: 97.2%
Here:
97%
State:
92%
(% for various income ranges: 98.2% for AGIs below $25k, 95.8% for AGIs $25k-50k, 95.5% for AGIs $50k-75k, 100.0% for AGIs $75k-100k, 100.0% for AGIs $100k-200k)
Averages for the 2012 tax year for zip code 32542, filed in 2013:
Average Adjusted Gross Income (AGI) in 2012: $32,059 (Individual Income Tax Returns)
Here:
$32,059
State:
$60,316
Salary/wage: $31,322 (reported on 99.3% of returns)
Here:
$31,322
State:
$45,277
(% of AGI for various income ranges: 100.4% for AGIs below $25k, 100.2% for AGIs $25k-50k, 96.2% for AGIs $50k-75k, 93.1% for AGIs $75k-100k, 82.8% for AGIs $100k-200k)
Taxable interest for individuals: $244 (reported on 11.4% of returns)
This zip code:
$244
Florida:
$3,587
(% of AGI for various income ranges: 0.2% for AGIs $75k-100k, 0.3% for AGIs $100k-200k)
Ordinary dividends: $1,571 (reported on 5.0% of returns)
Here:
$1,571
State:
$12,831
(% of AGI for various income ranges: 0.2% for AGIs $50k-75k, 1.9% for AGIs $100k-200k)
Net capital gain/loss in AGI: +$540 (reported on 3.6% of returns)
Here:
+$540
State:
+$33,493
Profit/loss from business: +$420 (reported on 3.6% of returns)
Here:
+$420
State:
+$10,012
Total itemized deductions: $17,386 (23% of AGI, reported on 5.0% of returns)
Here:
$17,386
State:
$25,533
Here:
22.6% of AGI
State:
18.0% of AGI
Charity contributions: $2,983 (reported on 4.3% of returns)
Here:
$2,983
State:
$5,698
(% of AGI for various income ranges: 0.5% for AGIs $25k-50k, 2.5% for AGIs $75k-100k)
Taxes paid: $4,667 (reported on 4.3% of returns)
32542:
$4,667
State:
$6,203
Earned income credit: $2,580 (reported on 25.0% of returns)
Here:
$2,580
State:
$2,372
(% of AGI for various income ranges: 2.9% for AGIs below $25k, 3.6% for AGIs $25k-50k)
Percentage of individuals using paid preparers for their 2012 taxes: 27.1%
Here:
27%
State:
54%
(% for various income ranges: 27.0% for AGIs below $25k, 25.6% for AGIs $25k-50k, 28.6% for AGIs $50k-75k, 60.0% for AGIs $75k-100k)
Averages for the 2004 tax year for zip code 32542, filed in 2005:
Average Adjusted Gross Income (AGI) in 2004: $28,223 (Individual Income Tax Returns)
Here:
$28,223
State:
$50,523
Salary/wage: $27,937 (reported on 99.2% of returns)
Here:
$27,937
State:
$39,563
(% of AGI for various income ranges: 99.6% for AGIs below $10k, 100.3% for AGIs $10k-25k, 98.5% for AGIs $25k-50k, 97.2% for AGIs $50k-75k, 96.1% for AGIs $75k-100k, 88.0% for AGIs over 100k)
Taxable interest for individuals: $264 (reported on 19.2% of returns)
This zip code:
$264
Florida:
$3,211
(% of AGI for various income ranges: 0.3% for AGIs below $10k, 0.0% for AGIs $10k-25k, 0.2% for AGIs $25k-50k, 0.2% for AGIs $50k-75k, 0.5% for AGIs $75k-100k, 0.5% for AGIs over 100k)
Taxable dividends: $599 (reported on 8.1% of returns)
Here:
$599
State:
$6,129
(% of AGI for various income ranges: 0.7% for AGIs below $10k, 0.0% for AGIs $10k-25k, 0.1% for AGIs $25k-50k, 0.1% for AGIs $50k-75k, 0.4% for AGIs $75k-100k, 1.5% for AGIs over 100k)
Net capital gain/loss: +$567 (reported on 5.4% of returns)
Here:
+$567
State:
+$27,205
(% of AGI for various income ranges: 0.0% for AGIs $10k-25k, 0.1% for AGIs $25k-50k, -0.1% for AGIs $50k-75k, 0.0% for AGIs $75k-100k, 1.4% for AGIs over 100k)
Profit/loss from business: +$1,347 (reported on 5.4% of returns)
Here:
+$1,347
State:
+$10,634
IRA payment deduction: $2,220 (reported on 1.2% of returns)
32542:
$2,220
Florida:
$3,082
Total itemized deductions: $13,878 (21% of AGI, reported on 3.8% of returns)
Here:
$13,878
State:
$20,370
Here:
21.1% of AGI
State:
20.7% of AGI
(% of AGI for various income ranges: 0.4% for AGIs $10k-25k, 1.0% for AGIs $25k-50k, 3.1% for AGIs $50k-75k, 8.2% for AGIs $75k-100k, 7.0% for AGIs over 100k)
Charity contributions deductions: $3,884 (6% of AGI, reported on 3.2% of returns)
Here:
$3,884
State:
$4,064
Here:
5.6% of AGI
State:
3.8% of AGI
(% of AGI for various income ranges: 0.2% for AGIs $25k-50k, 0.5% for AGIs $50k-75k, 2.5% for AGIs $75k-100k, 2.6% for AGIs over 100k)
Total tax: $1,950 (reported on 63.8% of returns)
32542:
$1,950
State:
$9,431
(% of AGI for various income ranges: 1.1% for AGIs below $10k, 3.1% for AGIs $10k-25k, 3.0% for AGIs $25k-50k, 6.4% for AGIs $50k-75k, 8.8% for AGIs $75k-100k, 14.4% for AGIs over 100k)
Earned income credit: $1,841 (reported on 25.8% of returns)
Here:
$1,841
State:
$1,808
Percentage of individuals using paid preparers for their 2004 taxes: 61.3%
Here:
61%
State:
60%
(% for various income ranges: 49.0% for AGIs below $10k, 67.6% for AGIs $10k-25k, 59.9% for AGIs $25k-50k, 51.4% for AGIs $50k-75k, 34.4% for AGIs $75k-100k, 44.4% for AGIs over 100k)
Household received Food Stamps/SNAP in the past 12 months: 0 Household did not receive Food Stamps/SNAP in the past 12 months: 970
Women who had a birth in the past 12 months: 65 (58 now married, 9 unmarried) Women who did not have a birth in the past 12 months: 829 (596 now married, 233 unmarried)
Residents with income below the poverty level in 2022:
This zip code:
9.3%
Whole state:
12.7%
Residents with income below 50% of the poverty level in 2022:
This zip code:
2.6%
Whole state:
6.6%
Median number of rooms in apartments:
Here:
5.8
State:
4.2
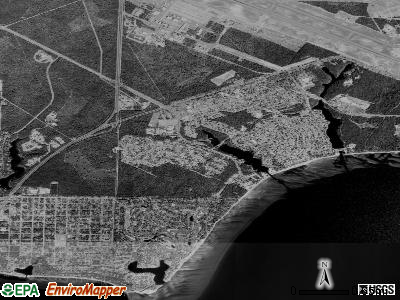
Notable locations in this zip code not listed on our city pages
In group quarters: 1,204 (-1 institutionalized population)
Size of family households: 172 2-persons, 322 3-persons, 256 4-persons, 32 5-persons
Size of nonfamily households: 169 1-person
879 married couples with children.
206 single-parent households (84 men, 122 women).
81.2% of residents of 32542 zip code speak English at home.
10.3% of residents speak Spanish at home (90% very well, 8% well, 2% not well).
2.6% of residents speak other Indo-European language at home (96% very well, 4% well).
4.7% of residents speak Asian or Pacific Island language at home (90% very well, 4% well, 6% not well).
Foreign born population: 205 (5.2%) (75.0% of them are naturalized citizens)
Facilities with environmental interests located in this zip code:
OAK HILL ELEMENTARY SCHOOL (101 CHINQUAPIN DRIVE in EGLIN AFB, FL)
(National Center for Education Statistics) - STATE ID-0441 Organizations: OKALOOSA COUNTY SCHOOL DISTRICT (SCHOOL DISTRICT)
SECURITY FENCING & BARRIERS & (ENTRY DRIVE TO DUKE FIELD E OF in EGLIN AFB, FL)
National Pollutant Discharge Elimination System NON-MAJOR (Tracking pollutant discharge elimination systems) - permit Organizations: KIRK HOBBS (CONTACT/OWNER)
HEATHER GLENN APARTMENTS (W. SIDE OF MLK JR. BLVD., INTE in FORT WALTON BEACH, FL)
National Pollutant Discharge Elimination System NON-MAJOR (Tracking pollutant discharge elimination systems) - permit Organizations: MICHAEL KAZUNAS (CONTACT/OWNER)
OKALOOSA COUNTY AIR TERMINAL (1701 SR 85N in EGLIN AIR FORCE BASE, FL)
National Pollutant Discharge Elimination System NON-MAJOR (Tracking pollutant discharge elimination systems) - permit Business SIC classification: AIRPORTS, FLYING FIELDS, AND AIRPORT TERMINAL SERVICES Organizations: JERRY SEALY (CONTACT/OWNER)
SOUTH APRON EXPANSION (1701 SR-85 in EGLIN AFB, FL)
National Pollutant Discharge Elimination System NON-MAJOR (Tracking pollutant discharge elimination systems) - permit Organizations: JERRY SEALY (CONTACT/OWNER)
126 FAMILY HOUSING UNITS (600' WEST OF AZALEA DRIVE in EGLIN AFB, FL)
National Pollutant Discharge Elimination System NON-MAJOR (Tracking pollutant discharge elimination systems) - permit Alternative names: HUNT BUILDING CORPORATION
NORTHWEST AIRLINES INC AT OKAL (STATE ROAD 85N in EGLIN AIR FORCE BASE, FL)
National Pollutant Discharge Elimination System NON-MAJOR (Tracking pollutant discharge elimination systems) - permit Business SIC classification: AIR TRANSPORTATION, SCHEDULED
OVERFLOW PARKING FACILITY (1701 STATE RD 85 N in EGLIN AFB, FL)
National Pollutant Discharge Elimination System NON-MAJOR (Tracking pollutant discharge elimination systems) - permit Alternative names: OKALOOSA REGIONAL AIRPORT
ALABAMA ELECTRIC COOPERATIVE (5 MI N OF PORTLAND in EGLIN AFB, FL)
CRITERIA AND HAZARDOUS AIR POLLUTANT INVENTORY (Inventory of air pollution sources) Business SIC classification: ELECTRIC SERVICES
Housing units lacking complete plumbing facilities: 0.8% Housing units lacking complete kitchen facilities: 5.8%
59.4%Electricity
38.5%Utility gas
2.3%No fuel used
Population in 1990: 13,431.
Place of birth for U.S.-born residents:
This state: 585
Northeast: 422
Midwest: 791
South: 997
West: 772
15% of the 32542 zip code residents lived in the same house 5 years ago. Out of people who lived in different houses, 15% lived in this county. Out of people who lived in different counties, 50% lived in Florida.
62% of the 32542 zip code residents lived in the same house 1 year ago. Out of people who lived in different houses, 7% moved from this county. Out of people who lived in different houses, 14% moved from different county within same state. Out of people who lived in different houses, 78% moved from different state. Out of people who lived in different houses, 10% moved from abroad.
Private vs. public school enrollment:
Students in private schools in grades 1 to 8 (elementary and middle school): 26
Here:
7.8%
Florida:
15.8%
Students in private schools in grades 9 to 12 (high school): 88
Here:
51.9%
Florida:
12.9%
Students in private undergraduate colleges: 91
Here:
25.8%
Florida:
23.6%
Occupation by median earnings in the past 12 months ($)
145,304Health diagnosing and treating practitioners and other technical occupations
83,042Installation, maintenance, and repair occupations
30,021Building and grounds cleaning and maintenance occupations
28,410Food preparation and serving related occupations
28,149Management occupations
26,594Construction and extraction occupations
Companies with federal contracts located in this zip code (EGLIN AFB, FL):
CAROL A DURHAM (307 BOATNER RD WARD 3A; small business) : $302,617 in 6 contractsfrom 2001 to 2005
Contracts for Nursing Services by Air Force Signed by year:2000: $0; 2001: $58,738; 2002: $59,612; 2003: $60,507; 2004: $61,422; 2005: $62,338; 2006: $0.
Biggest contracts:
$62,338 with Air Force for Nursing Services. Signed on 2005-09-06. Completion date: 2006-09-30.
$61,422, same as above.Signed on 2004-10-01. Completion date: 2005-09-30.
$60,507, same as above.Signed on 2003-10-01. Completion date: 2008-09-30.
$59,612, same as above.Signed on 2002-10-01. Completion date: 2003-10-12.
EGLIN LODGING (404 N 7TH ST STE C) : $195,376 in 6 contractsfrom 2004 to 2006
Contracts for Lease or Rental of Facilities -- Troop Housing Facilities, Lodging - Hotel/Motel by Air Force Signed by year:2000: $0; 2001: $0; 2002: $0; 2003: $0; 2004: $75,370; 2005: $85,006; 2006: $35,000.
Biggest contracts:
$50,370 with Air Force for Lease or Rental of Facilities -- Troop Housing Facilities. Signed on 2004-11-10. Completion date: 2005-09-30.
$46,092 with Air Force for Lodging - Hotel/Motel. Signed on 2005-10-01. Completion date: 2006-09-30.
$35,000 with Air Force for Lease or Rental of Facilities -- Troop Housing Facilities. Signed on 2006-06-09. Completion date: 2006-05-19.
$25,000 with Air Force for Lodging - Hotel/Motel. Signed on 2004-11-24. Completion date: 2005-04-01.
ANGEL L BURKE (248 BOWLES CRESCENT; small business) : $52,603 in 3 contractsfrom 2001 to 2002
$26,499 with Air Force for Patent and Trademark Services. Signed on 2002-10-01. Completion date: 2003-09-30.
$26,104, same as above.Signed on 2001-10-25. Completion date: 2002-09-30.
$0, same as above.Signed on 2001-10-25. Completion date: 2002-09-30.
MICHELLE R DILLARD (30 A LIN DRIVE; small business) : $25,334 in 2 contractsin 2001
$25,334 with Air Force for Nursing Services. Signed on 2001-01-23. Completion date: 2001-01-23.
$0, same as above.Signed on 2001-01-23. Completion date: 2001-01-23.
Top industries in this zip code by the number of employees in 2005:
Health Care and Social Assistance: General Medical and Surgical Hospitals (over 1000 employees: 1 establishment)
Professional, Scientific, and Technical Services: Research and Development in the Physical, Engineering, and Life Sciences (50-99: 1, 20-49: 1, 10-19: 1, 5-9: 1, 1-4: 2)
Professional, Scientific, and Technical Services: Computer Systems Design Services (50-99: 1, 10-19: 1, 1-4: 4)
Administrative and Support and Waste Management and Remediation Services: Janitorial Services (50-99: 1)
Real Estate and Rental and Leasing: Passenger Car Rental (10-19: 4, 5-9: 1, 1-4: 1)
People in group quarters in 2010:
1,317 people in military barracks and dormitories (nondisciplinary)
People in group quarters in 2000:
954 people in federal prisons and detention centers
13 people in wards in military hospitals for patients who have no usual home elsewhere
9 people in hospitals/wards and hospices for chronically ill
9 people in military hospitals or wards for chronically ill
5 people in military transient quarters for temporary residents
Fatal accident statistics in 2010:
Fatal accident count: 1
Vehicles involved in fatal accidents: 1
Fatal accidents caused by drunken drivers: 0
Fatalities: 1
Persons involved in fatal accidents: 1
Pedestrians involved in fatal accidents: 0
Home Mortgage Disclosure Act Aggregated Statistics For Year 2009 (Based on 2 partial tracts)
A) FHA, FSA/RHS & VA Home Purchase Loans
B) Conventional Home Purchase Loans
C) Refinancings
D) Home Improvement Loans
F) Non-occupant Loans on < 5 Family Dwellings (A B C & D)
Number
Average Value
Number
Average Value
Number
Average Value
Number
Average Value
Number
Average Value
LOANS ORIGINATED
13
$154,751
3
$213,280
35
$173,549
1
$4,800
2
$92,245
APPLICATIONS APPROVED, NOT ACCEPTED
2
$128,235
1
$84,780
1
$126,370
0
$0
1
$47,990
APPLICATIONS DENIED
3
$139,343
3
$148,587
11
$173,581
1
$87,980
3
$92,243
APPLICATIONS WITHDRAWN
2
$125,035
1
$298,590
8
$184,620
0
$0
1
$227,680
FILES CLOSED FOR INCOMPLETENESS
1
$68,250
0
$0
2
$160,495
2
$58,385
0
$0
Aggregated Statistics For Year 2008 (Based on 2 full and 2 partial tracts)
A) FHA, FSA/RHS & VA Home Purchase Loans
B) Conventional Home Purchase Loans
C) Refinancings
D) Home Improvement Loans
E) Loans on Dwellings For 5+ Families
F) Non-occupant Loans on < 5 Family Dwellings (A B C & D)
G) Loans On Manufactured Home Dwelling (A B C & D)
Number
Average Value
Number
Average Value
Number
Average Value
Number
Average Value
Number
Average Value
Number
Average Value
Number
Average Value
LOANS ORIGINATED
8
$164,892
5
$150,788
26
$138,632
6
$79,002
0
$0
5
$86,272
1
$76,250
APPLICATIONS APPROVED, NOT ACCEPTED
1
$47,450
1
$58,650
8
$114,518
0
$0
0
$0
1
$184,490
2
$65,100
APPLICATIONS DENIED
3
$118,727
2
$162,625
17
$170,969
4
$32,153
0
$0
2
$159,425
0
$0
APPLICATIONS WITHDRAWN
1
$190,890
2
$294,060
7
$153,333
1
$17,600
1
$170,090
1
$34,120
0
$0
FILES CLOSED FOR INCOMPLETENESS
0
$0
1
$144,500
4
$150,895
0
$0
0
$0
0
$0
0
$0
Aggregated Statistics For Year 2007 (Based on 2 full and 2 partial tracts)
A) FHA, FSA/RHS & VA Home Purchase Loans
B) Conventional Home Purchase Loans
C) Refinancings
D) Home Improvement Loans
F) Non-occupant Loans on < 5 Family Dwellings (A B C & D)
G) Loans On Manufactured Home Dwelling (A B C & D)
Number
Average Value
Number
Average Value
Number
Average Value
Number
Average Value
Number
Average Value
Number
Average Value
LOANS ORIGINATED
9
$163,692
27
$167,978
47
$142,727
11
$54,736
27
$143,806
1
$36,790
APPLICATIONS APPROVED, NOT ACCEPTED
1
$86,910
5
$137,672
10
$152,975
1
$13,330
6
$160,048
2
$55,185
APPLICATIONS DENIED
2
$113,570
8
$179,651
29
$178,659
10
$70,940
10
$238,364
0
$0
APPLICATIONS WITHDRAWN
1
$216,480
2
$164,490
14
$185,211
1
$90,640
1
$162,630
0
$0
FILES CLOSED FOR INCOMPLETENESS
1
$92,780
4
$152,708
6
$163,160
0
$0
2
$145,565
0
$0
Aggregated Statistics For Year 2006 (Based on 2 full and 2 partial tracts)
A) FHA, FSA/RHS & VA Home Purchase Loans
B) Conventional Home Purchase Loans
C) Refinancings
D) Home Improvement Loans
E) Loans on Dwellings For 5+ Families
F) Non-occupant Loans on < 5 Family Dwellings (A B C & D)
G) Loans On Manufactured Home Dwelling (A B C & D)
Number
Average Value
Number
Average Value
Number
Average Value
Number
Average Value
Number
Average Value
Number
Average Value
Number
Average Value
LOANS ORIGINATED
11
$198,108
59
$144,524
53
$136,690
11
$62,869
1
$458,020
34
$138,303
3
$71,270
APPLICATIONS APPROVED, NOT ACCEPTED
0
$0
8
$82,351
9
$137,329
2
$145,295
0
$0
2
$124,770
5
$59,352
APPLICATIONS DENIED
1
$26,130
17
$122,264
30
$147,765
7
$22,031
0
$0
10
$166,539
3
$41,790
APPLICATIONS WITHDRAWN
2
$228,210
6
$243,938
30
$125,729
2
$83,980
1
$359,910
3
$118,547
1
$64,520
FILES CLOSED FOR INCOMPLETENESS
1
$117,300
1
$213,280
4
$95,442
1
$71,980
0
$0
1
$42,660
0
$0
Aggregated Statistics For Year 2005 (Based on 2 full and 2 partial tracts)
A) FHA, FSA/RHS & VA Home Purchase Loans
B) Conventional Home Purchase Loans
C) Refinancings
D) Home Improvement Loans
F) Non-occupant Loans on < 5 Family Dwellings (A B C & D)
G) Loans On Manufactured Home Dwelling (A B C & D)
Number
Average Value
Number
Average Value
Number
Average Value
Number
Average Value
Number
Average Value
Number
Average Value
LOANS ORIGINATED
7
$186,010
44
$144,056
60
$127,879
8
$98,375
23
$126,623
2
$23,350
APPLICATIONS APPROVED, NOT ACCEPTED
2
$240,770
7
$70,550
7
$131,929
1
$125,300
2
$40,255
7
$70,550
APPLICATIONS DENIED
2
$162,895
17
$97,224
22
$112,675
7
$41,747
2
$101,840
15
$78,409
APPLICATIONS WITHDRAWN
3
$156,407
13
$93,505
37
$111,382
8
$188,566
2
$96,775
2
$25,380
FILES CLOSED FOR INCOMPLETENESS
1
$67,180
1
$83,180
2
$165,560
1
$74,650
1
$157,830
0
$0
Aggregated Statistics For Year 2004 (Based on 2 full and 2 partial tracts)
A) FHA, FSA/RHS & VA Home Purchase Loans
B) Conventional Home Purchase Loans
C) Refinancings
D) Home Improvement Loans
F) Non-occupant Loans on < 5 Family Dwellings (A B C & D)
G) Loans On Manufactured Home Dwelling (A B C & D)
Number
Average Value
Number
Average Value
Number
Average Value
Number
Average Value
Number
Average Value
Number
Average Value
LOANS ORIGINATED
7
$137,033
48
$116,110
62
$105,195
10
$18,666
19
$102,907
5
$39,300
APPLICATIONS APPROVED, NOT ACCEPTED
2
$93,845
7
$78,164
13
$54,492
2
$47,720
2
$90,645
8
$34,731
APPLICATIONS DENIED
4
$128,535
27
$92,729
35
$80,222
13
$45,012
5
$75,128
22
$60,233
APPLICATIONS WITHDRAWN
0
$0
9
$122,624
32
$99,128
2
$33,590
4
$123,570
2
$15,415
FILES CLOSED FOR INCOMPLETENESS
0
$0
2
$221,280
6
$79,713
0
$0
1
$34,120
0
$0
Aggregated Statistics For Year 2003 (Based on 2 full and 2 partial tracts)
A) FHA, FSA/RHS & VA Home Purchase Loans
B) Conventional Home Purchase Loans
C) Refinancings
D) Home Improvement Loans
E) Loans on Dwellings For 5+ Families
F) Non-occupant Loans on < 5 Family Dwellings (A B C & D)
Number
Average Value
Number
Average Value
Number
Average Value
Number
Average Value
Number
Average Value
Number
Average Value
LOANS ORIGINATED
13
$111,193
35
$100,749
121
$102,075
4
$46,522
1
$16,000
22
$81,702
APPLICATIONS APPROVED, NOT ACCEPTED
0
$0
4
$111,305
19
$74,732
2
$17,330
0
$0
4
$62,118
APPLICATIONS DENIED
2
$119,705
10
$70,876
46
$82,201
3
$27,370
0
$0
6
$122,053
APPLICATIONS WITHDRAWN
3
$84,067
7
$75,077
29
$76,346
0
$0
0
$0
5
$69,810
FILES CLOSED FOR INCOMPLETENESS
0
$0
2
$37,055
4
$66,250
1
$16,000
0
$0
1
$12,800
Aggregated Statistics For Year 2002 (Based on 2 full and 2 partial tracts)
A) FHA, FSA/RHS & VA Home Purchase Loans
B) Conventional Home Purchase Loans
C) Refinancings
D) Home Improvement Loans
E) Loans on Dwellings For 5+ Families
F) Non-occupant Loans on < 5 Family Dwellings (A B C & D)
Number
Average Value
Number
Average Value
Number
Average Value
Number
Average Value
Number
Average Value
Number
Average Value
LOANS ORIGINATED
17
$92,401
23
$79,259
69
$104,917
5
$22,182
1
$74,650
13
$70,998
APPLICATIONS APPROVED, NOT ACCEPTED
1
$80,510
13
$50,981
13
$83,149
2
$35,460
0
$0
1
$23,990
APPLICATIONS DENIED
2
$86,380
19
$44,585
26
$81,478
2
$11,465
0
$0
2
$67,450
APPLICATIONS WITHDRAWN
1
$163,160
5
$87,214
21
$85,071
1
$82,650
0
$0
2
$49,055
FILES CLOSED FOR INCOMPLETENESS
0
$0
1
$23,460
6
$258,612
0
$0
0
$0
1
$23,460
Aggregated Statistics For Year 2001 (Based on 2 full and 2 partial tracts)
A) FHA, FSA/RHS & VA Home Purchase Loans
B) Conventional Home Purchase Loans
C) Refinancings
D) Home Improvement Loans
F) Non-occupant Loans on < 5 Family Dwellings (A B C & D)
Number
Average Value
Number
Average Value
Number
Average Value
Number
Average Value
Number
Average Value
LOANS ORIGINATED
21
$79,993
27
$93,654
59
$96,771
5
$21,648
13
$74,074
APPLICATIONS APPROVED, NOT ACCEPTED
2
$46,920
21
$46,755
7
$148,459
2
$17,860
2
$120,235
APPLICATIONS DENIED
2
$58,120
39
$54,328
36
$65,612
7
$12,107
1
$146,630
APPLICATIONS WITHDRAWN
1
$37,320
8
$96,831
22
$118,672
1
$18,660
0
$0
FILES CLOSED FOR INCOMPLETENESS
0
$0
2
$86,695
2
$110,640
0
$0
0
$0
Aggregated Statistics For Year 2000 (Based on 2 full and 2 partial tracts)
A) FHA, FSA/RHS & VA Home Purchase Loans
B) Conventional Home Purchase Loans
C) Refinancings
D) Home Improvement Loans
F) Non-occupant Loans on < 5 Family Dwellings (A B C & D)
Number
Average Value
Number
Average Value
Number
Average Value
Number
Average Value
Number
Average Value
LOANS ORIGINATED
17
$83,054
54
$50,607
18
$48,018
5
$27,326
7
$37,239
APPLICATIONS APPROVED, NOT ACCEPTED
4
$55,490
39
$39,615
5
$57,586
2
$36,260
1
$33,590
APPLICATIONS DENIED
1
$77,850
117
$35,279
31
$57,440
8
$17,891
6
$49,868
APPLICATIONS WITHDRAWN
4
$40,890
7
$54,997
19
$43,004
2
$24,795
2
$9,635
FILES CLOSED FOR INCOMPLETENESS
1
$49,050
0
$0
1
$71,450
0
$0
1
$27,730
Aggregated Statistics For Year 1999 (Based on 2 partial tracts)
A) FHA, FSA/RHS & VA Home Purchase Loans
B) Conventional Home Purchase Loans
C) Refinancings
D) Home Improvement Loans
F) Non-occupant Loans on < 5 Family Dwellings (A B C & D)


 Nearest zip codes: 32580, 32579, 32578, 32541, 32548, 32547.