Estimated zip code population in 2022: 293 Zip code population in 2010: 510 Zip code population in 2000: 575
Houses and condos: 173 Renter-occupied apartments: 36
% of renters here:
25%
State:
33%
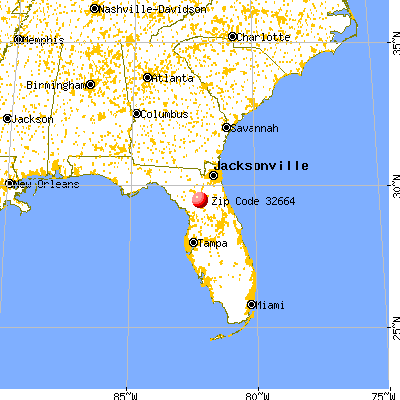
March 2022 cost of living index in zip code 32664: 82.8 (low, U.S. average is 100)
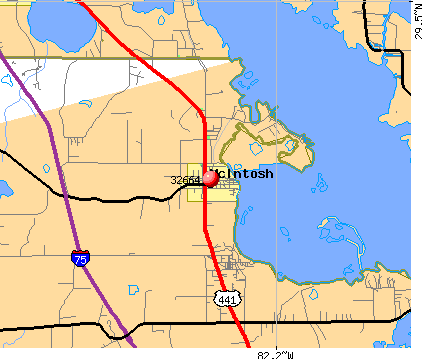
Land area: 1.4 sq. mi. Water area: 0.0 sq. mi.
Population density: 207 people per square mile
(very low).
OSM Map
General Map
Google Map
MSN Map
OSM Map
General Map
Google Map
MSN Map
OSM Map
General Map
Google Map
MSN Map
OSM Map
General Map
Google Map
MSN Map
Please wait while loading the map...
Real estate property taxes paid for housing units in 2022:
This zip code:
0.5% ($1,729)
Florida:
0.7% ($2,529)
Median real estate property taxes paid for housing units with mortgages in 2022: $1,831 (0.4%) Median real estate property taxes paid for housing units with no mortgage in 2022: $1,649 (0.8%)
Business Search- 14 Million verified businesses
Males: 119
(40.7%)
Females: 173
(59.3%)
For population 25 years and over in 32664:
High school or higher: 100.3%
Bachelor's degree or higher: 42.3%
Graduate or professional degree: 11.3%
Mean travel time to work (commute): 24.1 minutes
For population 15 years and over in 32664:
Never married: 11.0%
Now married: 56.5%
Separated: 0.0%
Widowed: 10.1%
Divorced: 22.3%
Zip code 32664 compared to state average:
Unemployed percentage significantly below state average.
Black race population percentage significantly below state average.
Hispanic race population percentage significantly below state average.
Median age significantly above state average.
Foreign-born population percentage significantly below state average.
Length of stay since moving in significantly above state average.
Estimated median house/condo value in 2022: $323,198
32664:
$323,198
Florida:
$354,100
Median resident age:
This zip code:
60.5 years
Florida median age:
42.7 years
Average household size:
This zip code:
2.0 people
Florida:
2.5 people
Averages for the 2004 tax year for zip code 32664, filed in 2005:
Average Adjusted Gross Income (AGI) in 2004: $41,968 (Individual Income Tax Returns)
Here:
$41,968
State:
$50,523
Salary/wage: $37,518 (reported on 73.6% of returns)
Here:
$37,518
State:
$39,563
(% of AGI for various income ranges: 83.1% for AGIs below $10k, 70.4% for AGIs $10k-25k, 68.5% for AGIs $25k-50k, 72.9% for AGIs $50k-75k, 77.7% for AGIs $75k-100k, 53.2% for AGIs over 100k)
Taxable interest for individuals: $1,822 (reported on 45.1% of returns)
This zip code:
$1,822
Florida:
$3,211
(% of AGI for various income ranges: 6.2% for AGIs below $10k, 3.2% for AGIs $10k-25k, 2.3% for AGIs $25k-50k, 1.9% for AGIs $50k-75k, 0.5% for AGIs $75k-100k, 1.6% for AGIs over 100k)
Taxable dividends: $1,673 (reported on 27.7% of returns)
Here:
$1,673
State:
$6,129
(% of AGI for various income ranges: 11.5% for AGIs below $10k, 1.5% for AGIs $10k-25k, 1.2% for AGIs $25k-50k, 1.6% for AGIs $50k-75k, 0.6% for AGIs over 100k)
Net capital gain/loss: +$5,468 (reported on 20.5% of returns)
Here:
+$5,468
State:
+$27,205
(% of AGI for various income ranges: -6.5% for AGIs below $10k, -0.8% for AGIs $10k-25k, -0.4% for AGIs $25k-50k, -0.3% for AGIs $50k-75k, 9.0% for AGIs over 100k)
Profit/loss from business: +$3,203 (reported on 21.1% of returns)
Here:
+$3,203
State:
+$10,634
(% of AGI for various income ranges: 14.2% for AGIs below $10k, 6.6% for AGIs $10k-25k, 4.7% for AGIs $25k-50k, -2.4% for AGIs $50k-75k)
IRA payment deduction: $3,143 (reported on 3.7% of returns)
32664:
$3,143
Florida:
$3,082
Total itemized deductions: $14,938 (20% of AGI, reported on 21.6% of returns)
Here:
$14,938
State:
$20,370
Here:
20.4% of AGI
State:
20.7% of AGI
(% of AGI for various income ranges: 12.4% for AGIs $10k-25k, 9.7% for AGIs $25k-50k, 7.0% for AGIs $50k-75k, 6.8% for AGIs $75k-100k, 5.8% for AGIs over 100k)
Charity contributions deductions: $2,952 (4% of AGI, reported on 16.8% of returns)
Here:
$2,952
State:
$4,064
Here:
3.9% of AGI
State:
3.8% of AGI
(% of AGI for various income ranges: 1.2% for AGIs $10k-25k, 1.4% for AGIs $25k-50k, 1.4% for AGIs $50k-75k, 1.4% for AGIs over 100k)
Total tax: $6,714 (reported on 75.5% of returns)
32664:
$6,714
State:
$9,431
(% of AGI for various income ranges: 3.8% for AGIs below $10k, 4.0% for AGIs $10k-25k, 8.5% for AGIs $25k-50k, 9.5% for AGIs $50k-75k, 10.5% for AGIs $75k-100k, 19.7% for AGIs over 100k)
Earned income credit: $1,841 (reported on 16.8% of returns)
Here:
$1,841
State:
$1,808
Percentage of individuals using paid preparers for their 2004 taxes: 59.7%
Here:
60%
State:
60%
(% for various income ranges: 50.7% for AGIs below $10k, 65.8% for AGIs $10k-25k, 56.1% for AGIs $25k-50k, 64.6% for AGIs $50k-75k, 43.5% for AGIs $75k-100k, 75.0% for AGIs over 100k)
Likely homosexual households (counted as self-reported same-sex unmarried-partner households)
Lesbian couples: 0.0% of all households
Gay men: 1.4% of all households
Household received Food Stamps/SNAP in the past 12 months: 20 Household did not receive Food Stamps/SNAP in the past 12 months: 123
Women who did not have a birth in the past 12 months: 37 (21 now married, 16 unmarried)
Housing units in zip code 32664 with a mortgage: 44 Median monthly owner costs for units with a mortgage: $1,577 Median monthly owner costs for units without a mortgage: $398
Residents with income below the poverty level in 2022:
This zip code:
7.0%
Whole state:
12.7%
Median number of rooms in houses and condos:
Here:
5.5
State:
5.9
Median number of rooms in apartments:
Here:
5.6
State:
4.2
Notable locations in this zip code not listed on our city pages
Churches in zip code 32664 include: First Baptist Church of McIntosh (A), McIntosh United Methodist Church (B), McIntosh Presbyterian Church (C), McIntosh Christian Church (D), Zion Bethel Baptist Church (E). Display/hide their locations on the map
Size of family households: 44 2-persons, 7 3-persons, 9 4-persons, 13 6-persons
Size of nonfamily households: 61 1-person, 9 4-persons
51 married couples with children.
0 single-parent households ().
100.4% of residents of 32664 zip code speak English at home.
Foreign born population: 8 (2.8%) (100.0% of them are naturalized citizens)
This zip code:
2.8%
Whole state:
21.7%
100%France
47%Irish
12%English
12%European
8%Scottish
6%French
6%Scandinavian
4%Danish
Year of entry for the foreign-born population
02010 or later
02000 to 2009
01990 to 1999
12Before 1990
Housing units lacking complete plumbing facilities: 7.8%
97.6%Electricity
2.9%Bottled, tank, or LP gas
Place of birth for U.S.-born residents:
This state: 142
Northeast: 51
Midwest: 38
South: 29
West: 14
44% of the 32664 zip code residents lived in the same house 5 years ago. Out of people who lived in different houses, 18% lived in this county. Out of people who lived in different counties, 50% lived in Florida.
100% of the 32664 zip code residents lived in the same house 1 year ago.
Private vs. public school enrollment:
Students in private schools in grades 1 to 8 (elementary and middle school):
Here:
0.0%
Florida:
15.8%
Students in private undergraduate colleges:
Here:
0.0%
Florida:
23.6%
Top industries in this zip code by the number of employees in 2005:
Health Care and Social Assistance: Offices of Physicians (except Mental Health Specialists) (10-19 employees: 1 establishment)
Educational Services: Elementary and Secondary Schools (5-9: 1, 1-4: 1)
Administrative and Support and Waste Management and Remediation Services: Landscaping Services (1-4: 1)
Construction: Roofing Contractors (1-4: 1)
Professional, Scientific, and Technical Services: Other Computer Related Services (1-4: 1)
Accommodation and Food Services: Full-Service Restaurants (1-4: 1)
Professional, Scientific, and Technical Services: Offices of Certified Public Accountants (1-4: 1)
Other Services (except Public Administration): Religious Organizations (1-4: 1)
Health Care and Social Assistance: Child Day Care Services (1-4: 1)
Home Mortgage Disclosure Act Aggregated Statistics For Year 2009 (Based on 2 partial tracts)
A) FHA, FSA/RHS & VA Home Purchase Loans
B) Conventional Home Purchase Loans
C) Refinancings
D) Home Improvement Loans
G) Loans On Manufactured Home Dwelling (A B C & D)
Number
Average Value
Number
Average Value
Number
Average Value
Number
Average Value
Number
Average Value
LOANS ORIGINATED
1
$78,420
1
$57,900
2
$156,100
0
$0
1
$55,730
APPLICATIONS APPROVED, NOT ACCEPTED
0
$0
0
$0
0
$0
0
$0
0
$0
APPLICATIONS DENIED
0
$0
0
$0
2
$158,990
1
$19,890
1
$93,880
APPLICATIONS WITHDRAWN
0
$0
0
$0
1
$112,100
0
$0
0
$0
FILES CLOSED FOR INCOMPLETENESS
0
$0
0
$0
0
$0
0
$0
0
$0
Aggregated Statistics For Year 2008 (Based on 2 partial tracts)
B) Conventional Home Purchase Loans
C) Refinancings
D) Home Improvement Loans
G) Loans On Manufactured Home Dwelling (A B C & D)
Number
Average Value
Number
Average Value
Number
Average Value
Number
Average Value
LOANS ORIGINATED
1
$187,130
2
$145,770
0
$0
1
$63,690
APPLICATIONS APPROVED, NOT ACCEPTED
0
$0
1
$135,600
0
$0
1
$47,730
APPLICATIONS DENIED
1
$101,430
5
$124,336
1
$142,830
3
$81,360
APPLICATIONS WITHDRAWN
0
$0
1
$156,620
1
$53,340
0
$0
FILES CLOSED FOR INCOMPLETENESS
0
$0
0
$0
0
$0
0
$0
Aggregated Statistics For Year 2007 (Based on 2 partial tracts)
B) Conventional Home Purchase Loans
C) Refinancings
D) Home Improvement Loans
F) Non-occupant Loans on < 5 Family Dwellings (A B C & D)
G) Loans On Manufactured Home Dwelling (A B C & D)
Number
Average Value
Number
Average Value
Number
Average Value
Number
Average Value
Number
Average Value
LOANS ORIGINATED
2
$162,765
5
$150,028
1
$61,430
1
$100,710
3
$72,260
APPLICATIONS APPROVED, NOT ACCEPTED
1
$66,940
1
$179,040
1
$15,820
0
$0
1
$53,340
APPLICATIONS DENIED
1
$206,790
5
$148,608
2
$59,530
1
$66,580
2
$76,050
APPLICATIONS WITHDRAWN
0
$0
2
$115,170
0
$0
0
$0
0
$0
FILES CLOSED FOR INCOMPLETENESS
0
$0
1
$138,990
0
$0
0
$0
0
$0
Aggregated Statistics For Year 2006 (Based on 2 partial tracts)
B) Conventional Home Purchase Loans
C) Refinancings
D) Home Improvement Loans
F) Non-occupant Loans on < 5 Family Dwellings (A B C & D)
G) Loans On Manufactured Home Dwelling (A B C & D)
Number
Average Value
Number
Average Value
Number
Average Value
Number
Average Value
Number
Average Value
LOANS ORIGINATED
3
$188,393
5
$149,928
1
$98,260
1
$236,350
3
$82,687
APPLICATIONS APPROVED, NOT ACCEPTED
1
$73,500
1
$159,100
0
$0
0
$0
0
$0
APPLICATIONS DENIED
2
$195,130
6
$141,762
2
$40,860
1
$120,190
3
$79,763
APPLICATIONS WITHDRAWN
0
$0
3
$129,483
0
$0
0
$0
1
$50,170
FILES CLOSED FOR INCOMPLETENESS
0
$0
1
$116,750
0
$0
0
$0
0
$0
Aggregated Statistics For Year 2005 (Based on 2 partial tracts)
B) Conventional Home Purchase Loans
C) Refinancings
D) Home Improvement Loans
F) Non-occupant Loans on < 5 Family Dwellings (A B C & D)
G) Loans On Manufactured Home Dwelling (A B C & D)
Number
Average Value
Number
Average Value
Number
Average Value
Number
Average Value
Number
Average Value
LOANS ORIGINATED
3
$199,167
4
$151,738
1
$55,280
1
$166,020
2
$60,525
APPLICATIONS APPROVED, NOT ACCEPTED
1
$94,330
1
$150,920
0
$0
0
$0
0
$0
APPLICATIONS DENIED
2
$99,755
5
$122,954
1
$40,820
0
$0
2
$65,450
APPLICATIONS WITHDRAWN
1
$80,770
2
$153,905
0
$0
0
$0
0
$0
FILES CLOSED FOR INCOMPLETENESS
0
$0
1
$139,530
0
$0
0
$0
0
$0
Aggregated Statistics For Year 2004 (Based on 2 partial tracts)
B) Conventional Home Purchase Loans
C) Refinancings
D) Home Improvement Loans
F) Non-occupant Loans on < 5 Family Dwellings (A B C & D)
G) Loans On Manufactured Home Dwelling (A B C & D)
Number
Average Value
Number
Average Value
Number
Average Value
Number
Average Value
Number
Average Value
LOANS ORIGINATED
4
$132,245
4
$95,835
1
$32,540
1
$110,690
2
$79,780
APPLICATIONS APPROVED, NOT ACCEPTED
0
$0
2
$53,810
0
$0
0
$0
1
$42,620
APPLICATIONS DENIED
1
$82,990
5
$84,732
2
$30,105
0
$0
2
$58,080
APPLICATIONS WITHDRAWN
0
$0
3
$82,007
0
$0
0
$0
1
$33,270
FILES CLOSED FOR INCOMPLETENESS
0
$0
0
$0
0
$0
0
$0
0
$0
Aggregated Statistics For Year 2003 (Based on 2 partial tracts)
B) Conventional Home Purchase Loans
C) Refinancings
D) Home Improvement Loans
F) Non-occupant Loans on < 5 Family Dwellings (A B C & D)
Number
Average Value
Number
Average Value
Number
Average Value
Number
Average Value
LOANS ORIGINATED
3
$142,290
8
$119,910
0
$0
1
$107,350
APPLICATIONS APPROVED, NOT ACCEPTED
1
$123,220
1
$122,540
0
$0
0
$0
APPLICATIONS DENIED
1
$123,980
5
$82,364
1
$30,060
0
$0
APPLICATIONS WITHDRAWN
0
$0
2
$114,605
0
$0
0
$0
FILES CLOSED FOR INCOMPLETENESS
0
$0
0
$0
0
$0
0
$0
Aggregated Statistics For Year 2002 (Based on 2 partial tracts)
B) Conventional Home Purchase Loans
C) Refinancings
Number
Average Value
Number
Average Value
LOANS ORIGINATED
2
$89,315
5
$84,650
APPLICATIONS APPROVED, NOT ACCEPTED
0
$0
1
$49,860
APPLICATIONS DENIED
1
$82,080
4
$62,750
APPLICATIONS WITHDRAWN
0
$0
1
$150,560
FILES CLOSED FOR INCOMPLETENESS
0
$0
0
$0
Aggregated Statistics For Year 2001 (Based on 2 partial tracts)
B) Conventional Home Purchase Loans
C) Refinancings
D) Home Improvement Loans
Number
Average Value
Number
Average Value
Number
Average Value
LOANS ORIGINATED
3
$84,073
4
$83,428
1
$21,650
APPLICATIONS APPROVED, NOT ACCEPTED
1
$66,580
1
$48,950
0
$0
APPLICATIONS DENIED
3
$45,970
4
$70,095
1
$8,810
APPLICATIONS WITHDRAWN
0
$0
1
$90,630
0
$0
FILES CLOSED FOR INCOMPLETENESS
0
$0
0
$0
0
$0
Aggregated Statistics For Year 2000 (Based on 2 partial tracts)
B) Conventional Home Purchase Loans
C) Refinancings
D) Home Improvement Loans
F) Non-occupant Loans on < 5 Family Dwellings (A B C & D)
Number
Average Value
Number
Average Value
Number
Average Value
Number
Average Value
LOANS ORIGINATED
4
$54,908
1
$78,600
1
$10,220
1
$34,350
APPLICATIONS APPROVED, NOT ACCEPTED
1
$50,900
1
$55,600
0
$0
0
$0
APPLICATIONS DENIED
3
$56,290
3
$63,717
1
$10,670
0
$0
APPLICATIONS WITHDRAWN
0
$0
1
$77,650
0
$0
0
$0
FILES CLOSED FOR INCOMPLETENESS
0
$0
0
$0
0
$0
0
$0
Aggregated Statistics For Year 1999 (Based on 1 partial tract)


 Nearest zip codes: 32681, 32686, 32667, 32113, 32640, 34475.


